Use filters to narrow down the data displayed in a chart when editing a dashboard or workbook. Filters support string, numeric, and date data types.
Quick BI applies different filter options depending on the data type of the field:
String fields: Filter by matching or excluding specific values, either by selecting from a list or entering conditions.
Numeric fields: Filter by specifying a value range or comparison condition, such as greater than or equal to a threshold.
-
Date fields: Filter by a fixed date range (exact time) or a dynamic range that updates over time (relative time).
Filter data of the string type
The following example filters the province field to show only municipalities.
Filter data to obtain municipalities
In the Filters section, click the
 icon next to the province field and set the filter scope.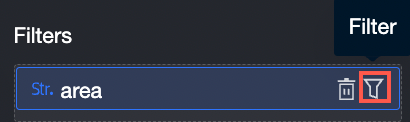
-
Configure the filter based on your requirements.
Parameter
Description
Example
Filter Method
Valid values: By Condition and By Enumeration.
By Enumeration
Conditional Form
Valid values: Single Condition, OR, AND.
NoteConditional Form applies only when Filter Method is set to By Condition.
N/A
Method
Valid values: Single Choice and Multiple Choice.
NoteMethod applies only when Filter Method is set to By Enumeration.
Multiple choice
Filter conditions
Set the filter condition based on your requirements.
Shanghai, Tianjin, Beijing, Chongqing
-
When setting a filter condition, click Quick input to enter values directly.
Alternatively, add values from the list, as shown in the following figure.
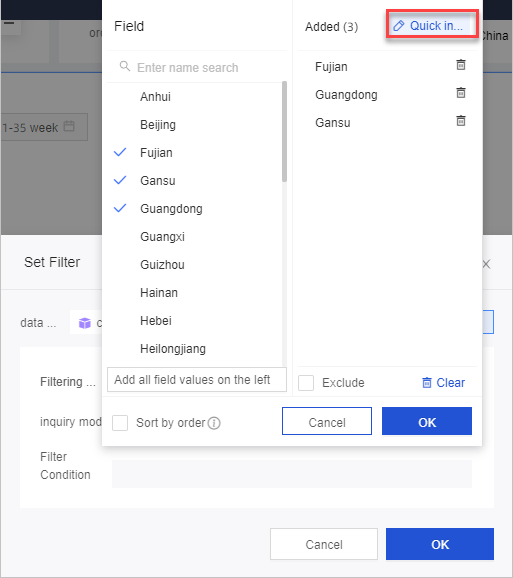
In the Field pane, the following operations are available:
Enter a keyword in the search box and click the field name to add it to the Added section on the right.
Click Add all field values on the left to add all field values to the Added section.
Select field names on the left to add them to the Added section.
Select Exclude at the bottom of the Added section to exclude the selected field values from the Added section.
Click Clear to clear the Added section.
Click OK.
Click Update. The chart updates based on the filter settings.
Filter data of the numeric type
Specify a value range to filter numeric fields. For example, filter order quantity to include only values between 50,000 and 100,000. The chart updates to show only data within the specified range.
Filter data within a specified profit range
In the Filters section, click the
icon next to the Profit Amount field. 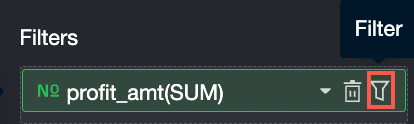
In the Set Filter dialog box, set the filter condition. For example, select >(Greater than), <(Less than), or =(Equal to).
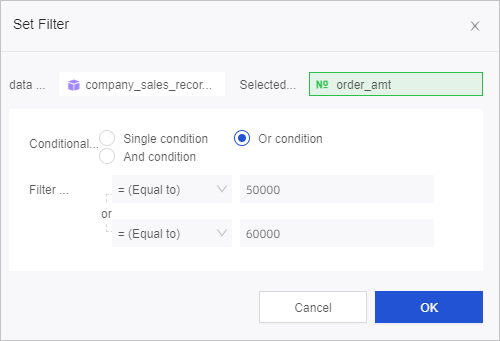
Click OK.
Click Update. The chart updates based on the filter settings.
Filter data of the date type
Filter date fields to show data within a specific time range. For example, show order amounts by region for the previous three days.
Date filters support two modes:
Relative time: A dynamic range that shifts as time passes — for example, "the previous 3 days" always refers to the 3 days before today. Use this mode when you want the chart to stay current without reconfiguring the filter.
-
Exact time: A fixed range that always refers to the same dates — for example, January 1–March 31, 2025. Use this mode when you need to analyze a specific historical period.
NoteFilter conditions can be accurate to the second.
Filter order date (day)
In the Filters section, click the
 icon next to the day) field.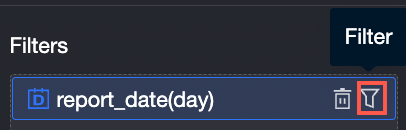
-
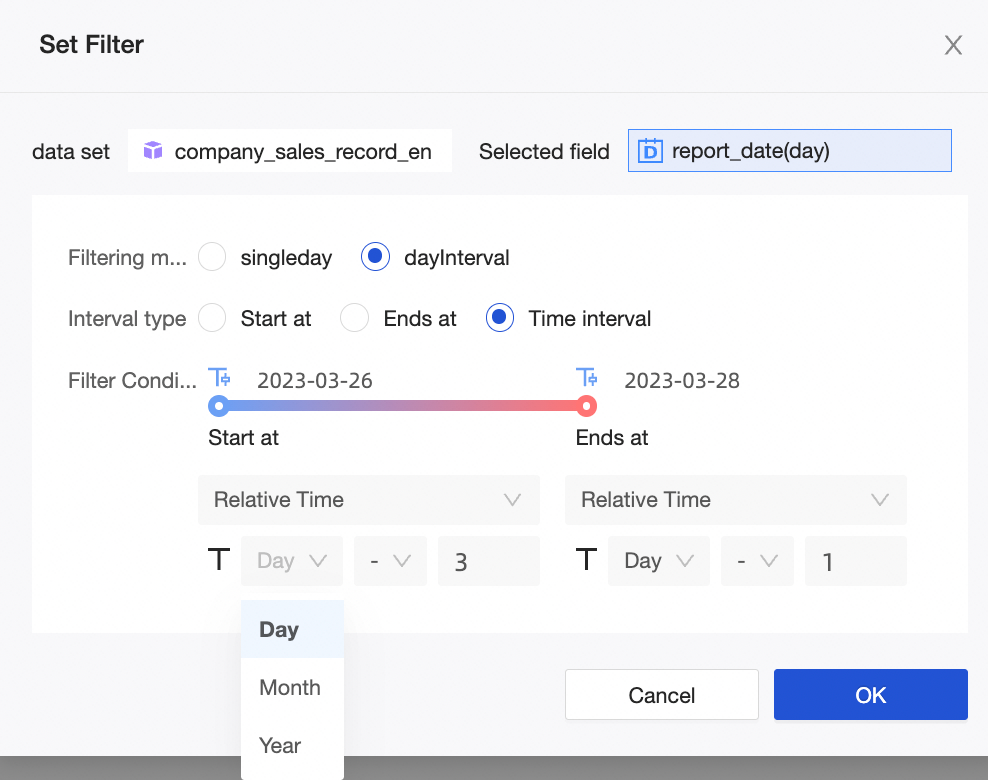
Configure the filter based on your requirements.
Parameter
Description
Example
Filter Method
Valid values: single-day and daily interval.
daily interval
Interval Type
Valid values: Start At, End At, and Time Interval.
NoteInterval Type applies only when Filter Method is set to Year Interval.
Time Interval
Filter conditions
Valid values: Relative Time and Exact Time.
Relative
 Note
NoteWhen setting relative time, the granularity of T supports all granularities included in the current time granularity. For example, if the current time granularity is year-month-day, you can select year, month, or day from the dropdown. If the current time granularity is year-month-day-hour-minute-second, you can set T to year, month, day, hour, minute, or second.
Click OK.
Click Update. The chart updates based on the filter settings.