Use the comparison feature to calculate the difference between two measures of the same dimension at specific time intervals, such as year-over-year (YoY) or period-over-period changes.
Prerequisites
-
The dashboard is created. For more information, see Create a Dashboard.
-
A dataset is selected and chart fields are configured. For more information, see Configure Chart Fields.
-
If the comparison calculation depends on dynamic date filtering, make sure you have added and configured the corresponding filter bar. For more information, see Create a filter bar.
In Comparison Settings, you must select date fields for the Date field parameter and the corresponding date filter conditions. Date placeholders are not supported.
Background Information
-
Period-over-period comparison: Compares data with the previous statistical period. For example, a comparison between January 2021 and December 2020 is a period-over-period comparison.
-
Same-period comparison: Compares data with the same period of the previous cycle. For example, a comparison between January 2021 and January 2020 is a same-period comparison.
Supported Comparison Types for Date Fields
|
Date field category |
Example |
Year-over-Year (YoY) and Month-over-Month (MoM) |
|
Year |
Order date (year) |
|
|
Quarterly granularity field |
Order date (quarter) |
|
|
Month Granularity Field |
Order date (month) |
|
|
Weekly granularity field |
Order week |
|
|
Daily Granularity |
Order Date |
|
Configuration Entry
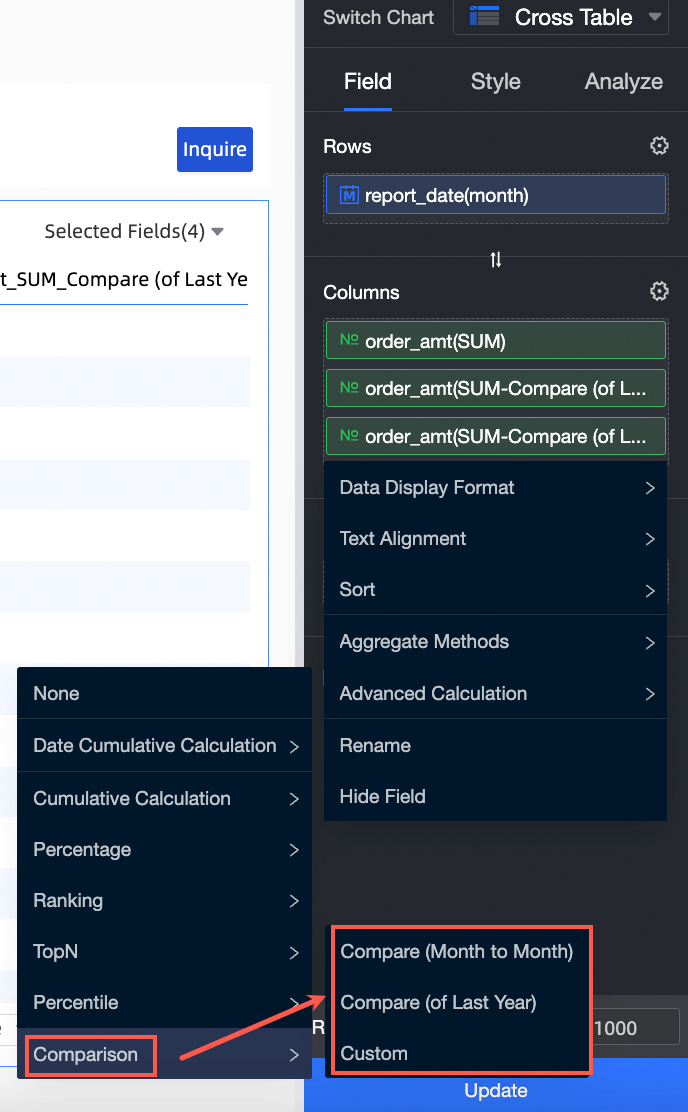
Take a cross table as an example. Hover over a measure field, click the ![]() icon on the right, select Advanced Calculation -> Comparison, and select the comparison type you need based on your business scenario. You can configure Custom comparison and Quick comparison,
icon on the right, select Advanced Calculation -> Comparison, and select the comparison type you need based on your business scenario. You can configure Custom comparison and Quick comparison, 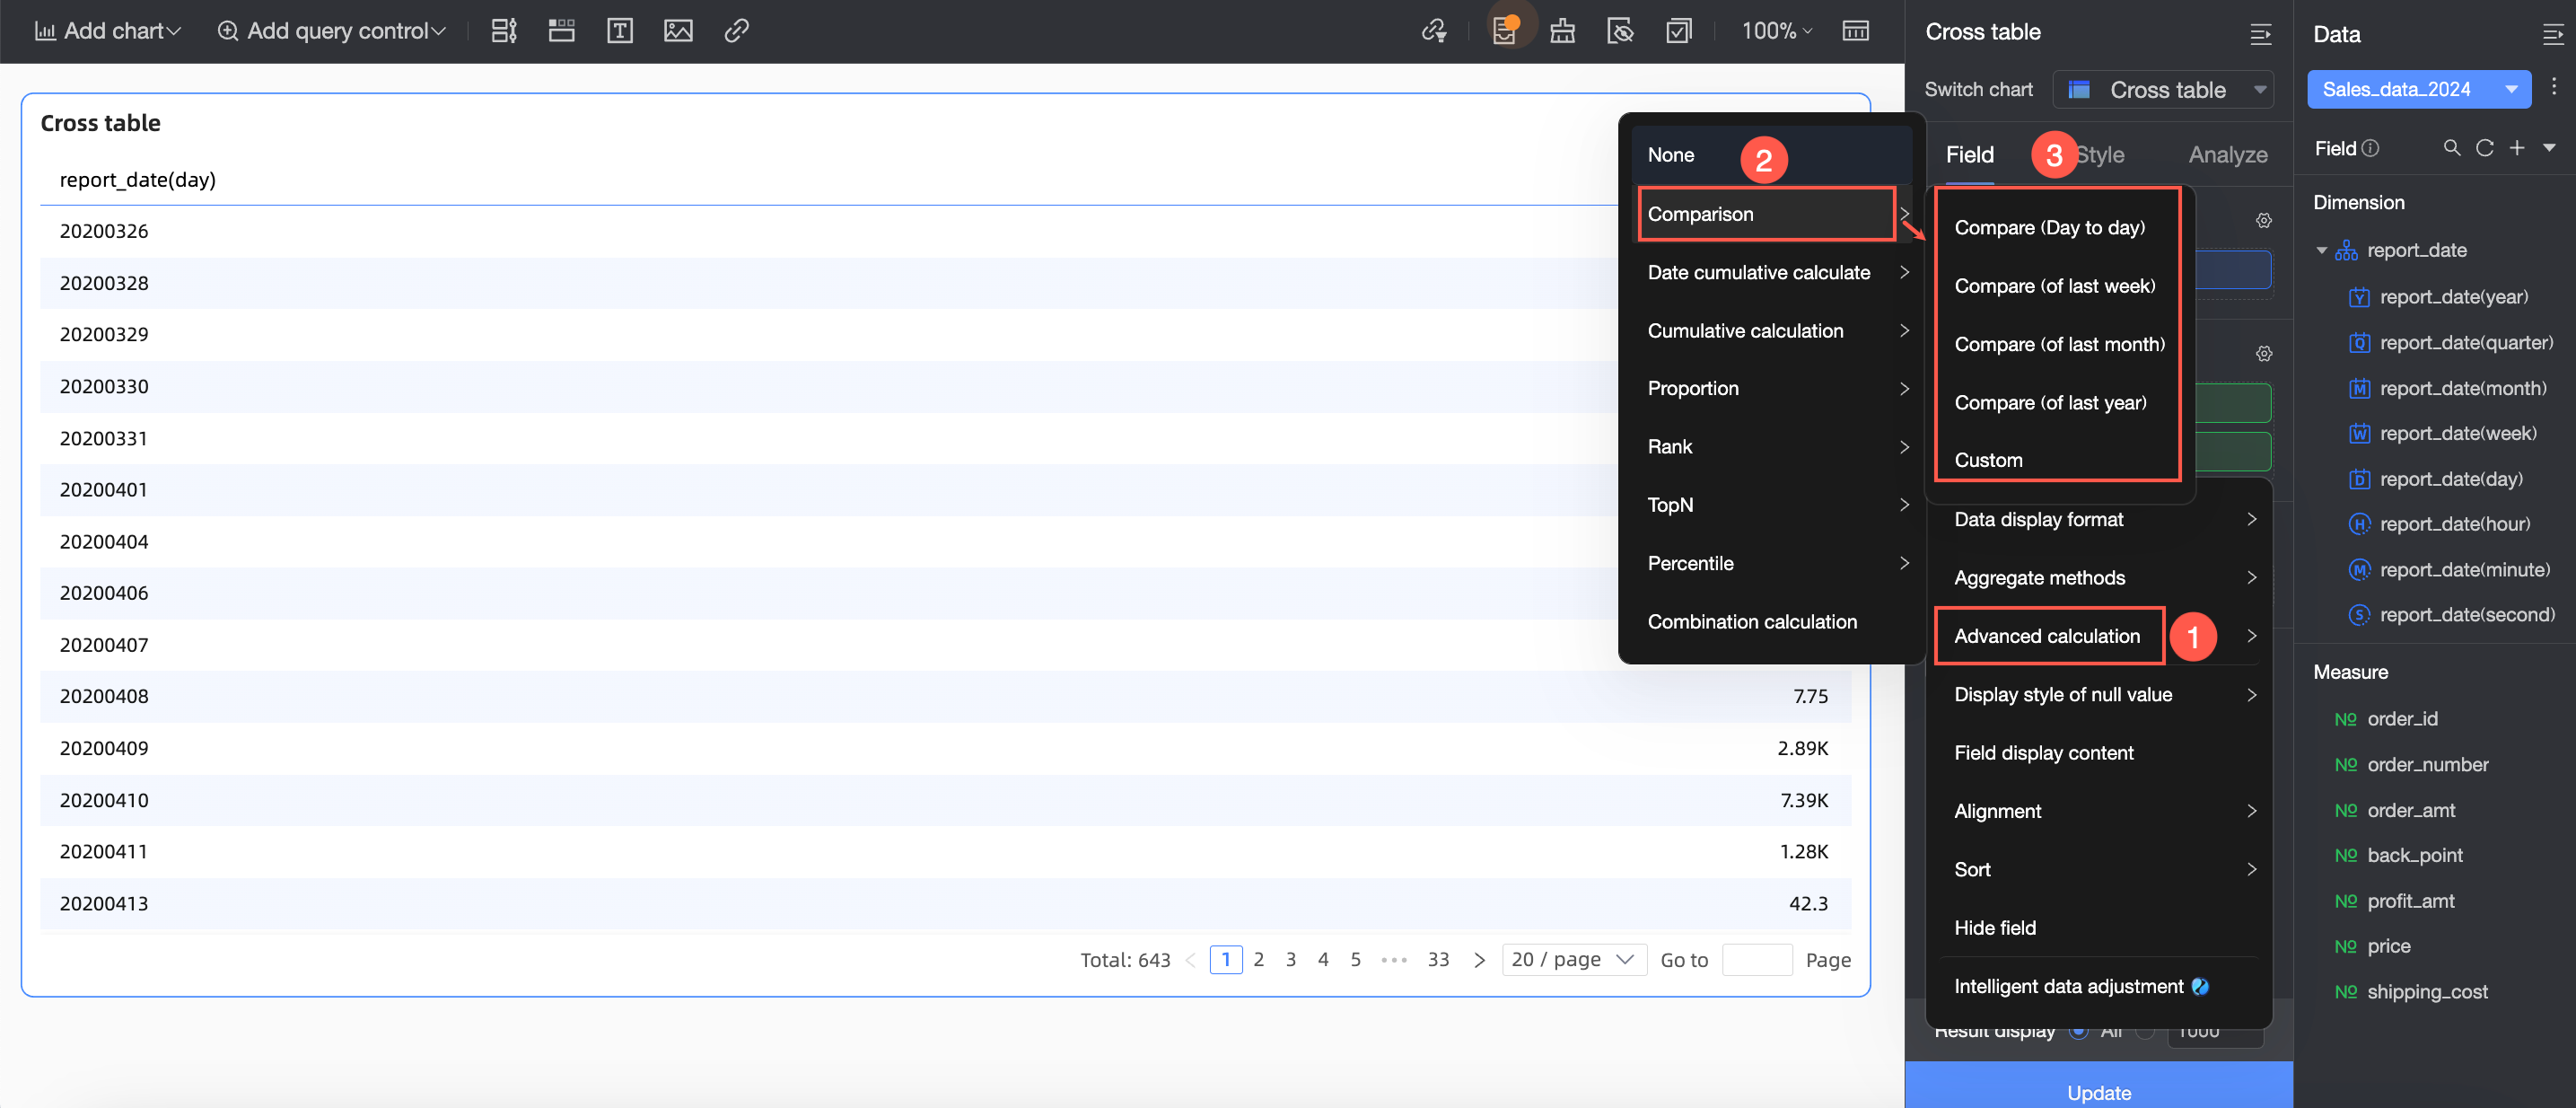
Features
Procedure
-
Hover over a measure field, click the
 icon on the right, and select Advanced Calculation -> Comparison -> Custom.
-
In the Comparison Settings window, configure the parameters.

Parameter
Description
Date Field
The Date field is the reference date field for calculating the comparison:
-
When a dimension contains multiple date fields, year-over-year and month-over-month comparisons use the date field with the finest granularity.
-
If dimensions do not contain a date field, you can select any date field from the dataset or a date placeholder configured in the dataset for the comparison date. In this case, the comparison calculation depends on the filter condition of this date field.
The date field supports the following granularities: Date (day), Date (week), Date (month), Date (quarter), and Date (year).
Comparison Type
The value of Comparison type changes based on the value of Date field. The following list provides some examples. For a complete list, see Supported comparison types for date fields.
-
Compare (Day to Day): When the date for comparison is day, it compares the current day with the previous day, such as December 5, 2024 and December 5, 2023.
-
Compare (of Last Week): When the date for comparison is day, it compares the current day with the same day of the previous week, such as December 5, 2024 (Thursday) and November 28, 2024 (last Thursday).
-
Compare (of Last Month): When the date for comparison is day, it compares the current day with the same day of the previous month, such as December 5, 2024 and November 5, 2024.
-
Compare (of Last Year): When the date for comparison is day, it compares the current day with the same day of the previous year, such as December 5, 2024 and December 5, 2023.
-
Dynamic comparison: If the chart dimensions do not include a date field, you can configure a dynamic comparison. The comparison value is calculated dynamically based on the date filter condition selected in the query control. For example, if the date filter is from January 1, 2020 to January 10, 2020, the comparison period is from December 22, 2019 to December 31, 2019.
-
Custom: Set a custom comparison date based on your business needs.
 Note
Note-
The number entered for the comparison date must be a positive integer. The default value is 1, and the maximum value is 10,000.
-
The available granularities for the comparison date depend on the granularity of the date field, as follows.
-
Daily granularity (day): day, week, month, and year.
-
Weekly granularity (week): week and year.
-
Monthly granularity (month): month and year.
-
Quarterly granularity (quarter): quarter and year.
-
Yearly granularity (year): year.
-
-
The calculation logic for the custom comparison is as follows.
-
If the chart shows a single date, that date is shifted backward.
-
If the chart shows a date range, the entire range is shifted backward.
-
For more information about the backward shift logic for custom comparison dates, see Filter period backward shift logic.
-
-
-
Advanced Settings: Only available when the date field has a day granularity. You can set the comparison date to Start of this month, End of last month, Start of this quarter, End of last quarter, Start of this year, or End of last year.

Data Settings
Data Settings supports Specific Value, Difference From, Percent Difference From, and Proportion:
-
Specific Value: displays the specific value of the previous period
-
Difference From = Current period value - Previous period value
-
Percent Difference From = (Current period value - Previous period value)/Previous period value × 100%
If the percent difference is negative, you can select one of the following calculation formulas:
-
(Current Period Data/Previous Period Data - 1) × 100%: default value
-
1 - (Current Period Data/Previous Period Data) × 100%
-
Display As -
-
-
Proportion = (Current period value/Previous period value) × 100%
Example 1:
If you select Day-over-day as the comparison type, and today's Gross Merchandise Value (GMV) is 100 while yesterday's was 80, configure the Data Settings as follows:
-
GMV compare (day to day) (value)=80
-
GMV_day_over_day (difference): 100 - 80 = 20
-
GMV day-over-day change = (100 - 80) / 80 × 100% = 25%
-
Day-over-Day GMV (Percentage) = (100 / 80) * 100% = 125%
Example 2:
If the GMV of the current day is 100, the GMV of the previous day is 120, and Comparison Type is set to Compare (Day to Day), the comparison result varies based on the value of Data Settings:
-
GMV_day-over-day (value) = 120
-
GMV day-over-day change = 100 - 120 = -20
-
GMV_Day-over-Day_Change (Percentage) = ((100 - 120) / 120) * 100 = -16.67%
-
Day-over-day GMV comparison (%) = (100 / 120) × 100% = 83.33%
Same Period Comparison (Takes effect only when the query filter is bound to day granularity)
If you configure a filter condition for the date field, the filtered data is the data of the "current period". The system pushes the period back based on the comparison configuration to get the "comparison period" and retrieves the data for that period.
For example: If the filter condition is 2022-01-02, when calculating the year-on-year comparison, the comparison period is 2021-01-02.
-
The Same period comparison option takes effect only when the filter condition is bound to the Date field with day granularity.
In this case, the comparison period is pushed forward, and the filter condition of day granularity is pushed forward according to the "Same Period Comparison" method. For example, if the filter condition is day and "Same Period Comparison" is selected, you can achieve the effect of comparing with the same period of the previous month, such as comparing 2024.04.01~2024.04.30 with 2024.03.01~2024.03.30.
NoteWhen the chart contains a date field of day granularity, Same Period Comparison is selected by default.
-
When Same Period Comparison is not selected, or when it is selected but the query filter is not of day granularity, it is Non-Same Period Comparison.
-
When both the filter condition granularity and the comparison date granularity are day, it is Non-Same Period Comparison, and the chart does not contain date fields, the comparison period is pushed forward, and it is a full month comparison, such as: 0901-0930 is pushed forward to 0801-0831.
For more information, see Day granularity - Compare (of Last Month).
For information about the logic of pushing forward the filter period, see Logic of Pushing Forward the Filter Period.
-
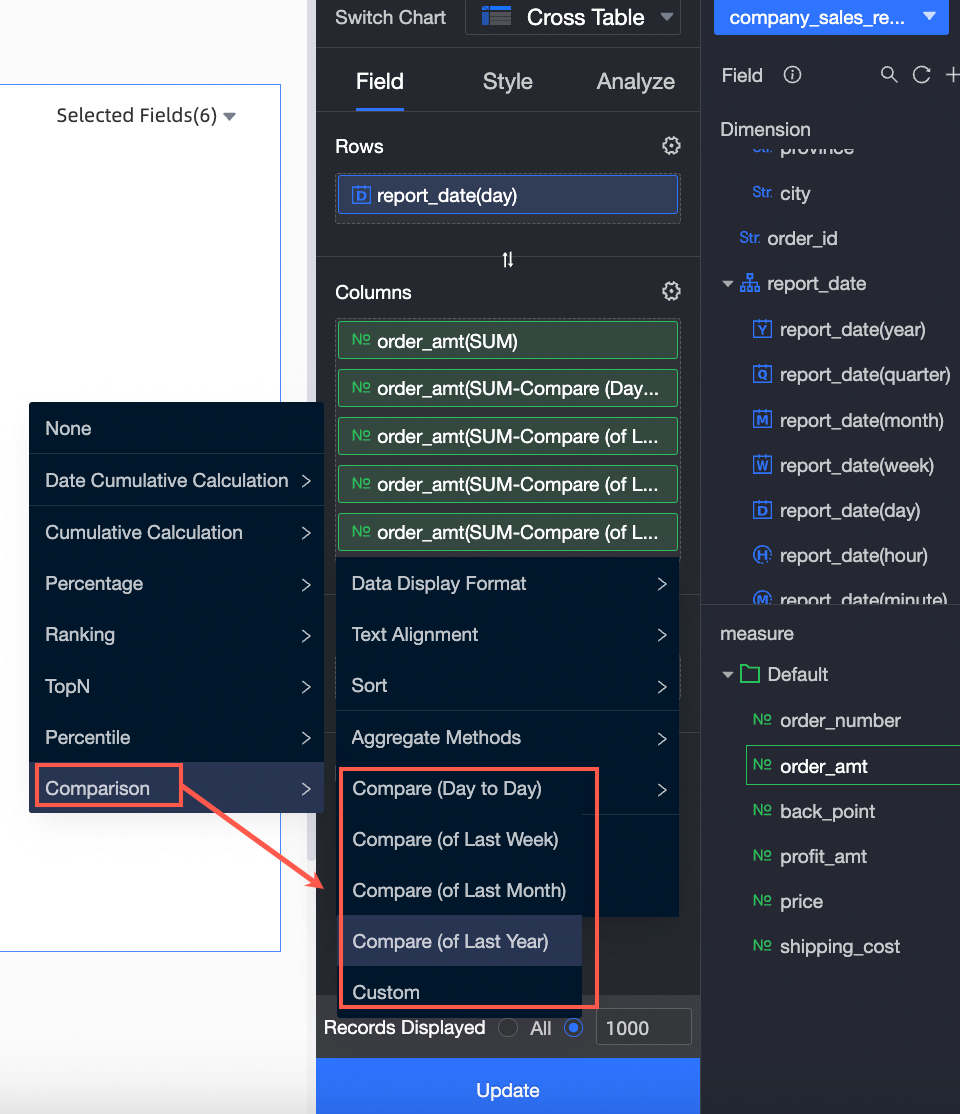
Quick Comparison
When the chart contains only one date field, quick comparison is supported. The default settings for quick comparison are "Percent Difference From" and "Same Period Comparison".
Hover over a measure field, click the ![]() icon on the right, select Advanced Calculation -> Comparison, and select the quick comparison type you need to configure.
icon on the right, select Advanced Calculation -> Comparison, and select the quick comparison type you need to configure. 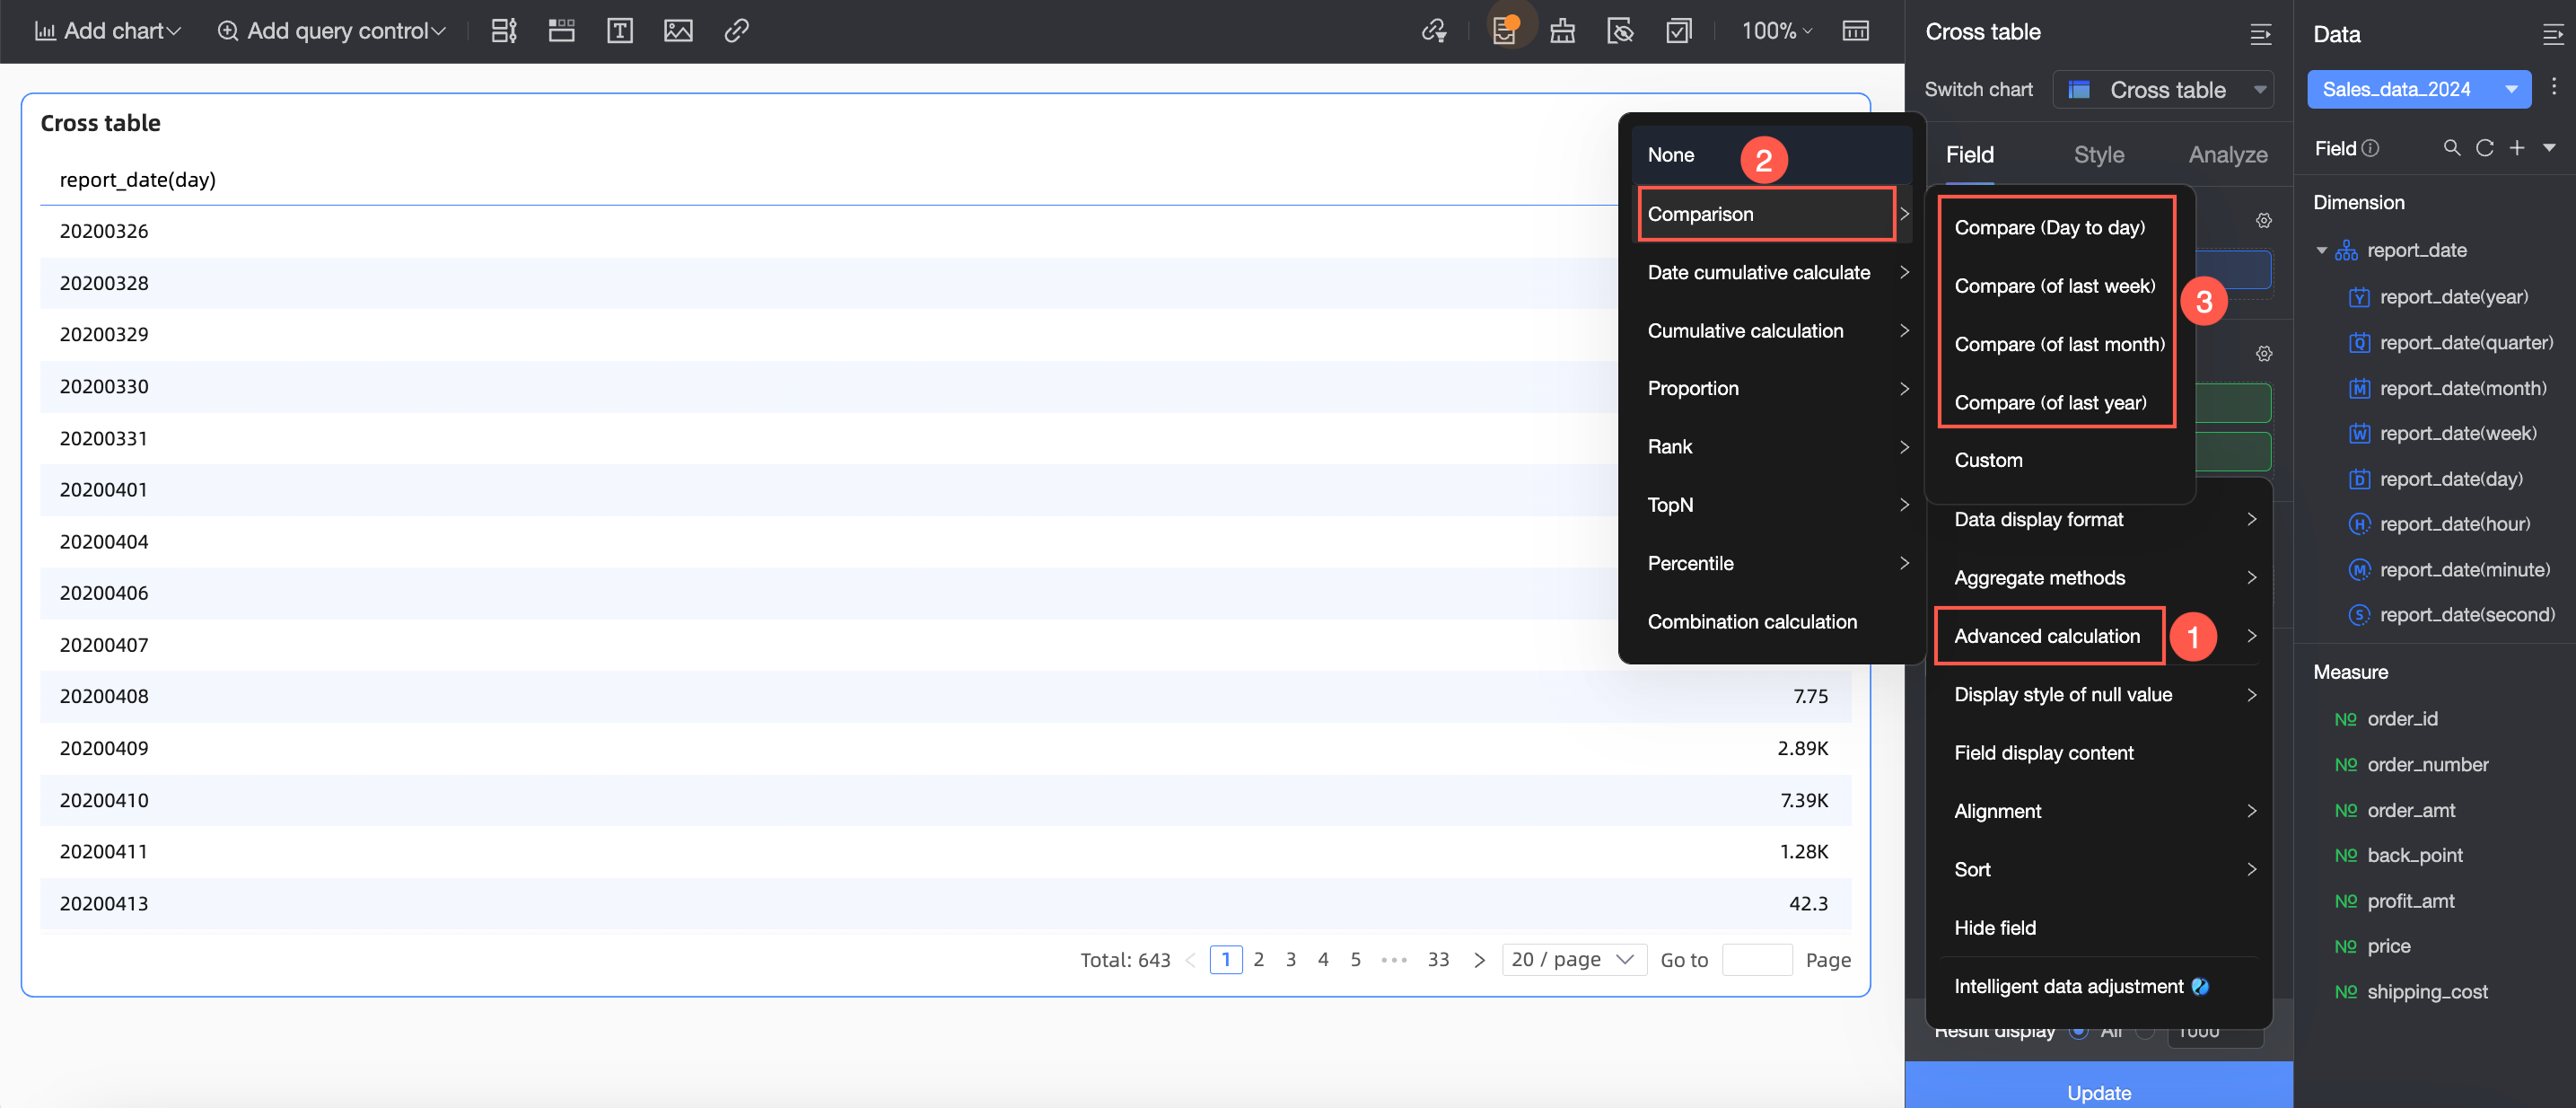
The comparison types available for quick configuration vary with the date granularity. For more information, see Supported Comparison Types for Date Fields.
Logic of Pushing Forward the Filter Period
-
When the filter condition and the comparison date granularity are different, the comparison period is not pushed forward.
-
When the filter condition and the comparison date granularity are the same, the comparison period is pushed forward by default, and it is a complete period push-forward. For example, if the filter condition is month, quarter, or year, you can achieve a full month comparison, such as comparing 2024.04.01~2024.04.30 with 2024.03.01~2024.03.31.
If the filter condition is week: It is flattened to day granularity and pushed forward.
When the filter condition granularity >= comparison granularity, it is a complete period comparison (except for week granularity). The specific comparison logic is as follows. You can verify it with Scenario 1 in Week granularity - Compare (of Last Year):
When you configure a custom comparison, the number of push-back periods changes to the number that you specify. The other calculation logic remains unchanged.
|
Comparison date granularity |
Comparison type |
Push-forward logic |
Filter condition granularity |
Current period |
Comparison period |
||
|
Year |
Compare (Year to Year) |
Push forward 1 year |
Year |
2020~2024 |
2019~2023 |
20190101~20231231 |
|
|
Quarter |
Compare (Quarter to Quarter) |
Push forward 1 quarter |
Year |
2020~2024 |
2019Q4~2024Q3 |
20191001~20240930 |
|
|
Quarter |
2020Q1~2024Q2 |
2019Q4~2024Q1 |
20191001~20240331 |
||||
|
Year-over-year |
Push forward 1 year |
Year |
2020~2024 |
2019~2023 |
20190101~20231231 |
||
|
Quarter |
2020Q1~2024Q2 |
2019Q1~2023Q2 |
20190101~20230630 |
||||
|
Month |
Compare (Month to Month) |
Push forward 1 month |
Year |
2020~2024 |
201912~202411 |
20191201~20241130 |
|
|
Quarter |
2020Q1~2024Q3 |
201912~202405 |
20191201~20240531 |
||||
|
Month |
202001~202003 |
201912~202002 |
20191201~20200229 |
||||
|
Year-over-year |
Push forward 1 year |
Year |
2020~2024 |
2019~2023 |
20190101~20231231 |
||
|
Quarter |
2020Q1~2024Q2 |
2019Q1~2023Q2 |
20190101~20230630 |
||||
|
Month |
202001~202003 |
201901~201903 |
20190101~20190331 |
||||
|
Week |
Compare (Week to Week) |
Push forward 1 week |
Year |
2020~2024 |
20191225~20241224 |
||
|
Quarter |
2020Q1~2024Q4 |
20191225~20241224 |
|||||
|
Month |
202001~202003 |
20191225~20200324 |
|||||
|
Week |
2020-11 week~2020-35 week |
2020-10 week~2020-34 week |
20200302~20200823 |
||||
|
Compare (of Last Year) |
Calculate the date from one year ago based on the current week number and day of the week |
Year |
2020~2024 |
2020-01 week Wednesday~2025-01 week Tuesday |
2019-01 week Wednesday~2024-01 week Tuesday |
20190102~20240102 |
|
|
Quarter |
2020Q1~2024Q4 |
2020-01 week Wednesday~2025-01 week Tuesday |
2019-01 week Wednesday~2024-01 week Tuesday |
20190102~20240102 |
|||
|
Month |
202001~202003 |
2020-01 week Wednesday~2020-14 week Tuesday |
2019-01 week Wednesday~2019-14 week Tuesday |
20190102~20240402 |
|||
|
Week |
2020-11 week~2020-35 week |
2019-11 week~2019-35 week |
20190311~20190901 |
||||
|
Day |
Compare (Day to Day) |
Push forward 1 day |
Year |
2020~2024 |
20191231~20241230 |
||
|
Quarter |
2020Q1~2024Q2 |
20191231~20240629 |
|||||
|
Month |
202001~202003 |
20191231~20200330 |
|||||
|
Week |
2020-11 week~2020-35 week |
20200309~20200830 |
20200308~20200829 |
||||
|
Day |
20200101~20200522 |
20191231~20200521 |
|||||
|
week on week |
Push forward 1 week |
Year |
2020~2024 |
20191225~20241224 |
|||
|
Quarter |
2020Q1~2024Q4 |
20191225~20241224 |
|||||
|
Month |
202001~202003 |
20191225~20200324 |
|||||
|
Week |
2020-11 week~2020-35 week |
2020-10 week~2020-34 week |
20200302~20200823 |
||||
|
Day |
20200101~20200522 |
20191225~20200515 |
|||||
|
Month-over-month comparison |
Push forward 1 month |
Year |
2020~2024 |
201912~202411 |
20191201~20241130 |
||
|
Quarter |
2020Q1~2024Q3 |
201912~202408 |
20191201~20240831 |
||||
|
Month |
202001~202003 |
201912~202002 |
20191201~20200229 |
||||
|
Week |
2020-11 week~2020-35 week |
20200309~20200830 |
20200209~20200730 |
||||
|
Day |
20200101~20200522 |
20191201~20200422 |
|||||
|
Compare (of Last Year) |
Push forward 1 year |
Year |
2020~2024 |
2019~2023 |
20190101~20231231 |
||
|
Quarter |
2020Q1~2024Q2 |
2019Q1~2023Q2 |
20190101~20230630 |
||||
|
Month |
202001~202003 |
201901~201903 |
20190101~20190331 |
||||
|
Week |
2020-11 week~2020-35 week |
20200309~20200830 |
20190309~20190830 |
||||
|
Day |
20200101~20200522 |
20190101~20190522 |
|||||
When the filter condition granularity < comparison granularity, it is a non-complete period comparison. The specific comparison logic is as follows. You can verify it with Scenario 2 in Week granularity - Compare (of Last Year).
When you configure a custom comparison, the number of push-back periods changes to the number that you specify. The other calculation logic remains unchanged.
|
Comparison date granularity |
Comparison type |
Push-forward logic |
Filter condition granularity |
Current period |
Comparison period |
||
|
Year |
Compare (Year to Year) |
Push forward 1 year |
Quarter |
2020Q3~2024Q2 |
2019Q3~2023Q2 |
20190701~20230630 |
|
|
Month |
202001~202002 |
201901~201902 |
20190101~20190228 |
||||
|
Week |
2020-11 week~2020-35 week |
20200309~20200830 |
20190309~20190830 |
||||
|
Day |
20200101~20200522 |
20190101~20190522 |
|||||
|
Quarter |
Compare (Quarter to Quarter) |
Push forward 1 quarter |
Month |
202002~202006 |
201911~202003 |
20191101~20200331 |
|
|
Week |
2020-11 week~2020-35 week |
20200309~20200830 |
20191209~20200530 |
||||
|
Day |
20200101~20200522 |
20191001~20200222 |
|||||
|
Year-over-year |
Push forward 1 year |
Month |
202001~202002 |
201901~201902 |
20190101~20190228 |
||
|
Week |
2020-11 week~2020-35 week |
20200309~20200830 |
20190309~20190830 |
||||
|
Day |
20200101~20200522 |
20190101~20190522 |
|||||
|
Month |
Compare (Month to Month) |
Push forward 1 month |
Week |
2020-11 week~2020-35 week |
20200309~20200830 |
20200209~20200730 |
|
|
Day |
20200101~20200522 |
20191201~20200422 |
|||||
|
Compare (of Last Year) |
Push forward 1 year |
Week |
2020-11 week~2020-35 week |
20200309~20200830 |
20190309~20190830 |
||
|
Day |
20200101~20200522 |
20190101~20190522 |
|||||
|
Week |
Compare (Week to Week) |
Push forward 1 week |
Day |
20200101~20200522 |
20191225~20200515 |
||
|
Compare (of Last Year) |
Calculates the date for the same week and day of the previous year. |
Day |
20200101~20200522 |
2020-01 week Wednesday~2020-21 week Friday |
2019-01 week Wednesday~2019-21 week Friday |
20190102~20190524 |
|
Examples
Dimensions Contain 1 Date Field
DayGranularity
If dimensions contain only one date field, set the granularity for the comparison feature to the granularity of this field.
The following example uses a cross table to configure year-over-year (YoY) and month-over-month (MoM) comparisons.
-
On the dashboard editing page, go to the Fields tab, add fields, and configure the comparison feature.
-
Add fields.
-
In the Dimensions list, find Shipping_date(day), and double-click it or drag it to the Rows section.
-
In the Measures list, find order amount, and double-click it or drag it to the Columns section.
NoteBecause you need to view the order amount and its day-to-day comparison, week-on-week comparison, month-on-month comparison, and year-on-year comparison, add 5 order amounts to the Columns section.
-
-
Hover over the order amount measure field, click the
icon on the right, and select Advanced Calculation -> Comparison -> Compare (Day to Day).Follow this operation to modify the comparison type of the order amount measure field to Compare (Day to Day), Compare (of Last Week), Compare (of Last Month), and Compare (of Last Year).
 Note
NoteWhen you configure the comparison feature, Percent Difference From is selected for Data Settings by default. You can select Custom Comparison and modify Data Settings on the Comparison Settings page.
-
Click Update.
-
-
(Optional)
Configure filters.
If you want to filter data that is generated in a specific time interval, perform this step. The following example shows how to add a filter bar and configure shipping_date(day).
-
Add a filter bar.
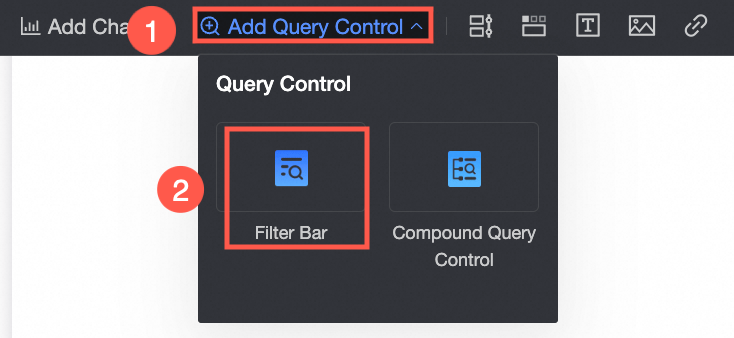
-
Select Add Regular Control.

-
Set query conditions.
 Note
NoteThe date field that you specified in the filter bar must be the same as the date field that you specified for the comparison feature.
-
-
On the dashboard editing page, click Query.
You can also modify the date range and perform a query.
Month Granularity
If dimensions contain only one date field, set the granularity for the comparison feature to the granularity of this field.
The following example uses a cross table to configure year-over-year (YoY) and month-over-month (MoM) comparisons.
-
On the dashboard editing page, go to the Fields tab, add fields, and configure the comparison feature.
-
Add fields.
-
In the Dimension list, double-click or drag Order Date (month) to the Rows area.
-
In the Measures list, find order amount, and double-click it or drag it to the Columns section.
NoteBecause you need to view the order amount and its month-to-month comparison and year-on-year comparison, add 4 order amounts to the Columns section.
-
-
Hover over the order amount measure field, click the
icon on the right, and select Advanced Calculation -> Comparison -> Compare (Month to Month).Follow this operation to modify the comparison type of the order amount measure field to Compare (Month to Month) and Compare (of Last Year).
 Note
NoteWhen you configure the comparison feature, Percent Difference From is selected for Data Settings by default. You can select Custom Comparison and modify Data Settings on the Comparison Settings page.
-
Click Update.
-
-
(Optional)
Add and configure query conditions.
 Note
NoteThe date field that you specified in the filter bar must be the same as the date field that you specified for the comparison feature.
-
On the dashboard editing page, select a time range and click Query.
In this example, data from 2024-01 to 2024-12 is filtered, and the system automatically calculates the month-to-month comparison and year-on-year comparison data.

DimensionsContain Multiple Date Fields
If dimensions contain multiple date fields, the date field with the finest granularity is used for comparison. For example, if dimensions contain date fields of day, week, month, quarter, and year granularities, only the day granularity participates in the comparison calculation.
The following example uses a cross table to configure year-over-year and period-over-period comparisons.
-
On the dashboard editing page, go to the Fields tab and add fields.
-
In the Dimension list, double-click or drag Order Date (day) and Order Date (month) to the Row area.
-
In the Measures list, find order amount, and double-click it or drag it to the Columns section.
-
-
Hover over the measure field, click the
icon on the right, and select Advanced Calculation -> Comparison -> Custom. -
On the Comparison Settings page, configure the following parameters.
-
Click OK.
-
Add and configure query conditions.
-
On the dashboard editing page, select a query range and click Query.
Dimensions do not Contain Date Fields
Hour-minute-second granularity - compare (day to day)
Hour-minute-second granularity participates in the comparison calculation.
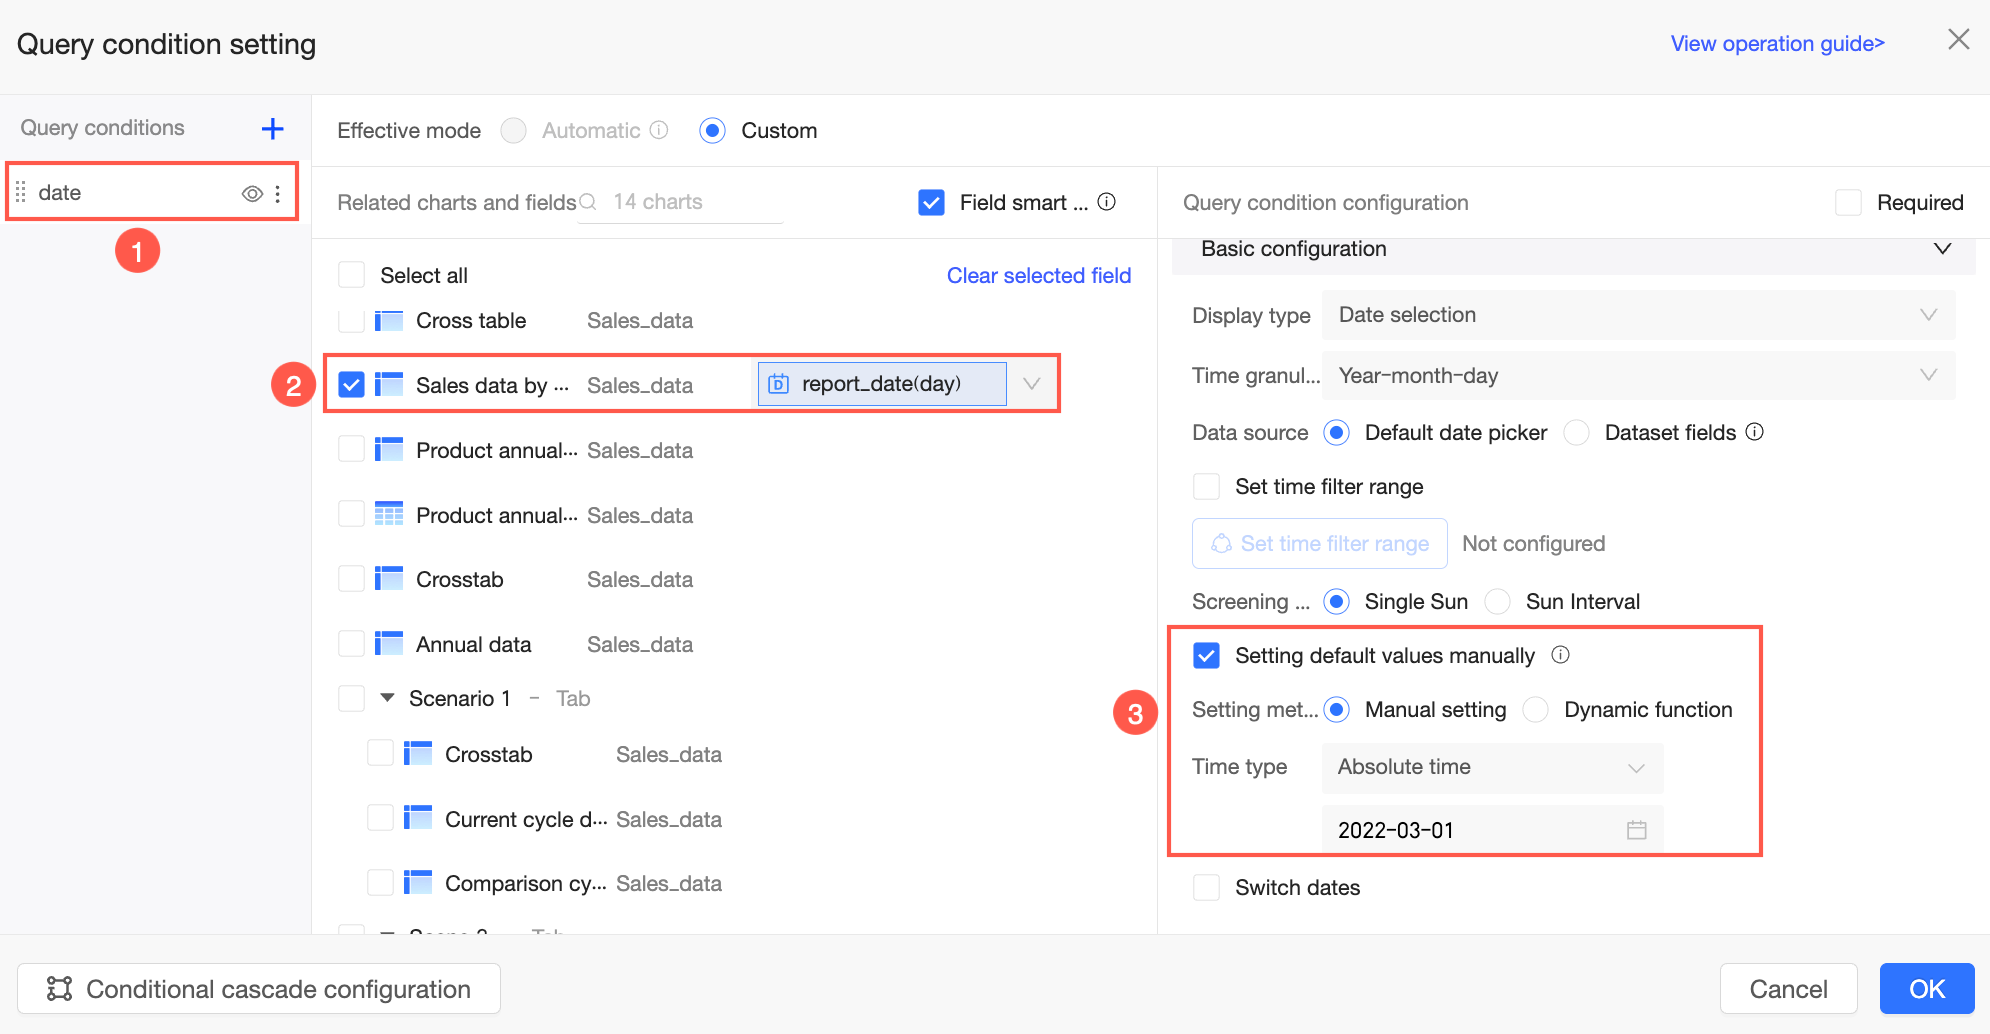
The hour-minute-second granularity contains only time information, not date information, so you cannot directly configure comparisons for it. Instead, configure a day-to-day comparison at the day granularity to compare data with the same time point of the previous day. The following example uses a cross table to configure comparisons for the hour-minute-second granularity.
-
On the dashboard editing page, go to the Fields tab and add fields.
-
In the Dimensions list, find Date(minute), and double-click it or drag it to the Rows section.
-
In the Measures list, find order amount, and double-click it or drag it to the Columns section.
-
-
Hover over the measure field, click the
icon on the right, and select Advanced Calculation -> Comparison -> Custom. -
On the Comparison Settings page, configure the following parameters.

-
Click OK.
-
Add and configure query conditions.
-
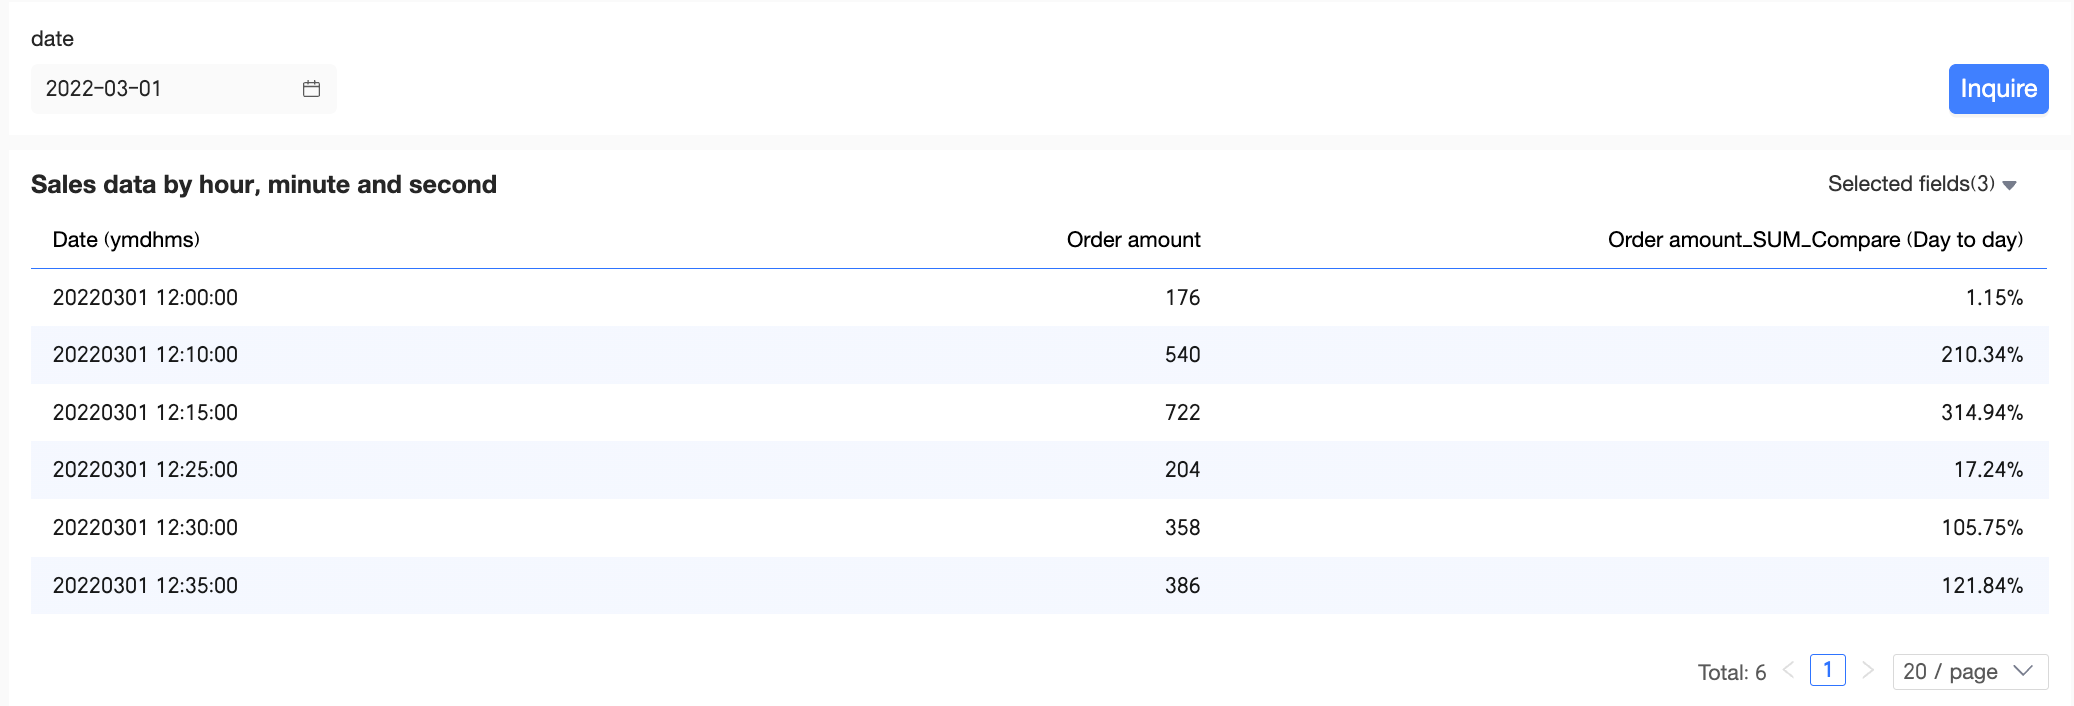
On the dashboard editing page, select a query range and click Query.
Day Granularity - compare (day to day)
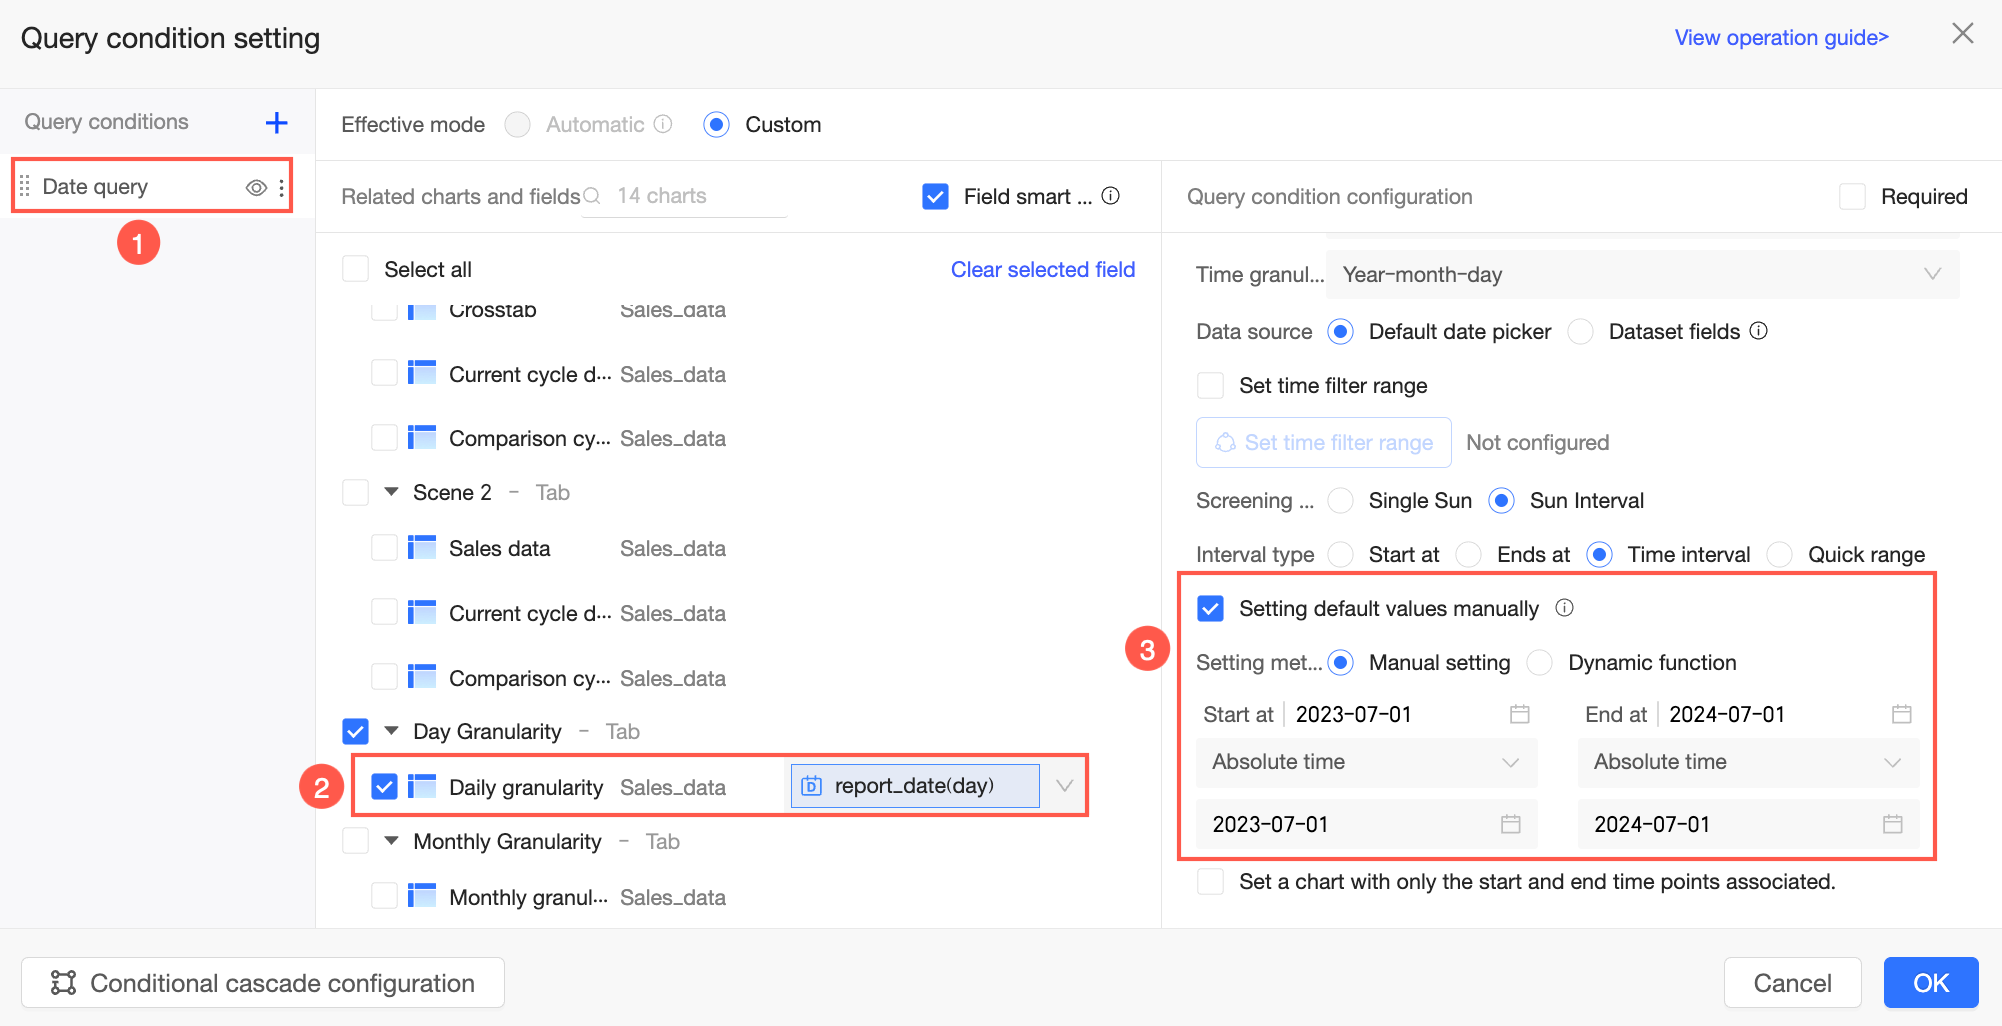
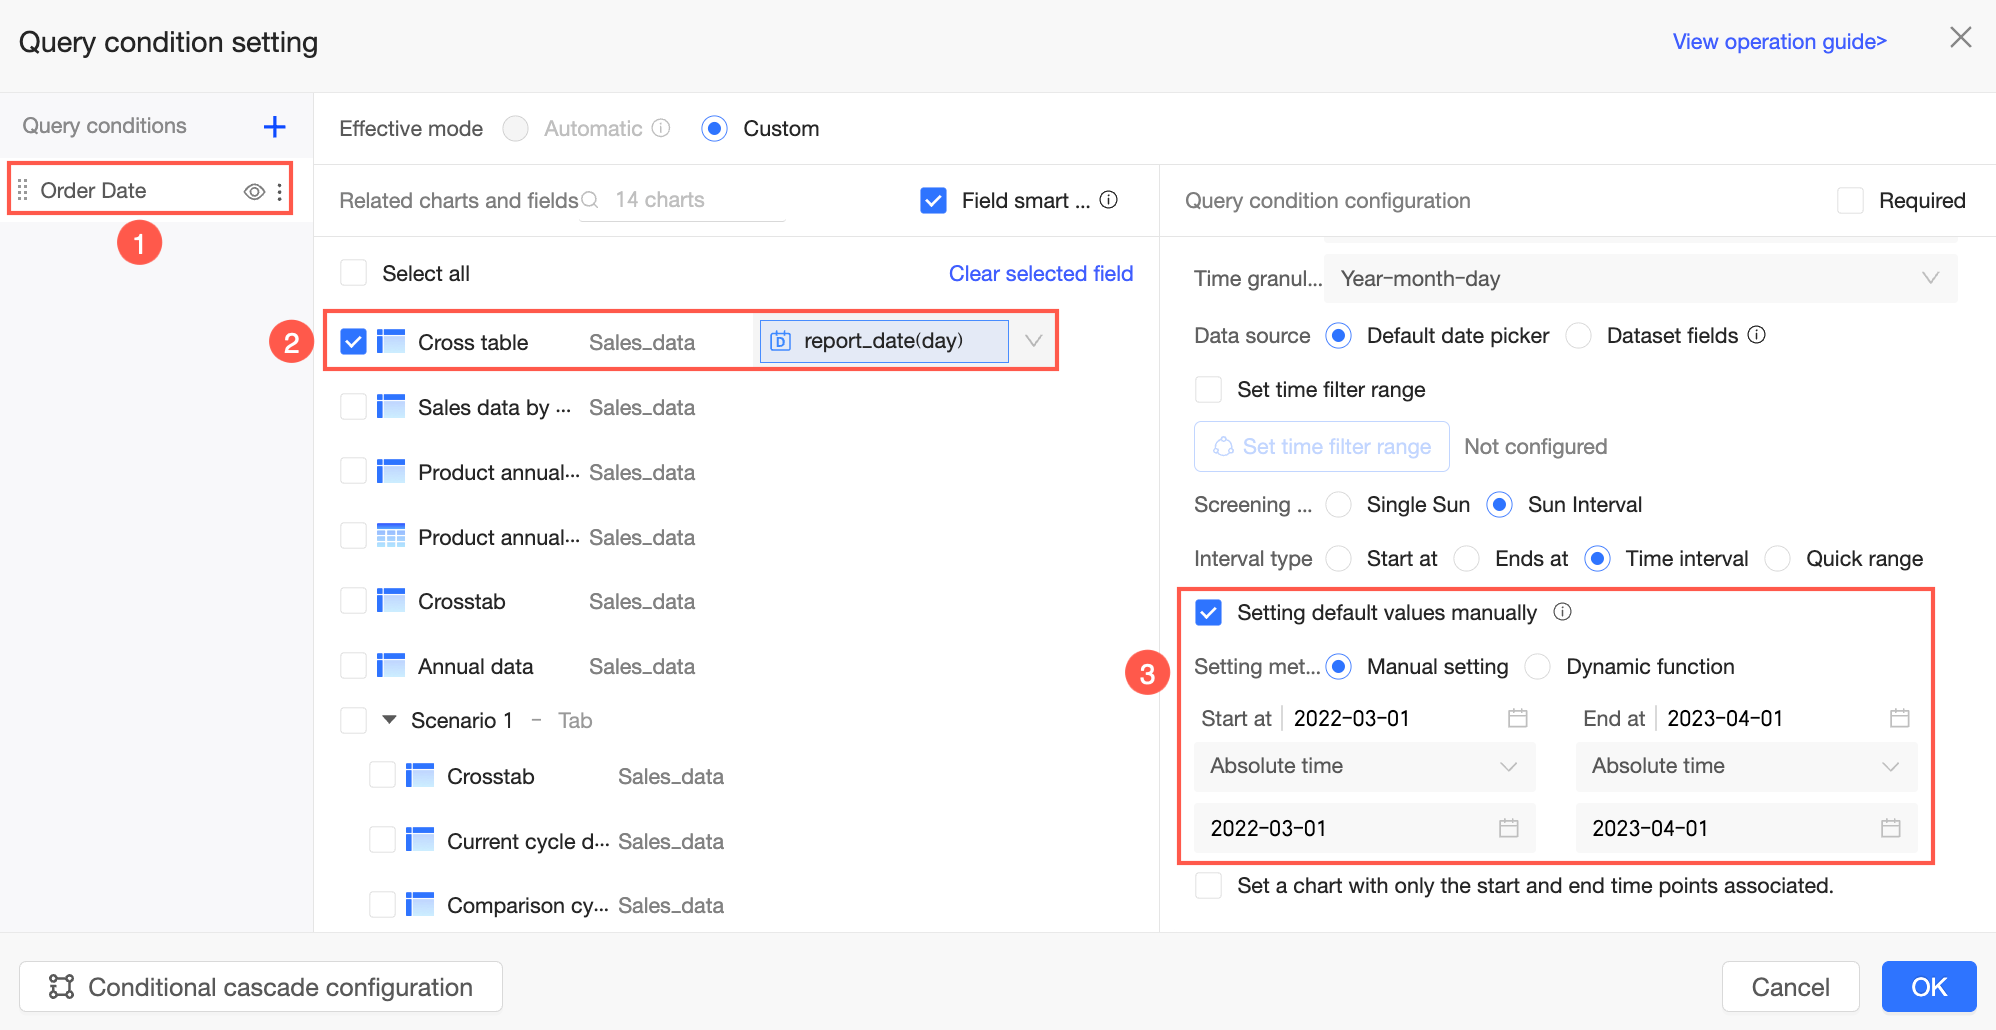
If dimensions do not contain date fields, select a date field in the associated filter bar and choose a date field of the same granularity on the Comparison Settings page.
The following example uses a cross table to configure year-over-year and period-over-period comparisons.
-
On the dashboard editing page, go to the Fields tab, add fields, and configure the comparison feature.
-
Add fields.
-
In the Dimensions list, find Region, and double-click it or drag it to the Rows section.
-
In the Measures list, find order amount, and double-click it or drag it to the Columns section.
-
-
Hover over the order amount measure field, click the
icon on the right, and select Advanced Calculation -> Comparison -> Custom. -
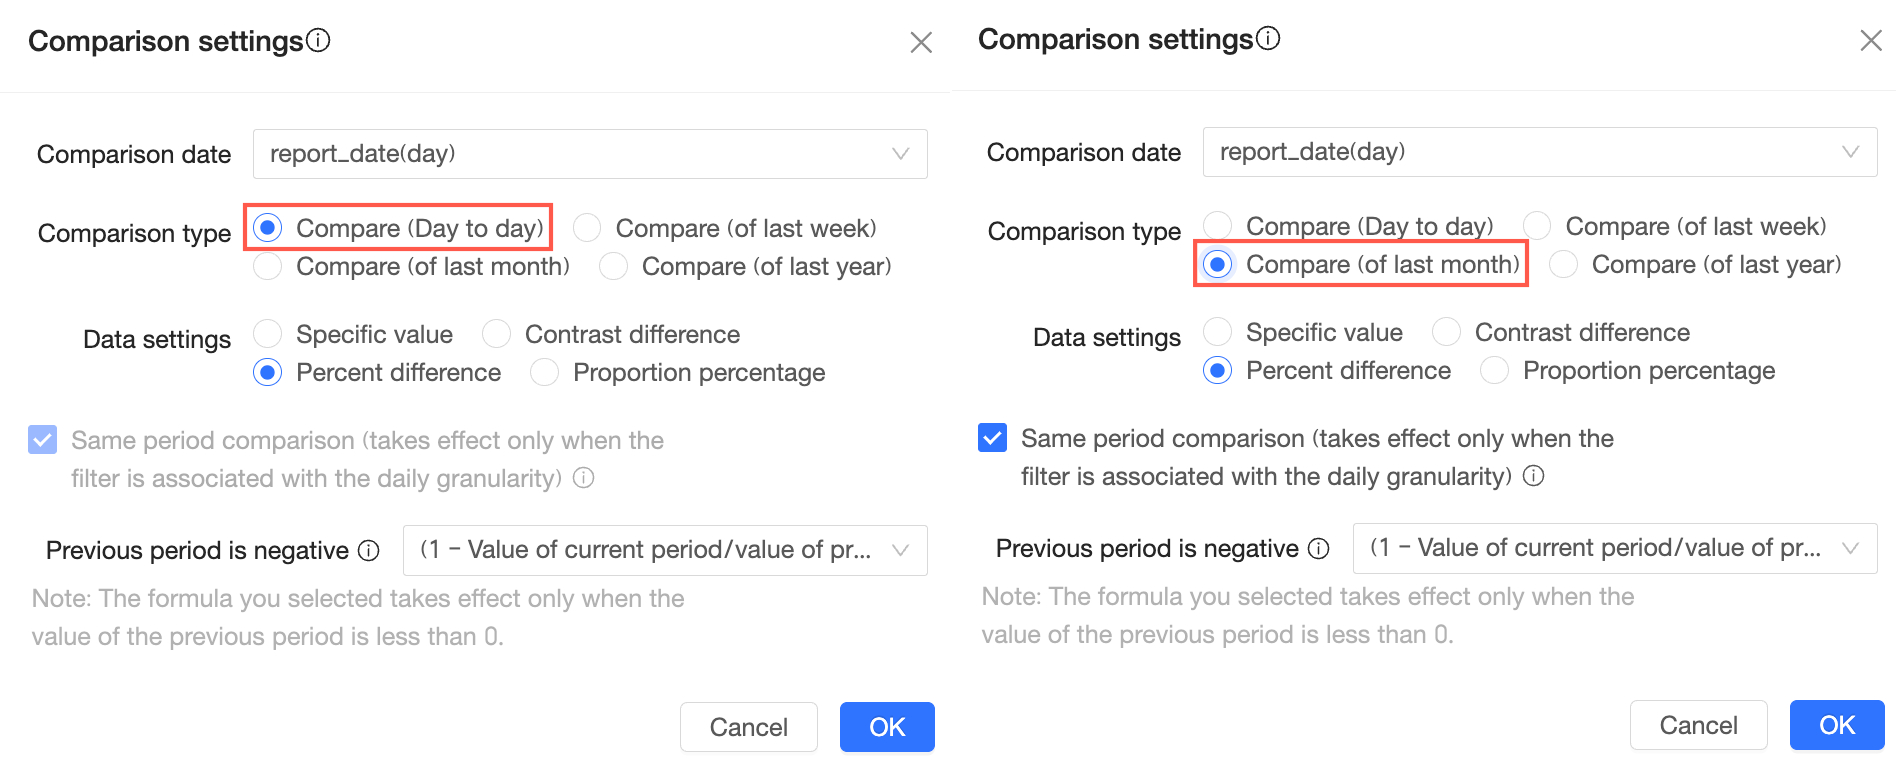
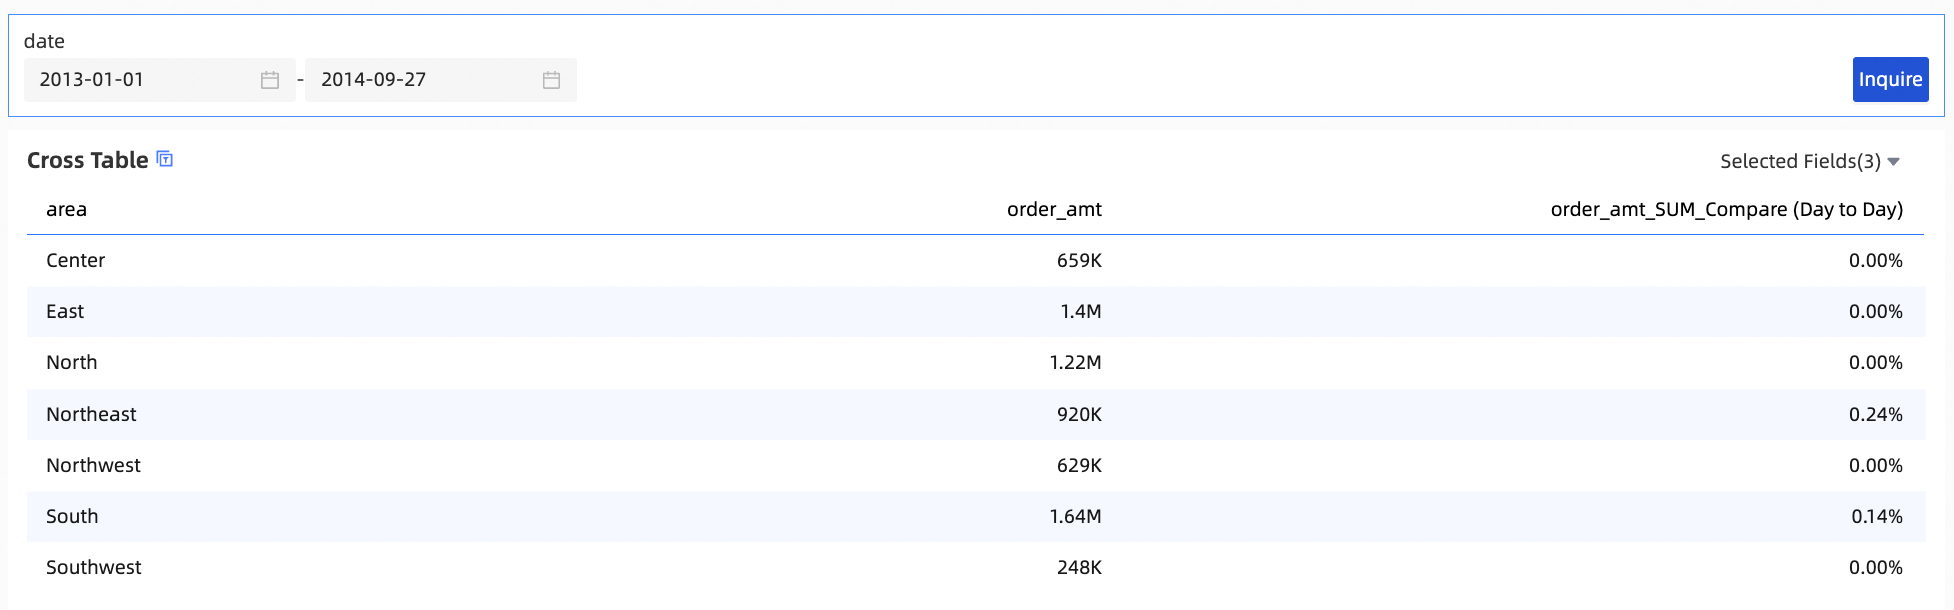
In the Comparison Settings window, configure the date field, comparison type, and data settings.
In this example, Date for Comparison is set to order date (day), Comparison Type is set to Compare (Day To Day), and Data Settings is set to Percent Difference From.
 Note
NoteWhen you configure the comparison feature, Percent Difference From is selected for Data Settings by default.
-
Click OK.
-
-
Add and configure query conditions.
 Note
NoteThe date field that you specified in the filter bar must be the same as the date field that you specified for the comparison feature.
-
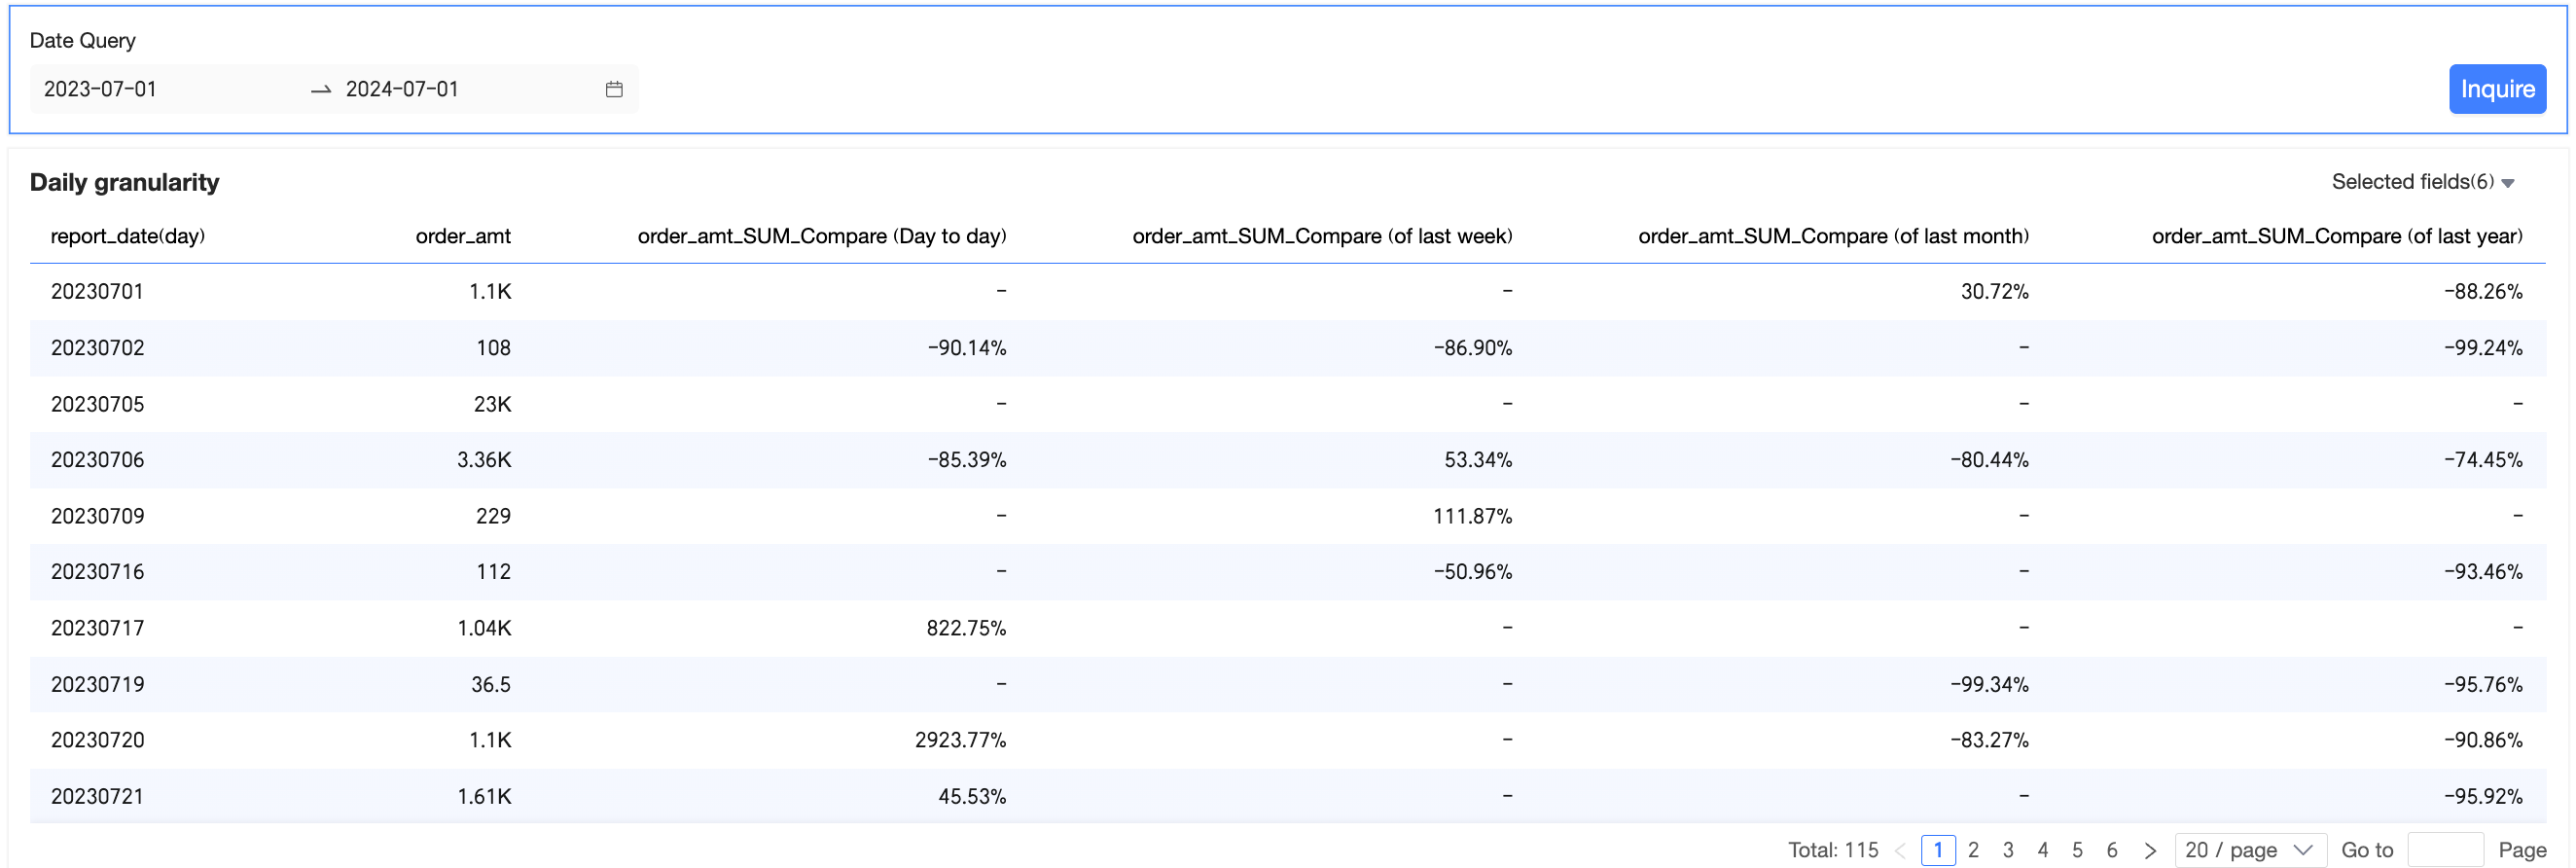
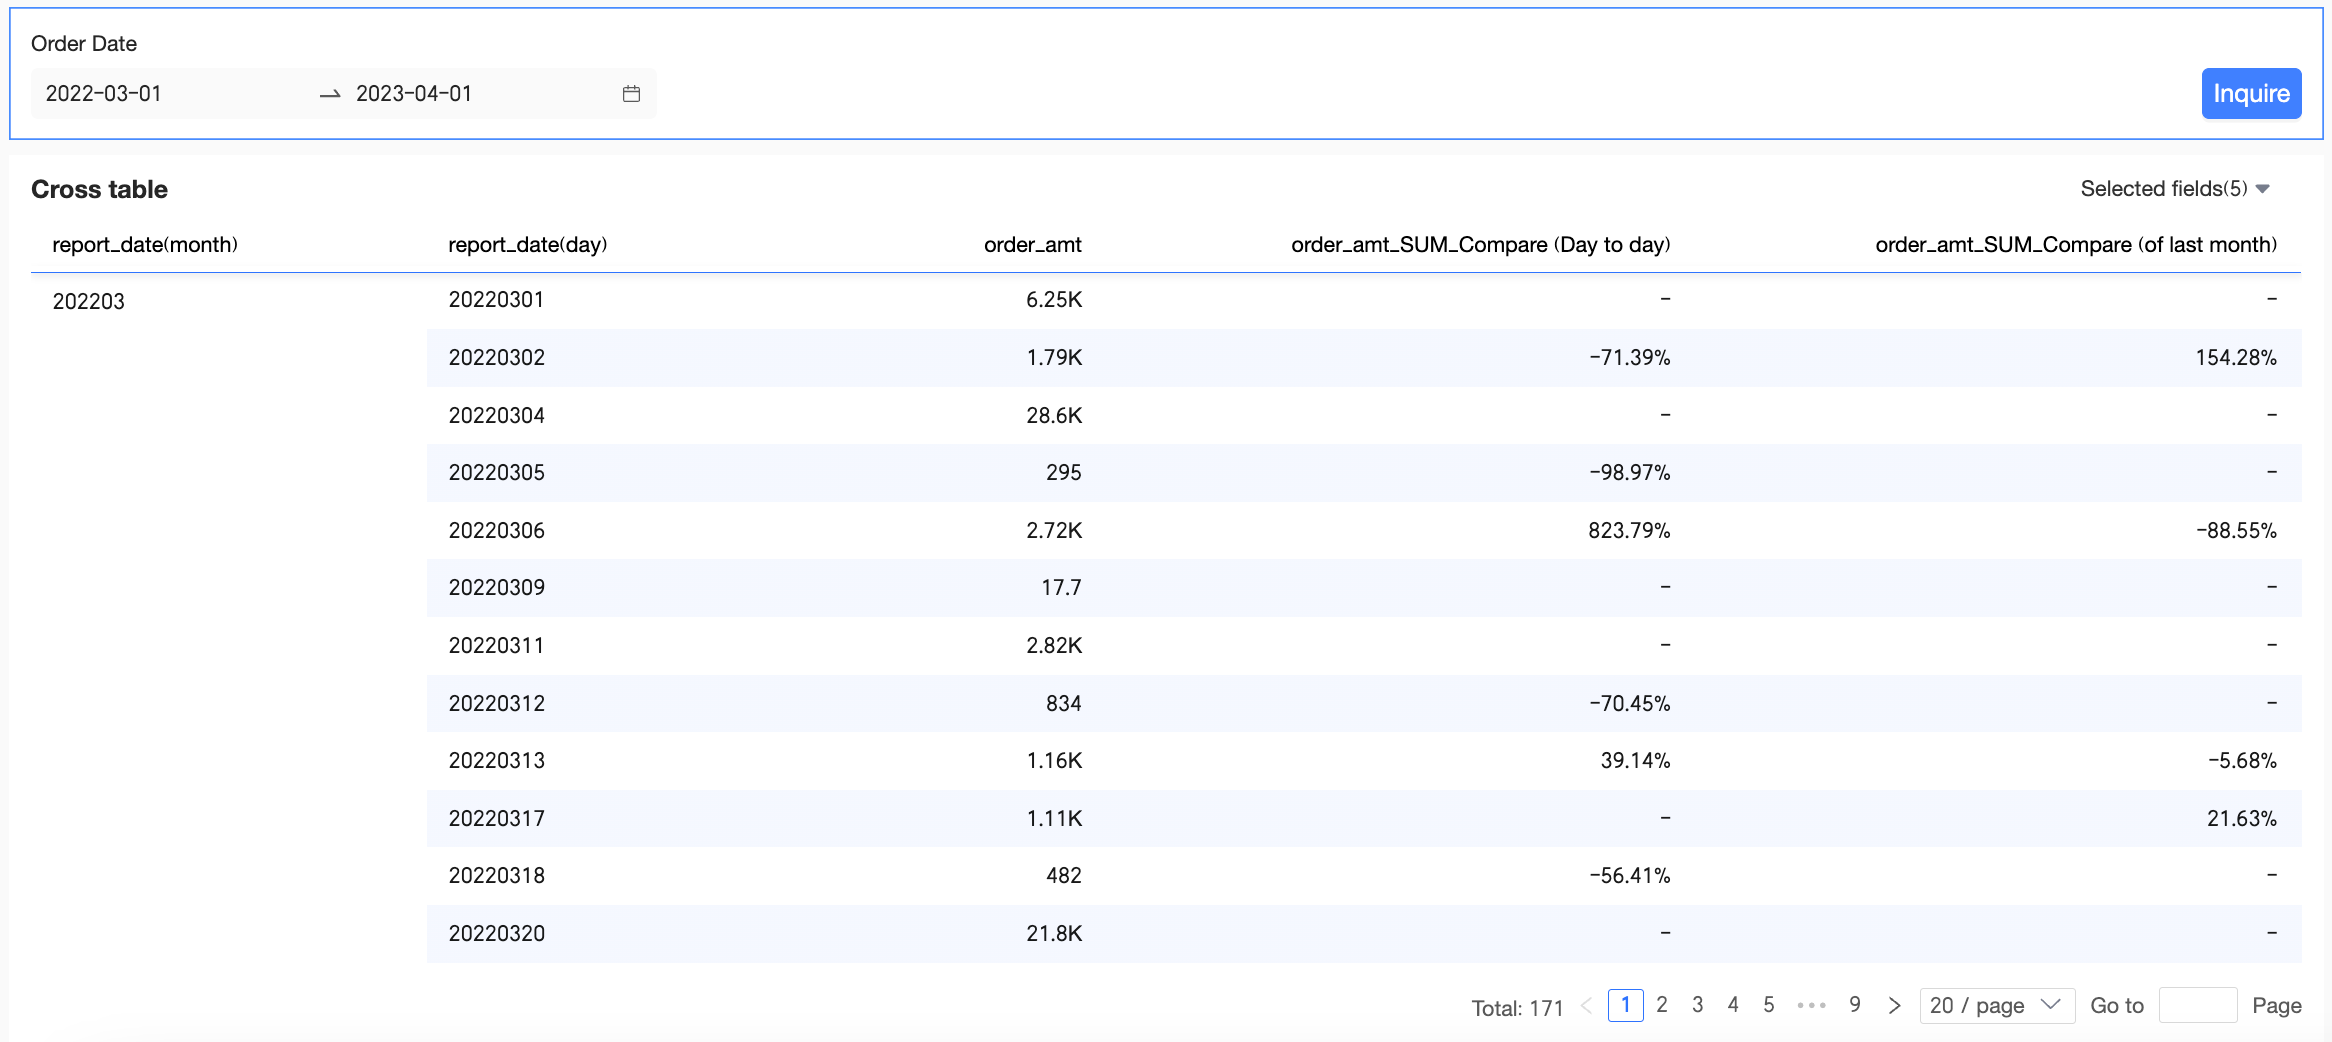
On the dashboard editing page, click Query.
You can also modify the date range and perform a query.
Day Granularity - compare (of last month)
If dimensions do not contain date fields, select a date field in the associated filter bar and choose a date field of the same granularity on the Comparison Settings page.
The following example uses a cross table to configure year-over-year and month-over-month comparisons.
-
On the dashboard editing page, go to the Fields tab, add fields, and configure the comparison feature.
-
Add fields.
-
In the Dimensions list, find Region, and double-click it or drag it to the Rows section.
-
In the Measures list, find order amount, and double-click it or drag it to the Columns section.
-
-
Hover over the order amount measure field, click the
icon on the right, and select Advanced Calculation -> Comparison -> Custom. -
In the Comparison Settings window, configure the date field, comparison type, and data settings.
In this example, set Date for Comparison to shipping_date(day), Comparison Type to Compare (with Same Day Last Month), and Data Settings to Percentage Difference. Ensure that Same Period Comparison is not selected.
 Note
Note-
When you configure the comparison feature, Percent Difference From is selected for Data Settings by default.
-
When calculating Compare (of Last Month) and the number of days in the months is different (for example, February has 28 days and January has 31 days), if Same Period Comparison is selected, the data from February 1, 2023 to February 28, 2023 is compared with the data from January 1, 2023 to January 28, 2023. If Same Period Comparison is not selected, the data from February 1, 2023 to February 28, 2023 is compared with the data from January 1, 2023 to January 31, 2023.
-
-
Click OK.
-
-
Add and configure query conditions.
 Note
NoteThe date field that you specified in the filter bar must be the same as the date field that you specified for the comparison feature.
-
On the dashboard editing page, click Query.
You can also modify the date range and perform a query.
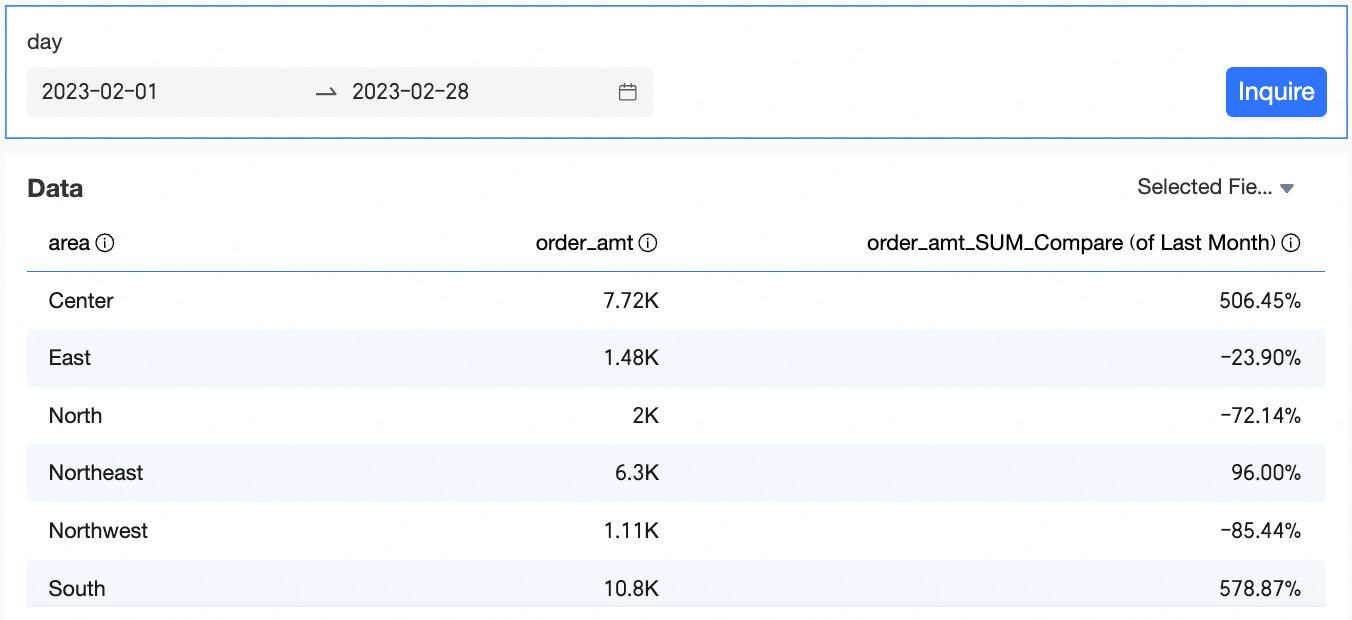
In this case, because Same Period Comparison is not selected and dimensions do not contain date fields, if the date query condition is a full month, the month-on-month comparison compares data with the full month of the previous month, that is, the data from February 1 to February 28 is compared with the data from January 1 to January 31.
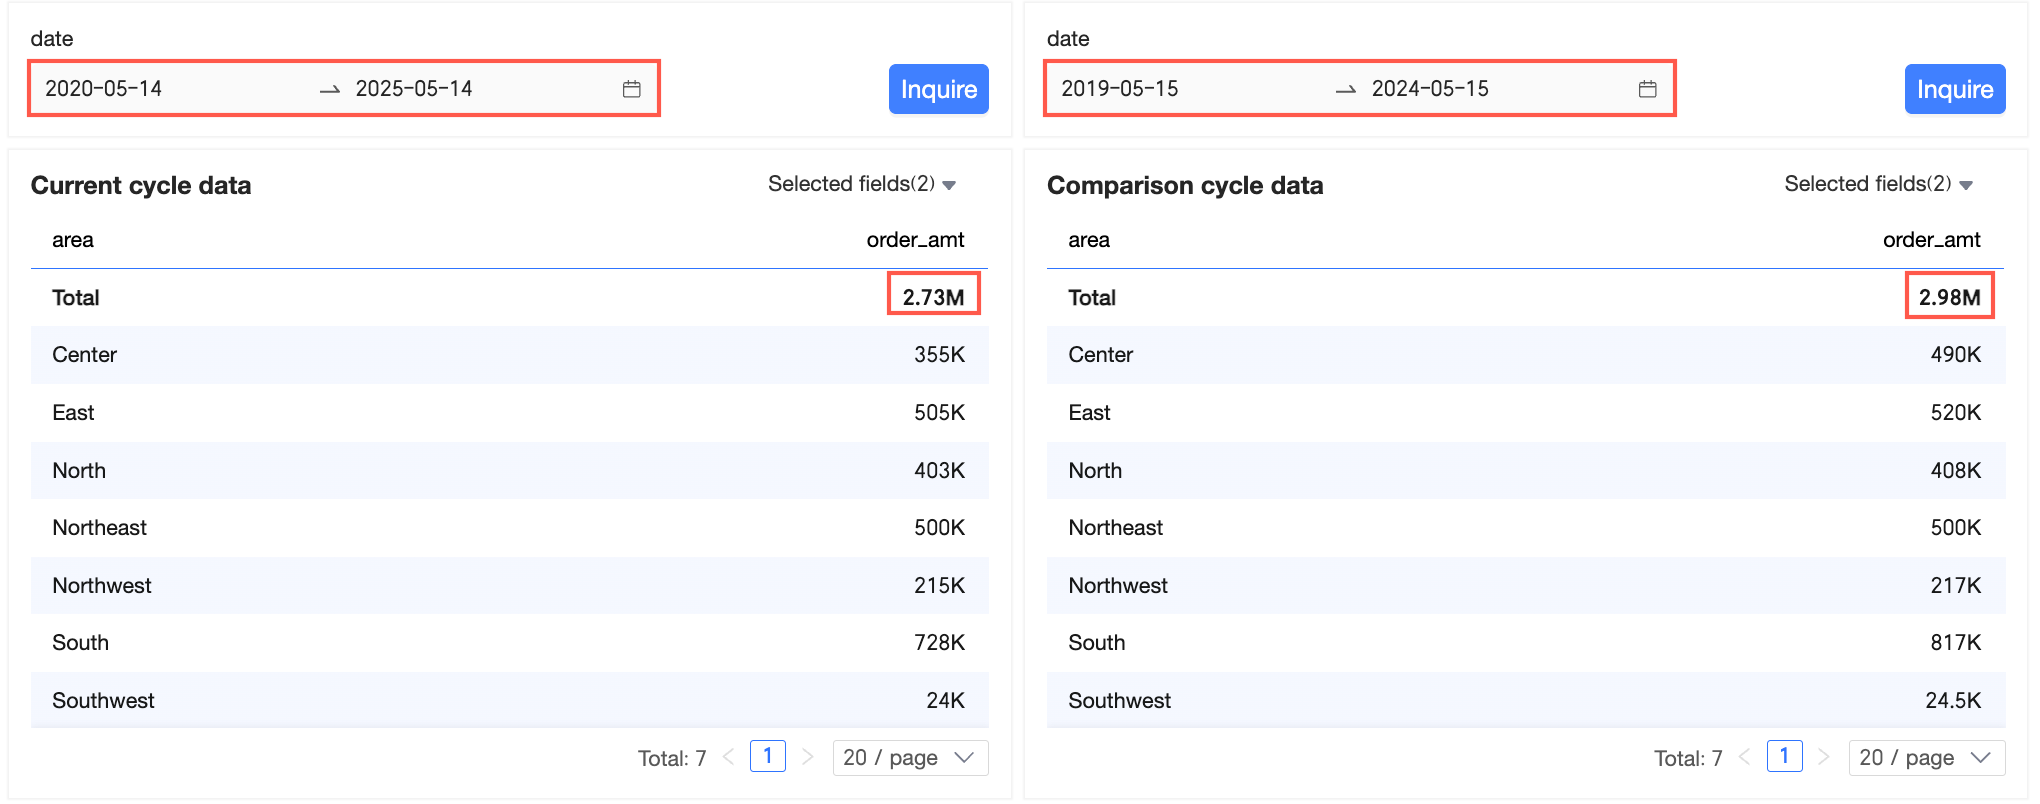
Year Granularity - compare (year to year)
If dimensions do not contain date fields, select a date field in the associated filter bar and choose a date field of the same granularity on the Comparison Settings page.
The following example uses a cross table to configure period-over-period and year-over-year comparisons.
-
On the dashboard editing page, go to the Fields tab, add fields, and configure the comparison feature.
-
Add fields.
-
In the Dimensions list, find Region, and double-click it or drag it to the Rows section.
-
In the Measures list, find order amount, and double-click it or drag it to the Columns section.
-
-
Hover over the order amount measure field, click the
icon on the right, and select Advanced Calculation -> Comparison -> Custom. -
On the Comparison Settings page, configure Date for Comparison, Comparison Type, and Data Settings.
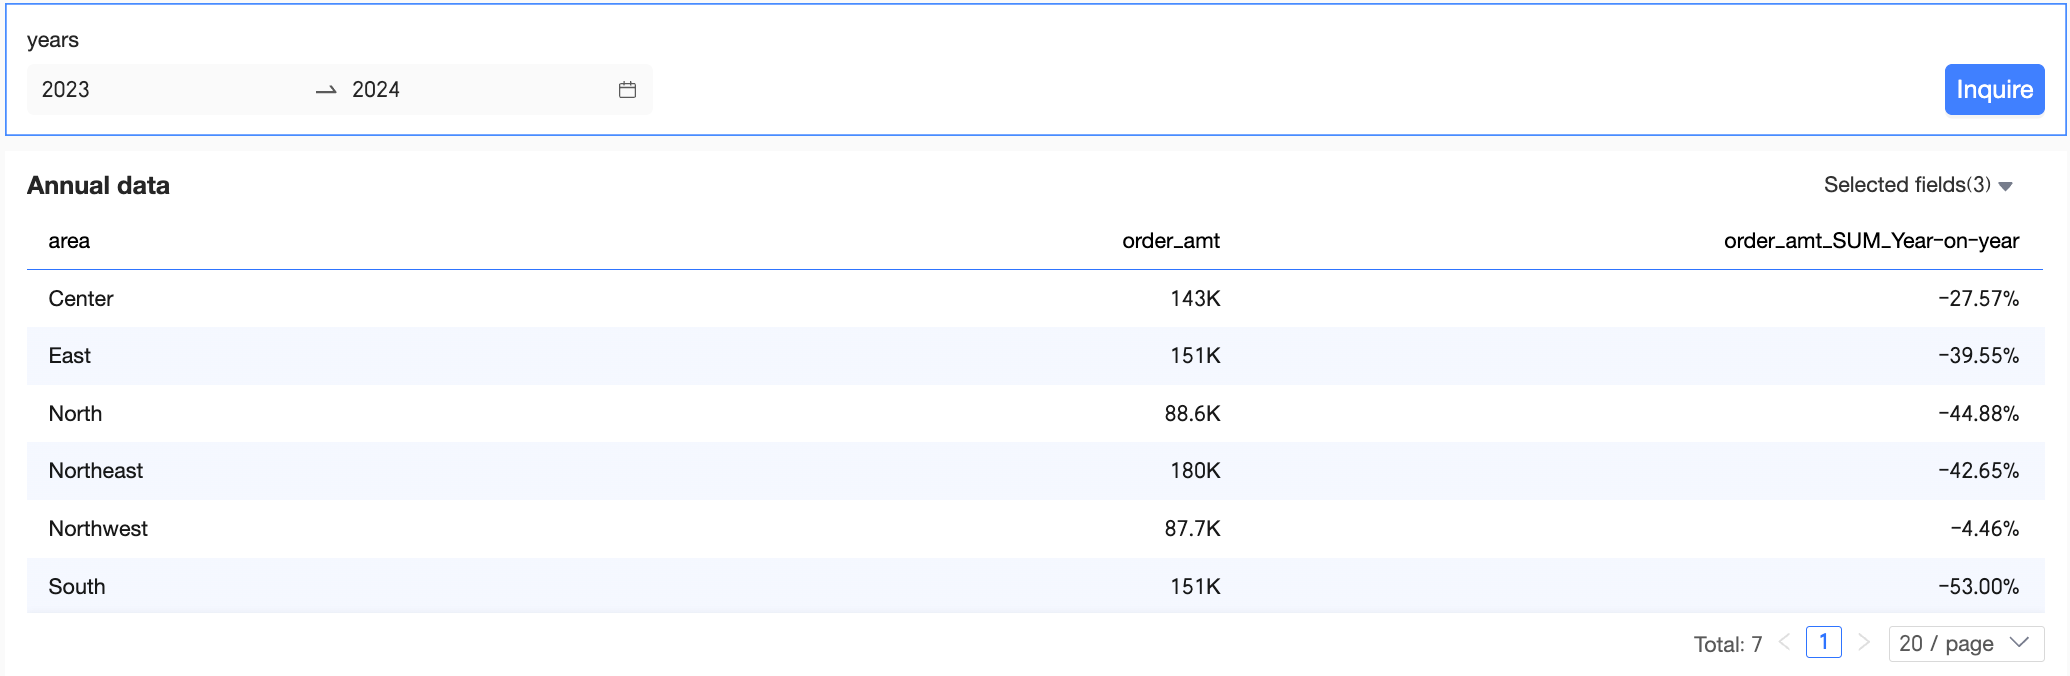
In this example, shipping_date(year) is selected for Date for Comparison, Compare (Year To Year) for Comparison Type, and Difference From for Data Settings.
 Note
NoteData Settings supports Specific Value, Difference From, Percent Difference From, and Proportion.
-
Click OK.
-
-
Add and configure query conditions.
The following example shows how to add a filter bar and configure shipping_date(year).
Set query conditions.
 Note
NoteThe date field that you specified in the filter bar must be the same as the date field that you specified for the comparison feature.
-
On the dashboard editing page, select a query range and click Query.
You can also modify the date range and perform a query.
Week Granularity - compare (of last year)
The following examples illustrate the filter period push-forward logic in typical scenarios.
Scenario 1
|
Comparison date granularity |
Comparison type |
Push-forward logic |
Filter condition granularity |
Current period |
Comparison period |
||
|
Week |
Compare (of Last Year) |
Goes back one year based on the current week number and day of the week. |
Year |
2020~2024 |
2020-01 week Wednesday~2025-01 week Tuesday |
2019-01 week Wednesday~2024-01 week Tuesday |
20190102~20240102 |
Take a cross table as an example.
-
On the dashboard editing page, go to the Fields tab, add fields, and configure the comparison feature.
-
Add fields.
-
In the Dimensions list, find Region, and double-click it or drag it to the Rows section.
-
In the Measures list, find order amount, and double-click it or drag it to the Columns section.
NoteTo easily view the order amount and year-on-year comparison of the current period and the comparison period, you can add 3 order amounts to the Columns section.
-
-
Hover over the order amount measure field, click the
icon on the right, and select Advanced Calculation -> Comparison -> Custom. -
In the Comparison Settings window, configure the date field, comparison type, and data settings.
In this example, the Comparison Date is shipping_date(week), the Comparison Type is Year-over-year, the Data Settings are Specific Value and Percentage Difference, and Same Period Comparison is selected.

-
Click OK.
-
-
Configure filters.
The following example shows how to add a filter bar and configure shipping_date(day).
-
You can add a query control.
-
Select Advanced Configuration.

-
Set query conditions.

-
-
On the dashboard editing page, click Query.
You can also modify the date range and perform a query.
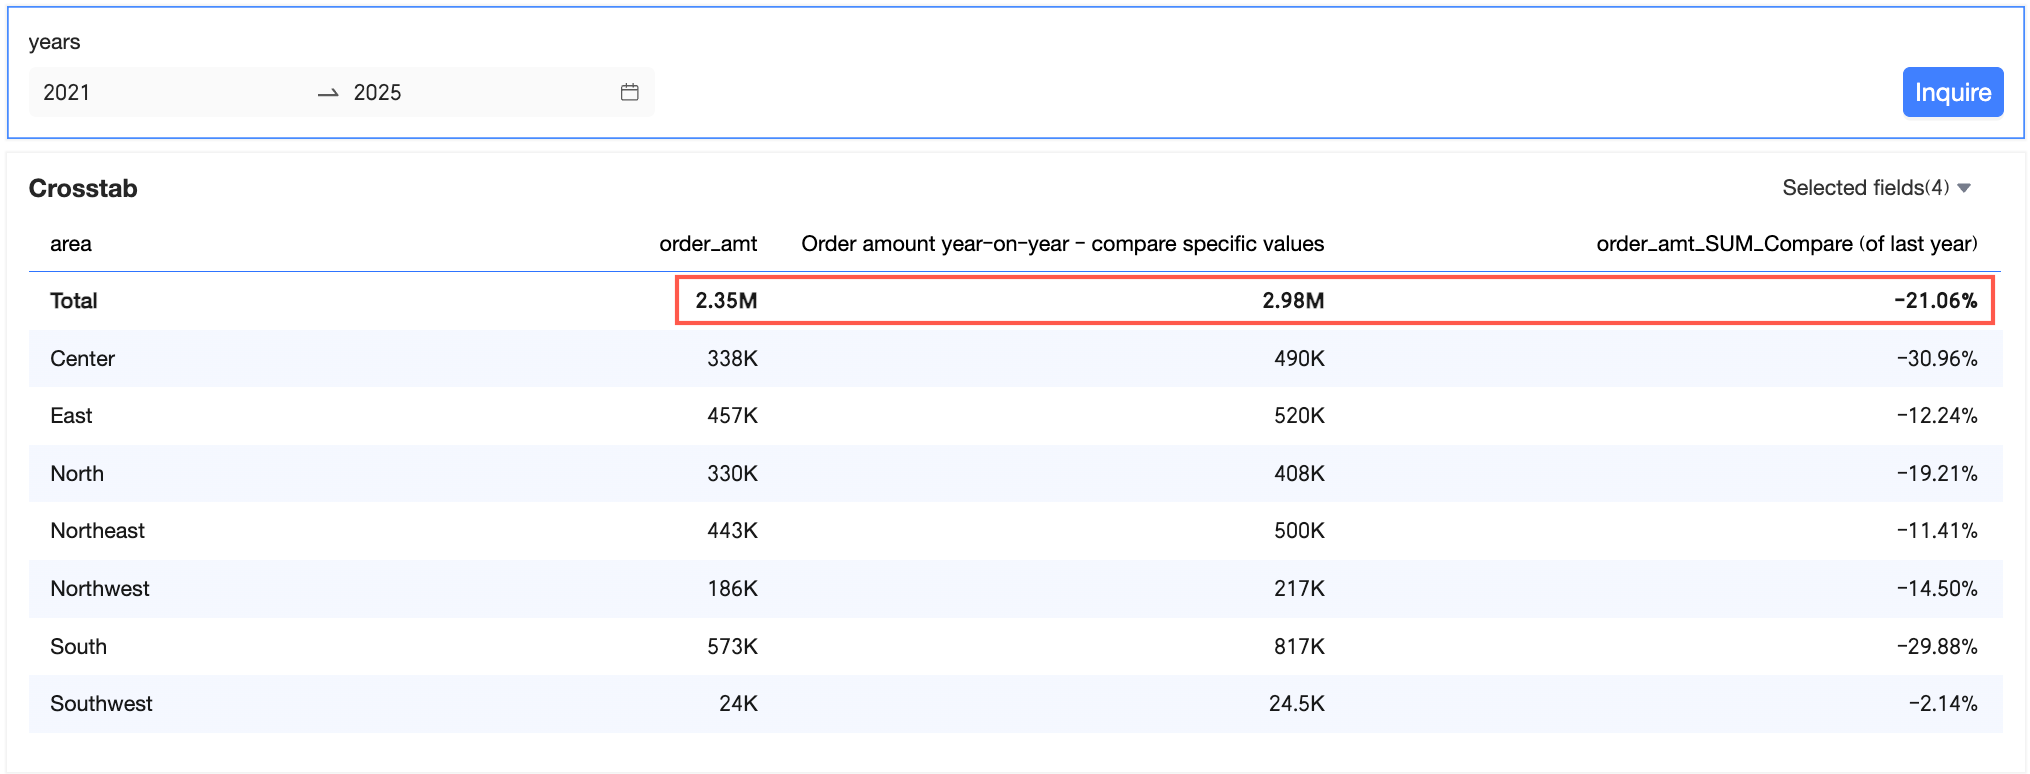
Now, we can see that the current period is from 2020 to 2024, that is, from 2020-01 week Wednesday (January 1, 2020) to 2025-01 week Tuesday (December 31, 2024), and the total order amount is 18.31 million. The comparison period is from 2019-01 week Wednesday (January 2, 2019) to 2024-01 week Tuesday (January 2, 2024), and the order amount is 17.82 million. The year-on-year comparison is 2.75%.
Scenario 2
|
Comparison date granularity |
Comparison type |
Push-forward logic |
Filter condition granularity |
Current period |
Comparison period |
||
|
Week |
Compare (of Last Year) |
Based on the current week number and day of the week, go back one year. |
Day |
20200101~20200522 |
2020-01 week Wednesday~2020-21 week Friday |
2019-01 week Wednesday~2019-21 week Friday |
20190102~20190524 |
Take a cross table as an example.
-
On the dashboard editing page, go to the Fields tab, add fields, and configure the comparison feature.
-
Add fields.
-
In the Dimensions list, find Region, and double-click it or drag it to the Rows section.
-
In the Measures list, find order amount, and double-click it or drag it to the Columns section.
NoteTo easily view the order amount and year-on-year comparison of the current period and the comparison period, you can add 3 order amounts to the Columns section.
-
-
Hover over the order amount measure field, click the
icon on the right, and select Advanced Calculation -> Comparison -> Custom. -
In the Comparison Settings window, configure the date field, comparison type, and data settings.
In this example, Comparison Date is set to order date (week), Comparison Type is set to Year-over-year, and Data Settings is set to Specific Value and Percentage Difference. The Same Period Comparison option is also selected.

-
Click OK.
-
-
Add and configure query conditions.
-
On the dashboard editing page, click Query.
You can also modify the date range and perform a query.
Now, we can see that the current period is from January 1, 2020 to May 22, 2020, that is, from 2020-01 week Wednesday (January 1, 2020) to 2020-21 week Friday (May 22, 2020), and the total order amount is 1.792 million. The comparison period is from 2019-01 week Wednesday (January 2, 2019) to 2020-21 week Friday (May 24, 2020), and the order amount is 511,300. The year-on-year comparison is 250.44%.
Dynamic Comparison
If dimensions do not contain date fields, you need to select a date field on the Comparison Settings page and configure the comparison feature.
In dynamic comparison, the comparison date granularity must be exactly the same as the filter condition granularity. Otherwise, the comparison feature does not take effect.
Similar to DimensionsContain Multiple Date Fields, if dimensions do not contain date fields, the system also supports configuring Dynamic Comparison. The following example shows how to configure dynamic comparison. A cross table is used in this example.
-
On the dashboard editing page, go to the Fields tab, add fields, and configure the comparison feature.
-
Add fields.
-
In the Dimensions list, find Product Package, and double-click it or drag it to the Rows section.
-
In the Measures list, find profit amount, and double-click it or drag it to the Columns section.
-
-
Hover over the profit amount measure field, click the
icon on the right, and select Advanced Calculation -> Comparison -> Custom. -
In the Comparison Settings window, configure the date field, comparison type, and data settings.
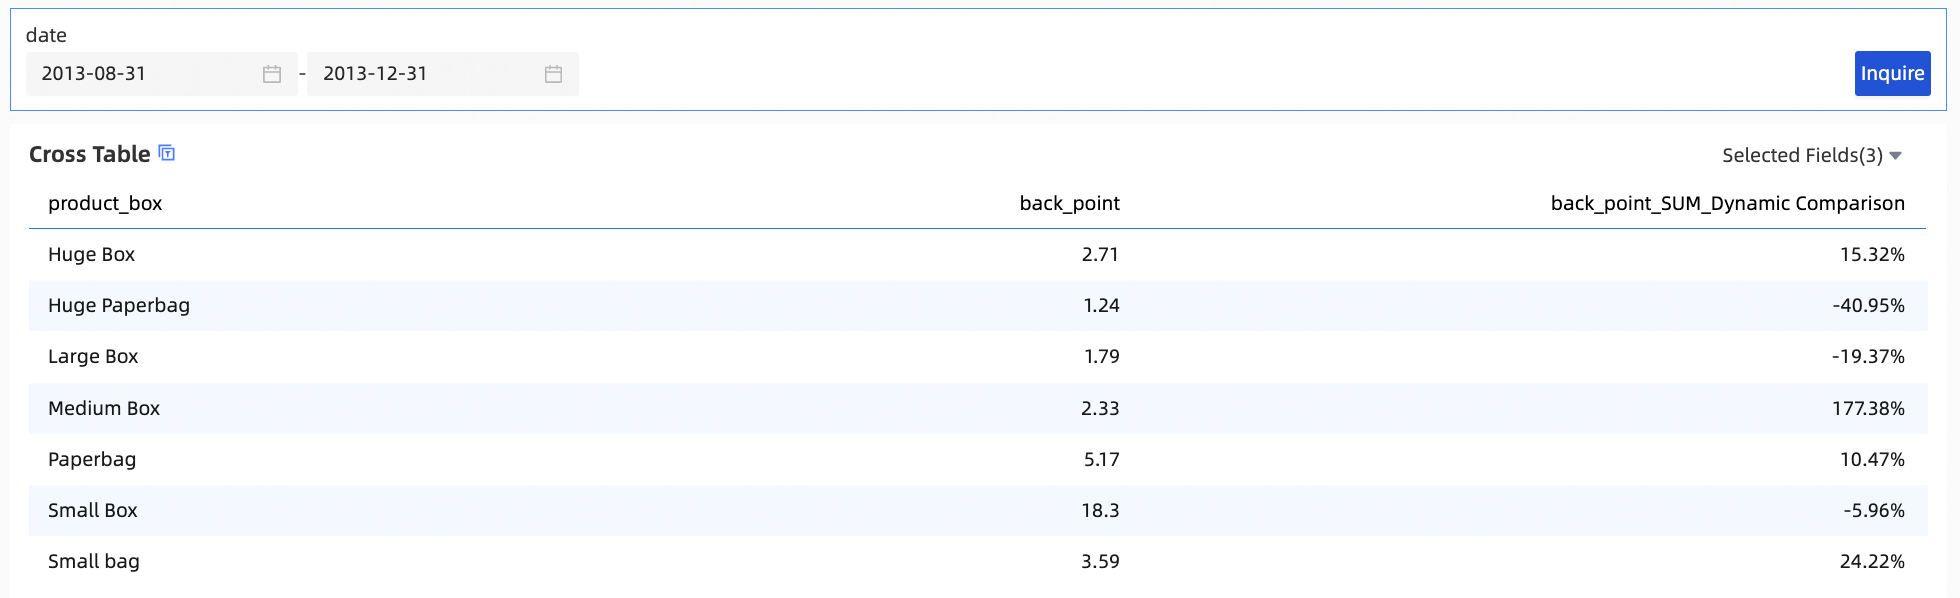
In this example, shipping_date(day) is selected for Date for Comparison, Dynamic Comparison for Comparison Type, and Percent Difference From for Data Settings.
 Note
NoteData Settings supports Specific Value, Difference From, Percent Difference From, and Proportion.
-
Click OK.
-
-
Add and configure query conditions.
 Note
NoteThe date field that you specified in the filter bar must be the same as the date field that you specified for the comparison feature.
-
On the dashboard editing page, select a query range and click Query.
You can also modify the date range and perform a query.
-
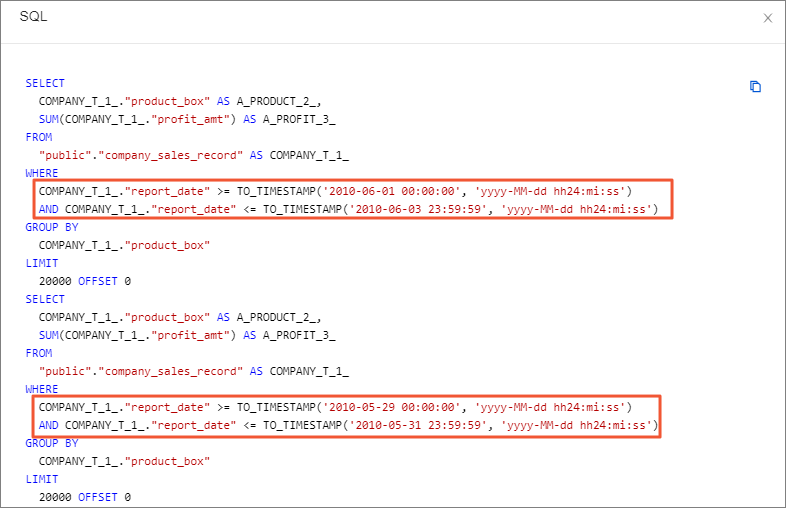
View SQL statements.
When Comparison Type is set to Dynamic Comparison, the system dynamically calculates the comparison value based on the date range selected in the filter condition. The system first calculates the difference between the specified date and the related previous date, and then subtracts the date that corresponds to the minus loop. For example:
-
If the specified date is January 10, 2020, the date for comparison is January 9, 2020.
-
If the specified time range is January 1, 2020 to January 10, 2020, the time range for comparison is December 22, 2019 to December 31, 2019.
-
Hover over the upper-right corner of the cross table and click the
 icon.
icon. -
Select View SQL.
You can see the range of dynamic comparison.
-
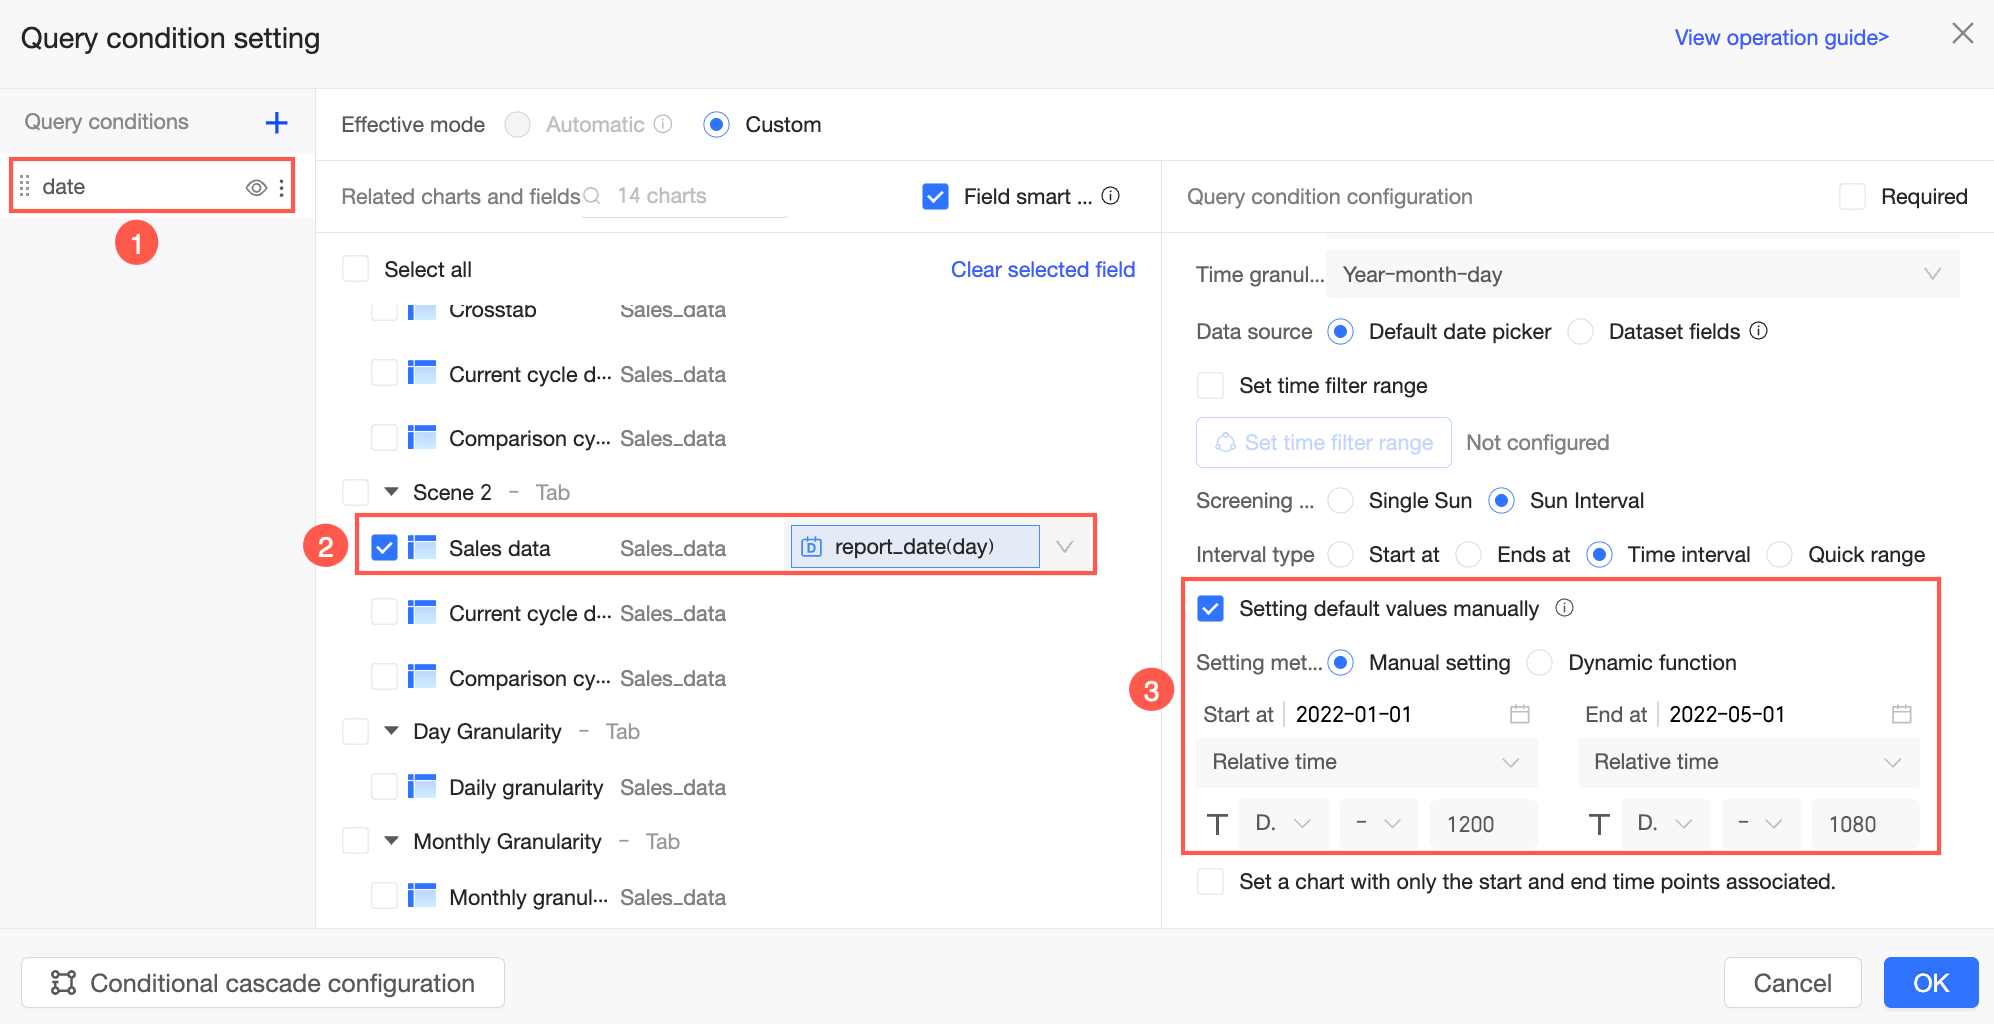
Placeholder Binding
When the chart dimensions do not include a date field, you can perform time-based comparisons based on a date placeholder. After you configure the placeholder, the date value passed to the placeholder from the query control is used as the base time point for the calculation.
The following example shows how to view the order amount by product type in a cross table and calculate the month-over-month order amount based on a date range specified in a query control.
-
Configure a placeholder: Create a dataset and configure a date placeholder for it.
-
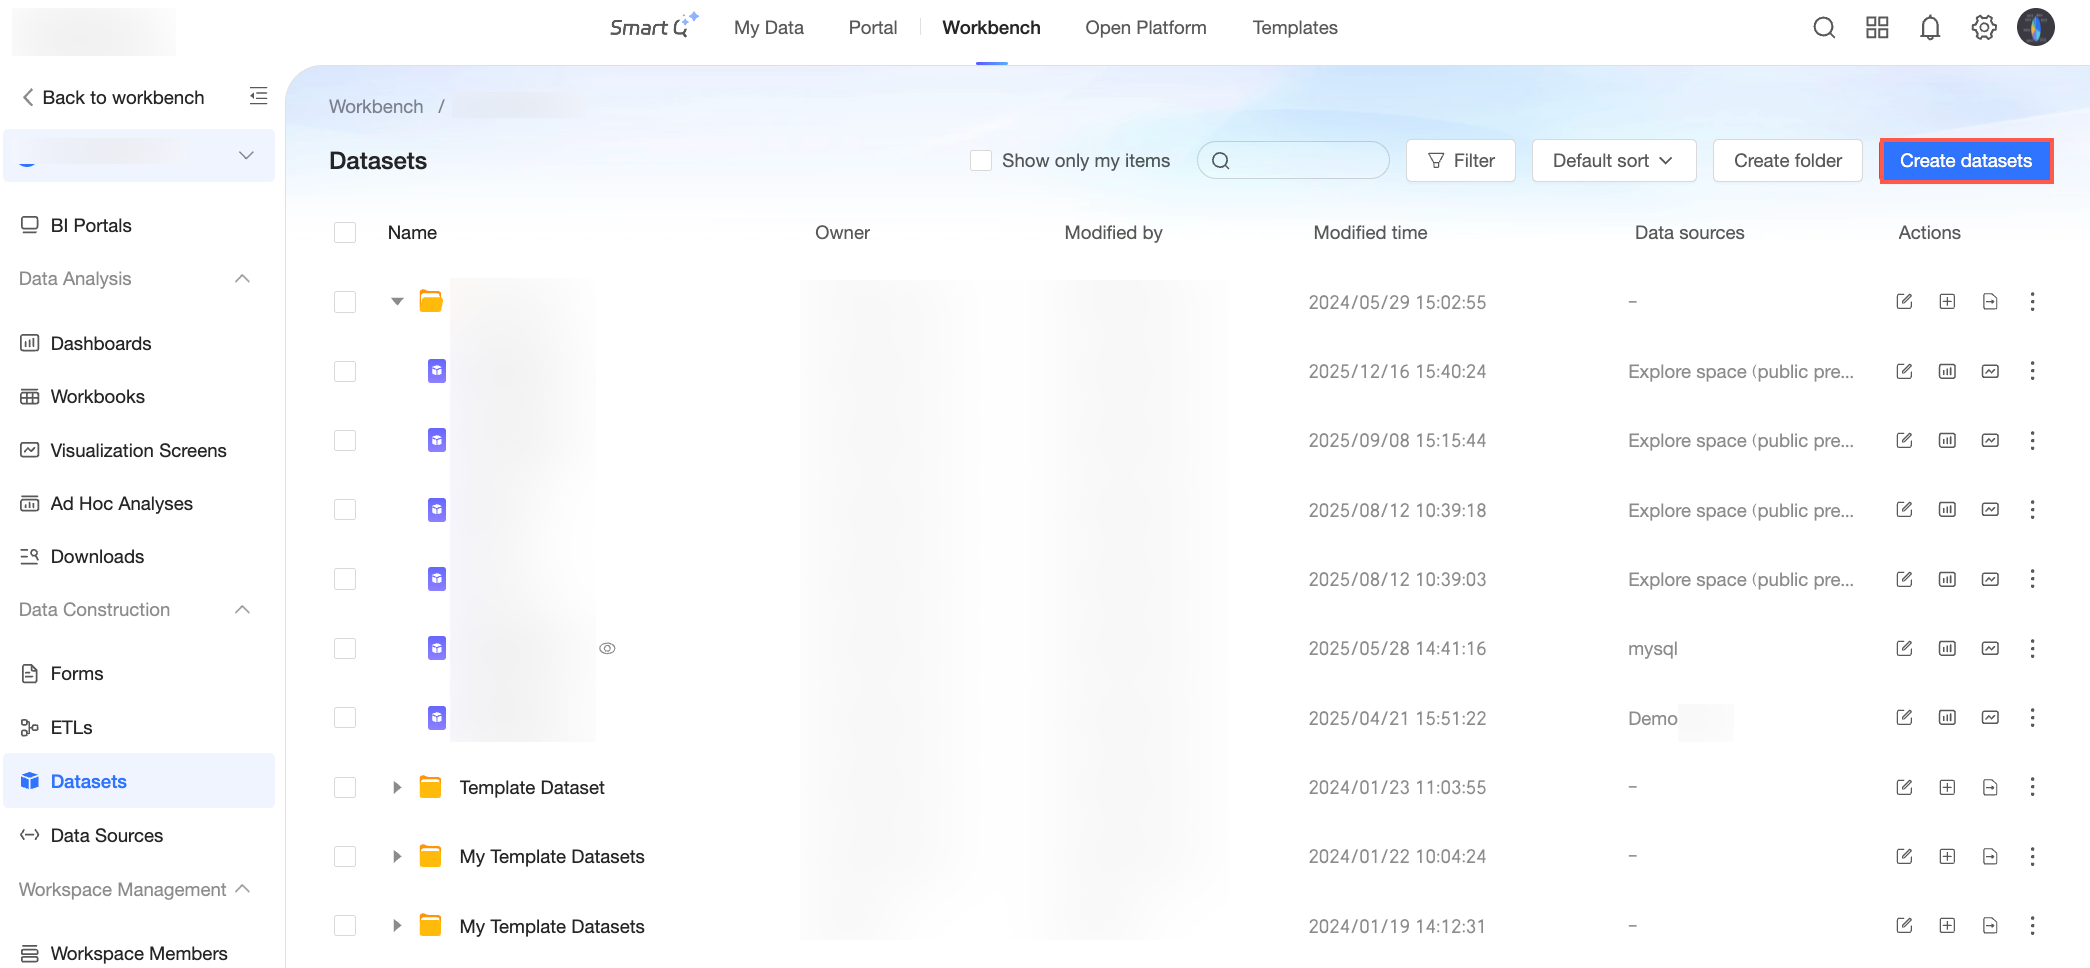
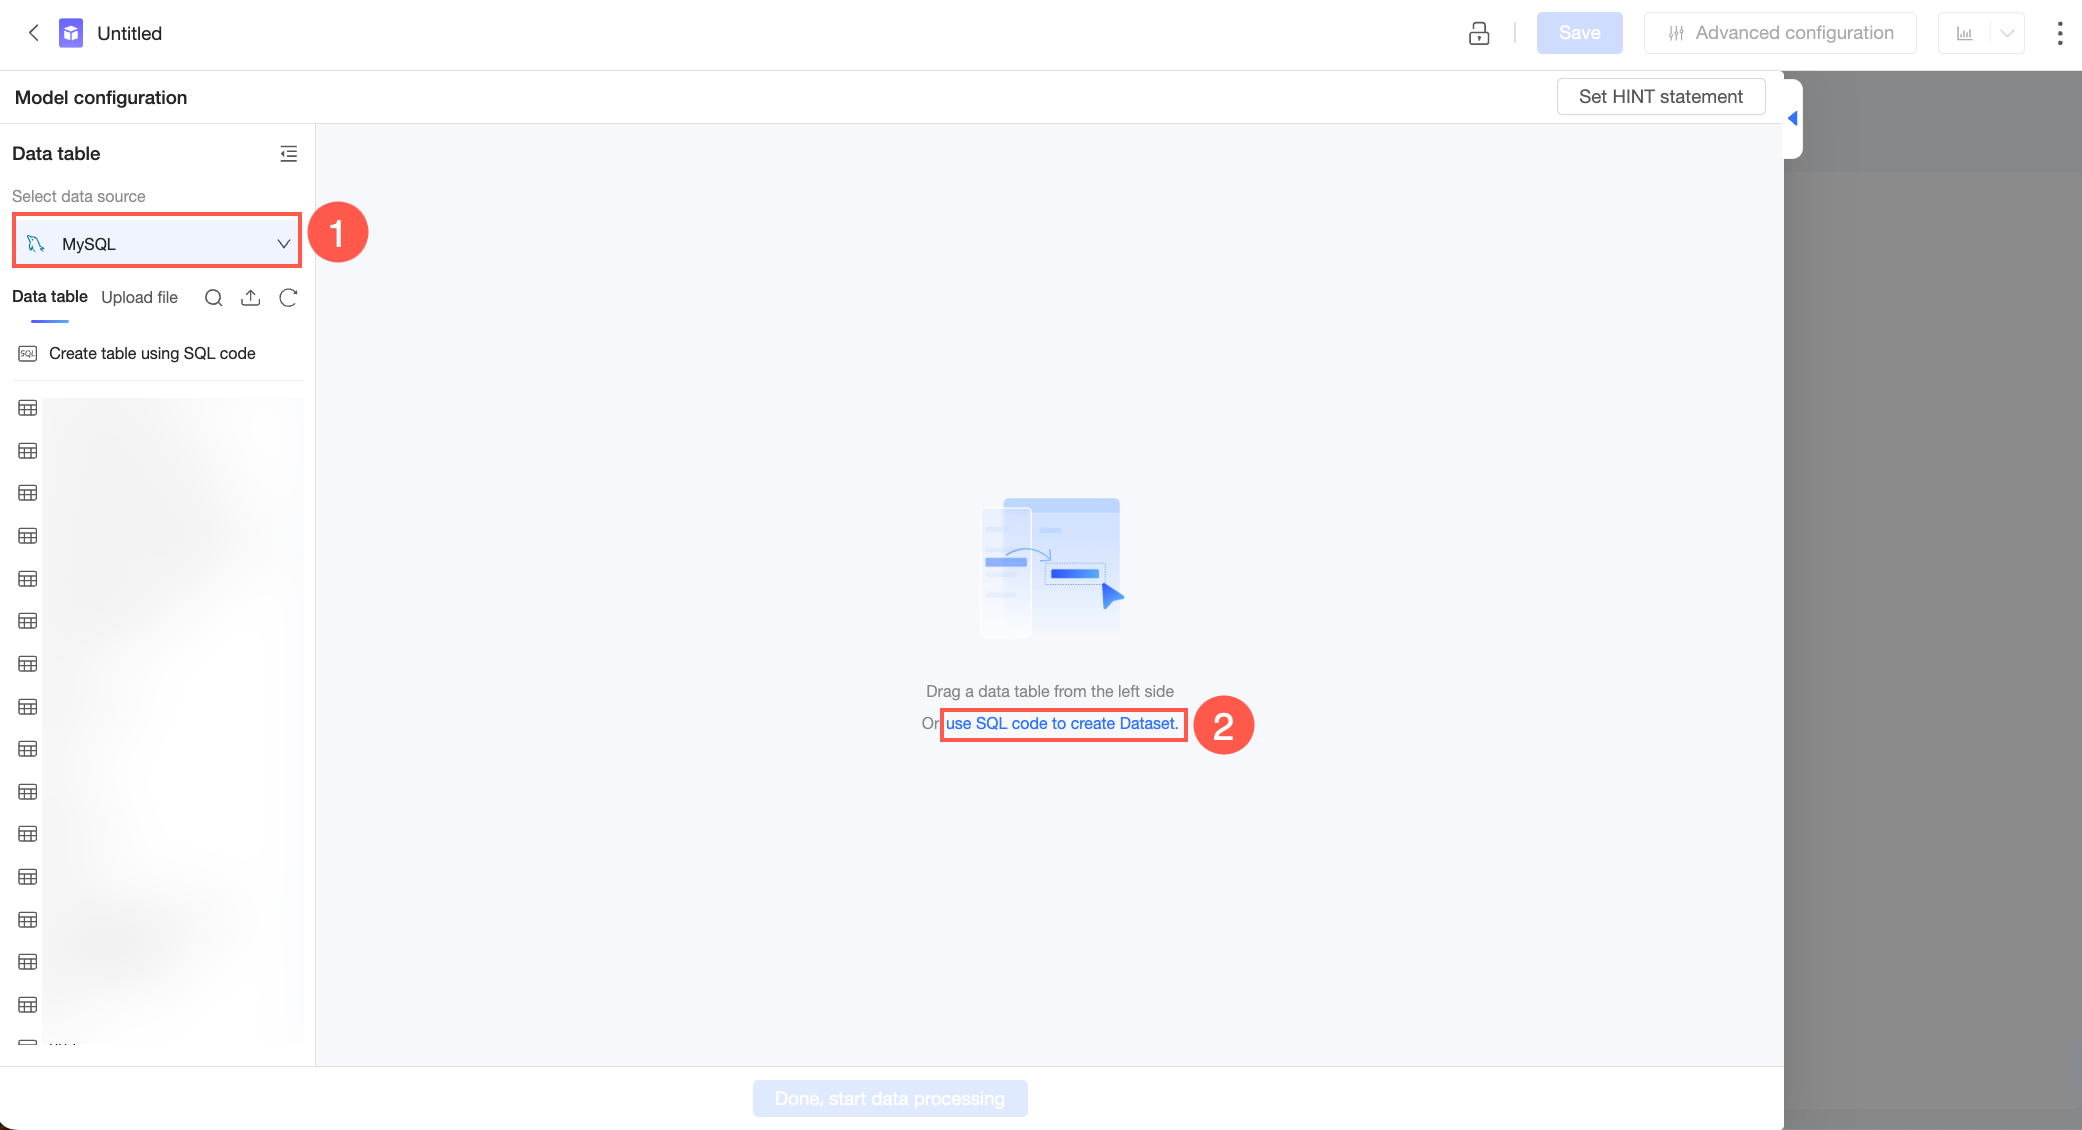
Log on to the Quick BI console and click Create Dataset on the Datasets page.
-
On the dataset creation page, select the database you want to use from the list on the left, and then click Create Dataset with SQL on the right.
-
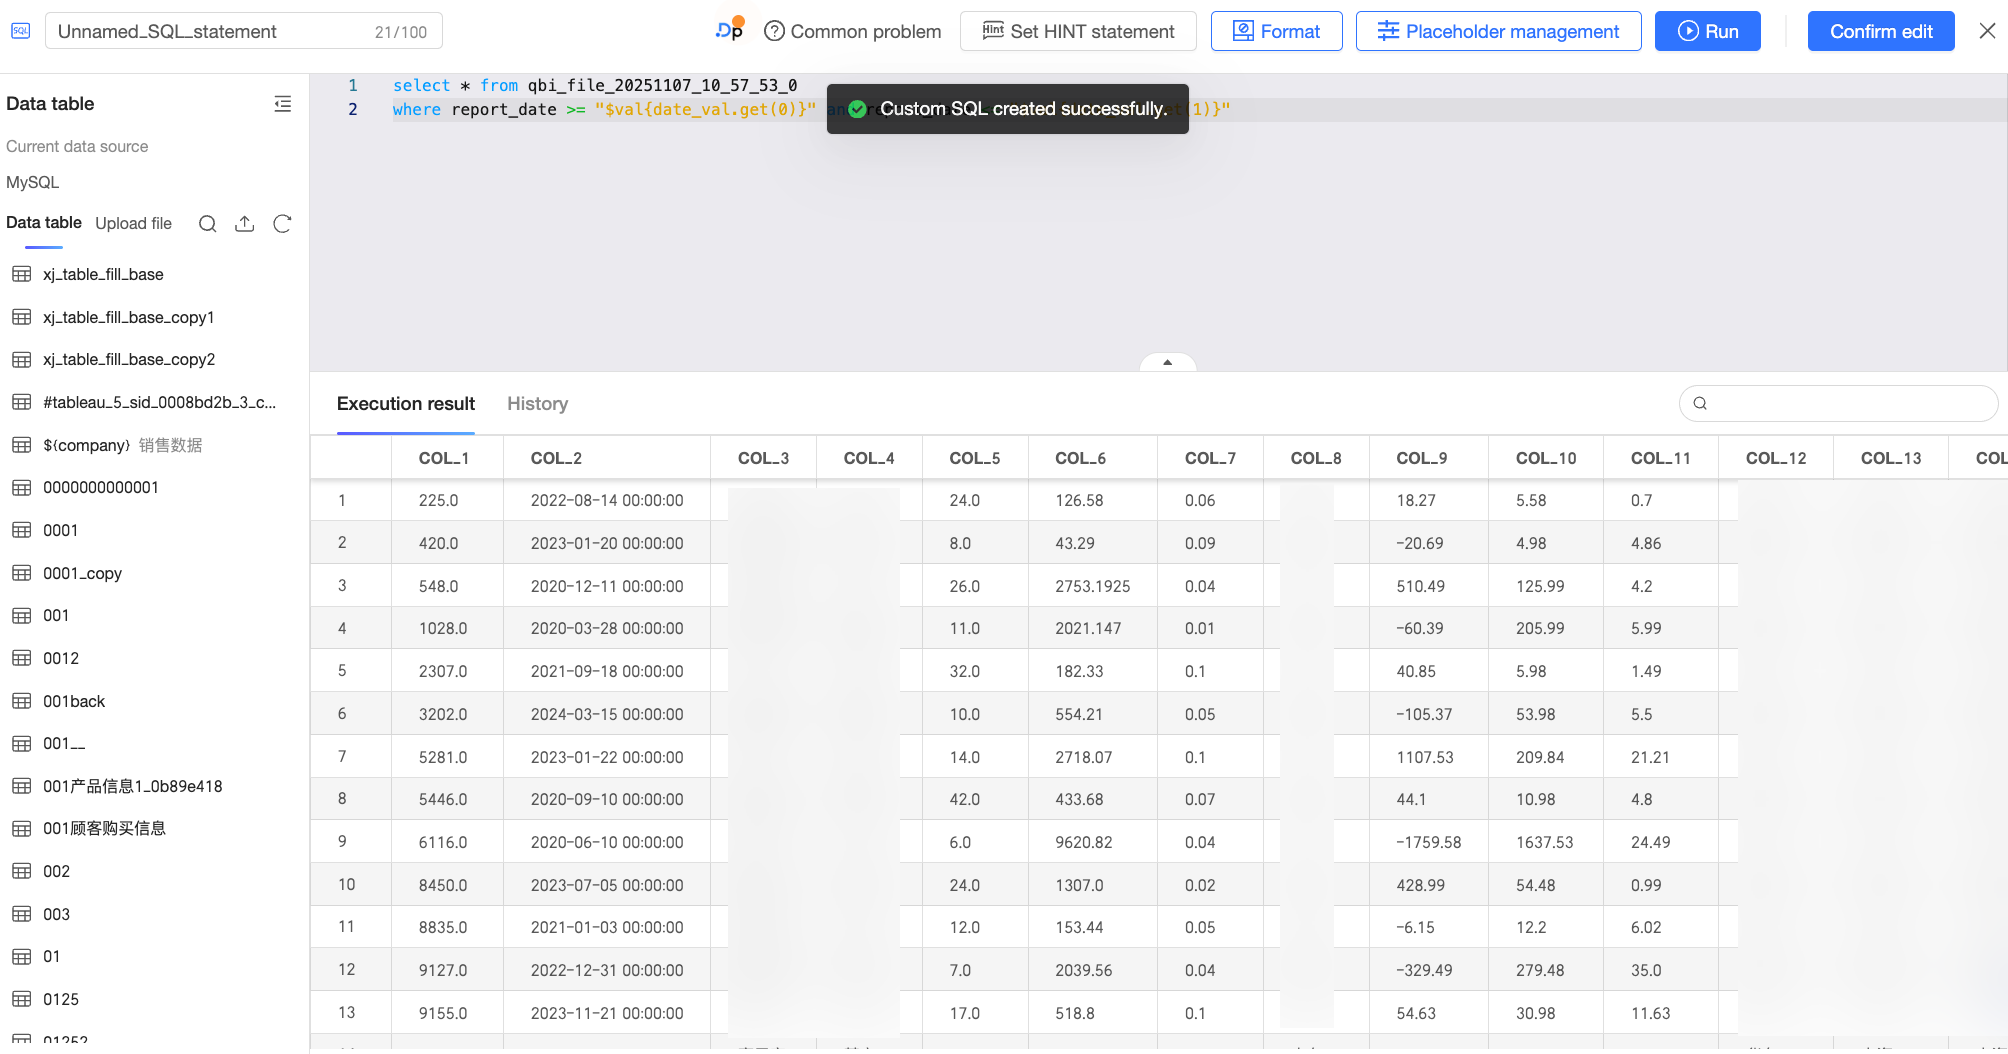
On the custom SQL editing page, use an SQL statement to reference the placeholder as required.
This example needs to reference a date placeholder in the
qbi_file_20251107_10_57_53_0data table. This allows thereport_datefield value in the subsequent dashboard to be dynamically adjusted based on the value passed to the date placeholder from the query control. The code is as follows.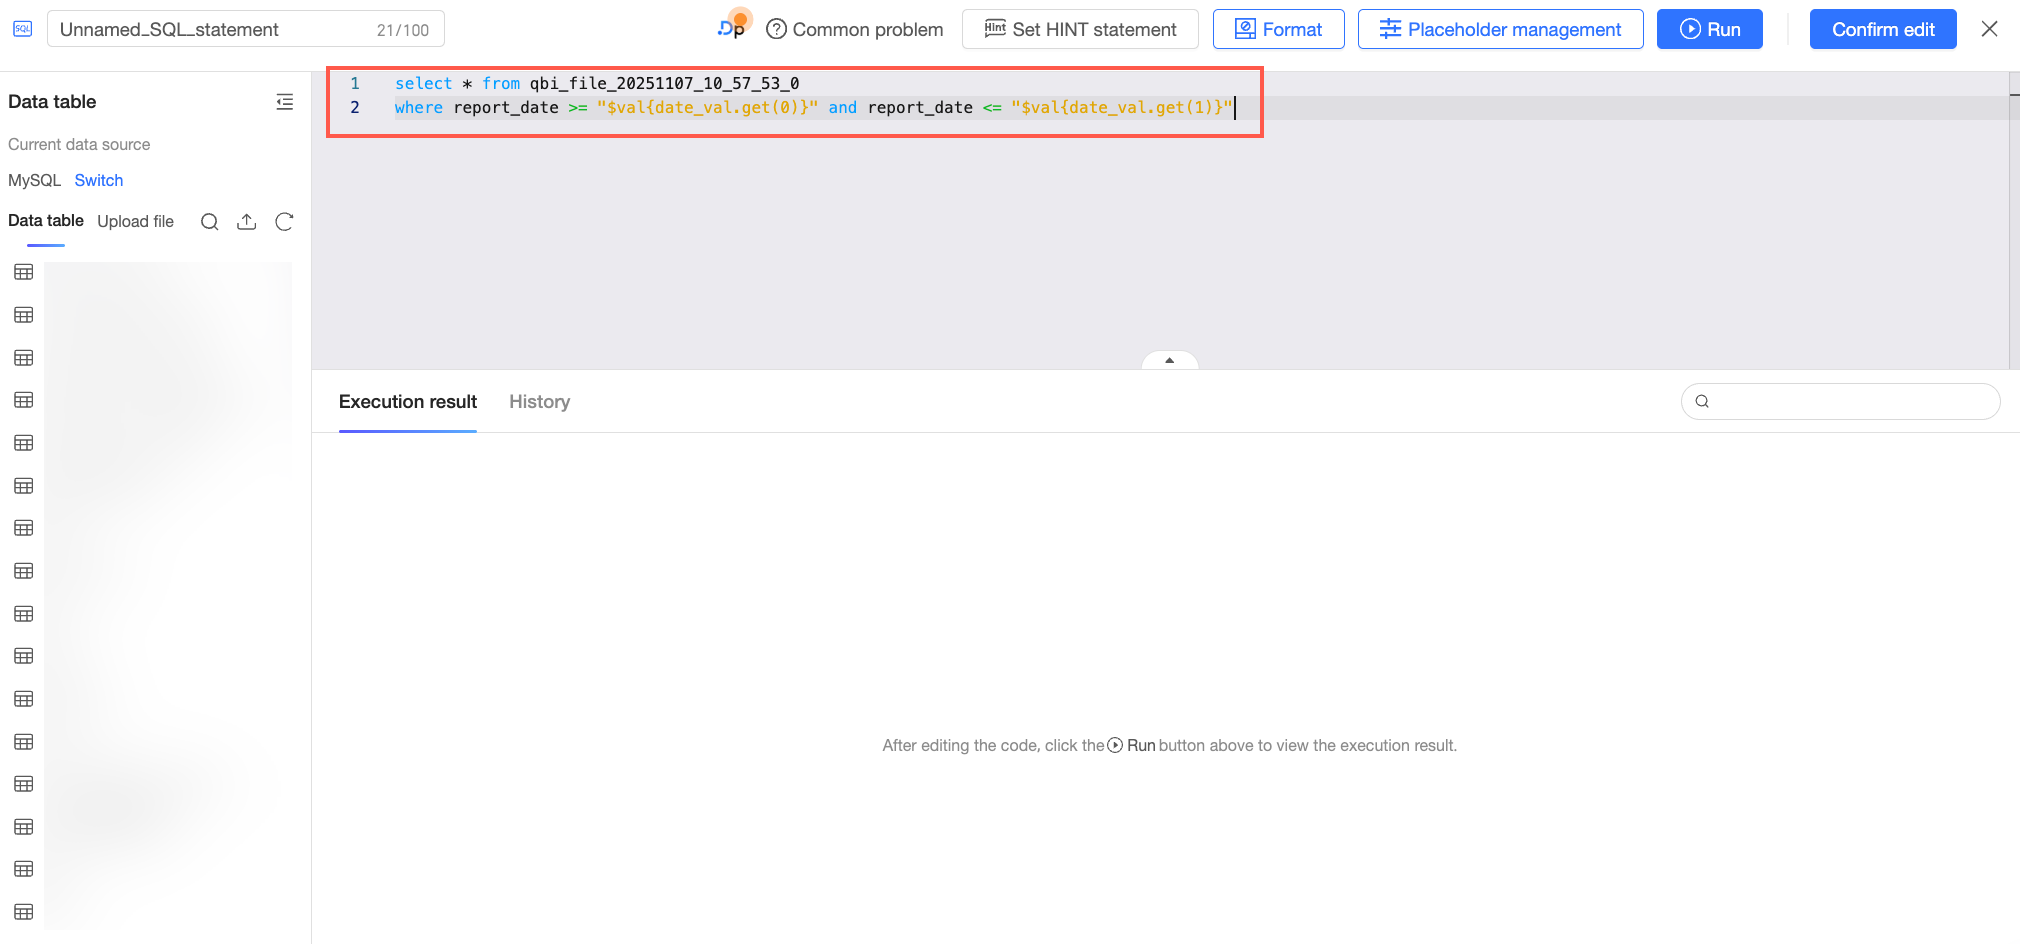
select * from qbi_file_20251107_10_57_53_0 where report_date >= "$val{date_val.get(0)}" and report_date <= "$val{date_val.get(1)}" -
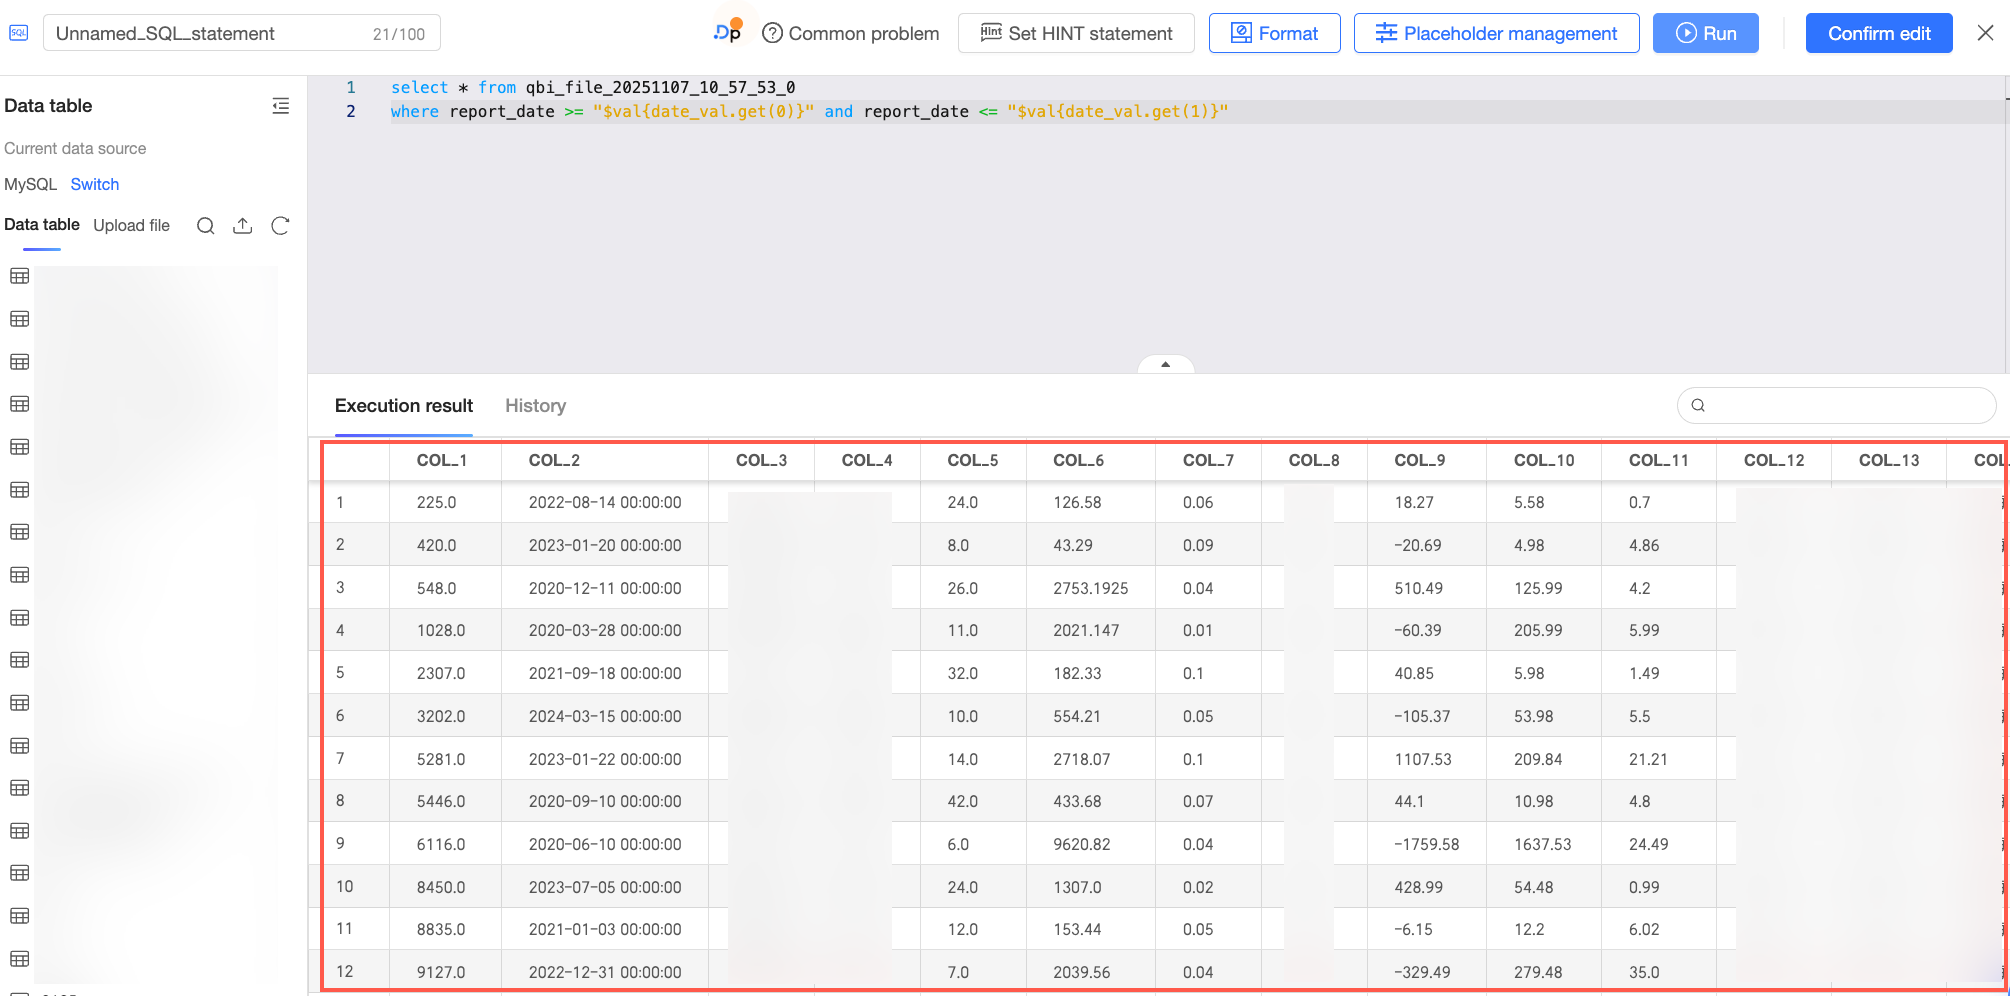
Click the Run button at the top of the page and view the execution result of the custom SQL statement on the Run Result tab.
-
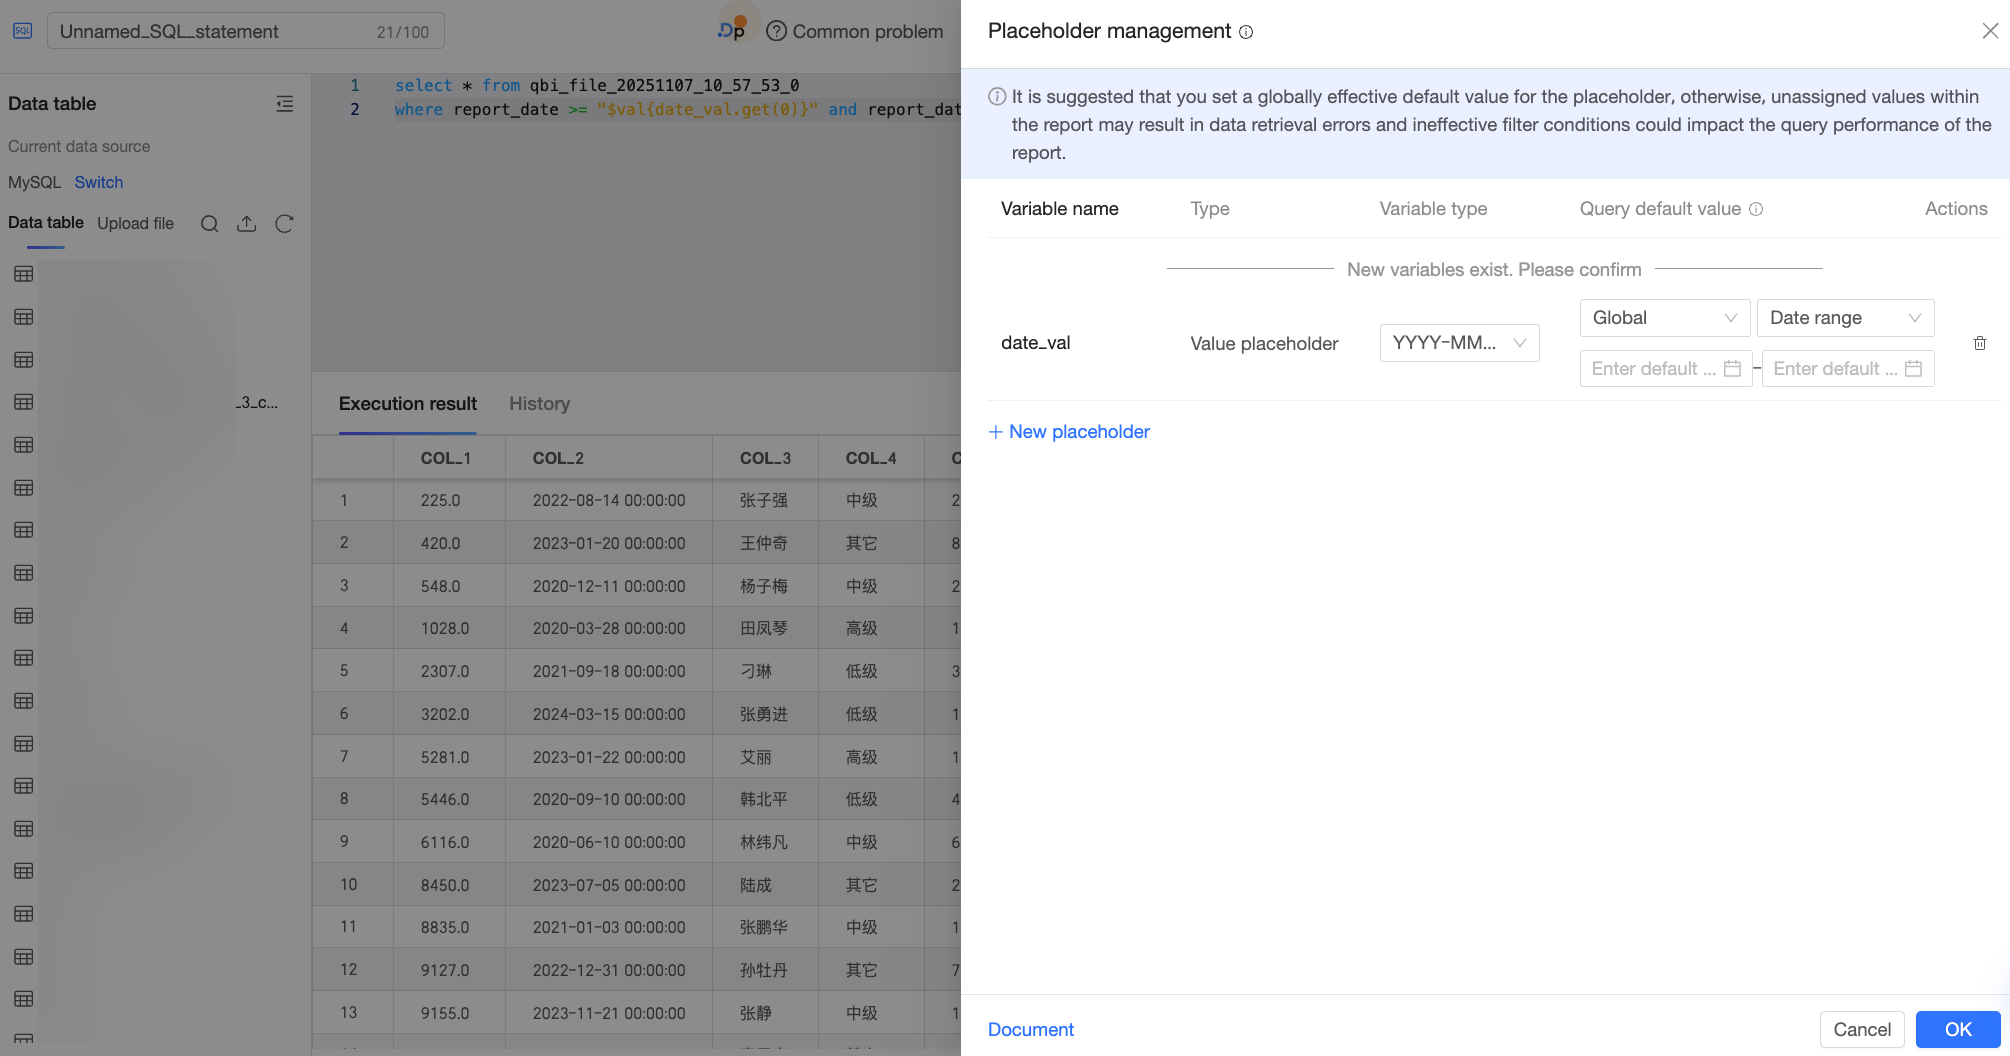
After you confirm the result, click Confirm Edit. The system automatically detects the placeholder that you referenced in the SQL statement and adds it to the placeholder list. You must confirm the placeholder's information in the Placeholder Management dialog box, and then click Confirm.
In this example, because the subsequent comparison is month-over-month, set Variable Type to Date-Year-Month-Day (YYYY-MM-DD) to ensure that it supports the month-over-month calculation.
 Note
Note-
Ensure that the created placeholder is a Value Placeholder. Otherwise, the subsequent time-based comparison cannot be executed correctly.
-
The time-based comparison calculation depends on the correct use of the placeholder in the dataset. Ensure the placeholder is configured correctly. For more information about placeholder configuration, see Placeholders.
-
-
Click Confirm Edit again to save the custom SQL.
-
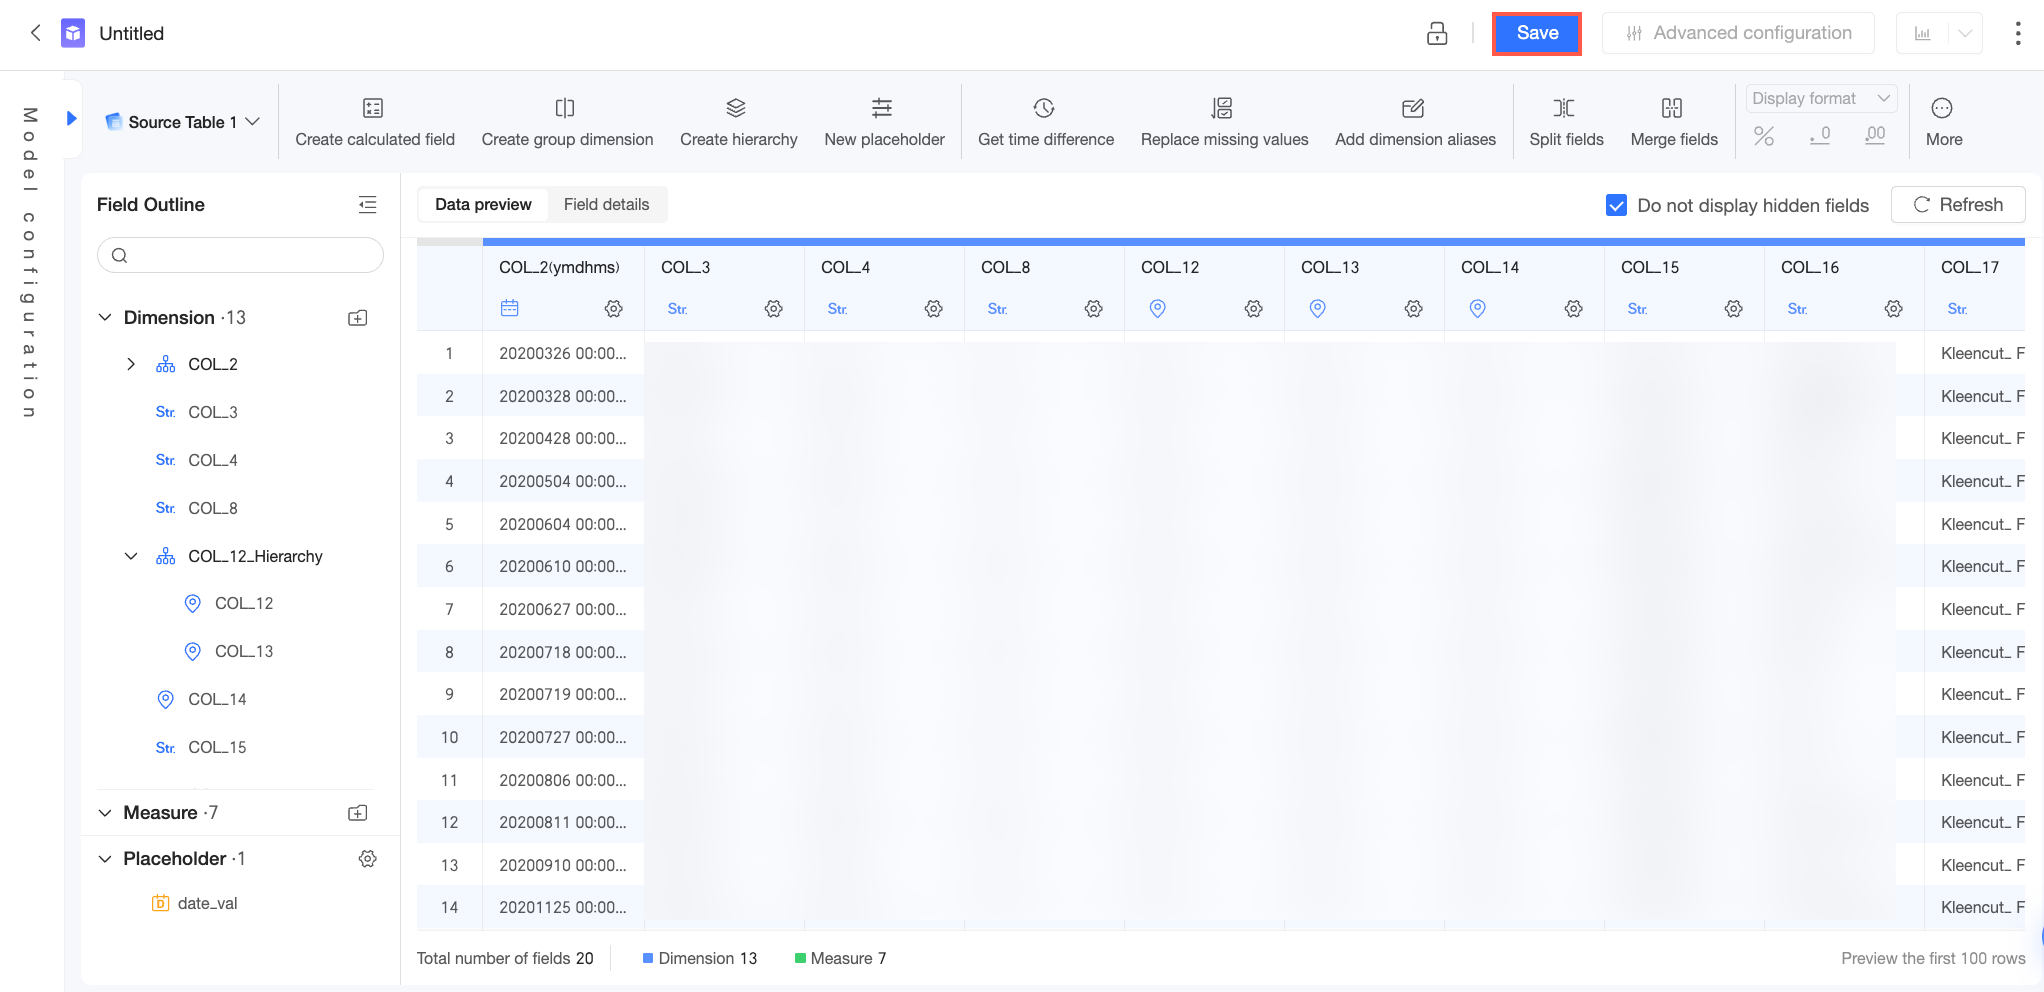
Close the custom SQL page. On the dataset editing page, click Start Data Processing to continue with other dataset configurations as required, such as adjusting field types or creating calculated fields. For more information, see Data processing.

-
After you complete the configuration, click Save in the upper-right corner to finish creating the dataset.
-
-
Configure the dashboard: Create a dashboard using the saved dataset.
-
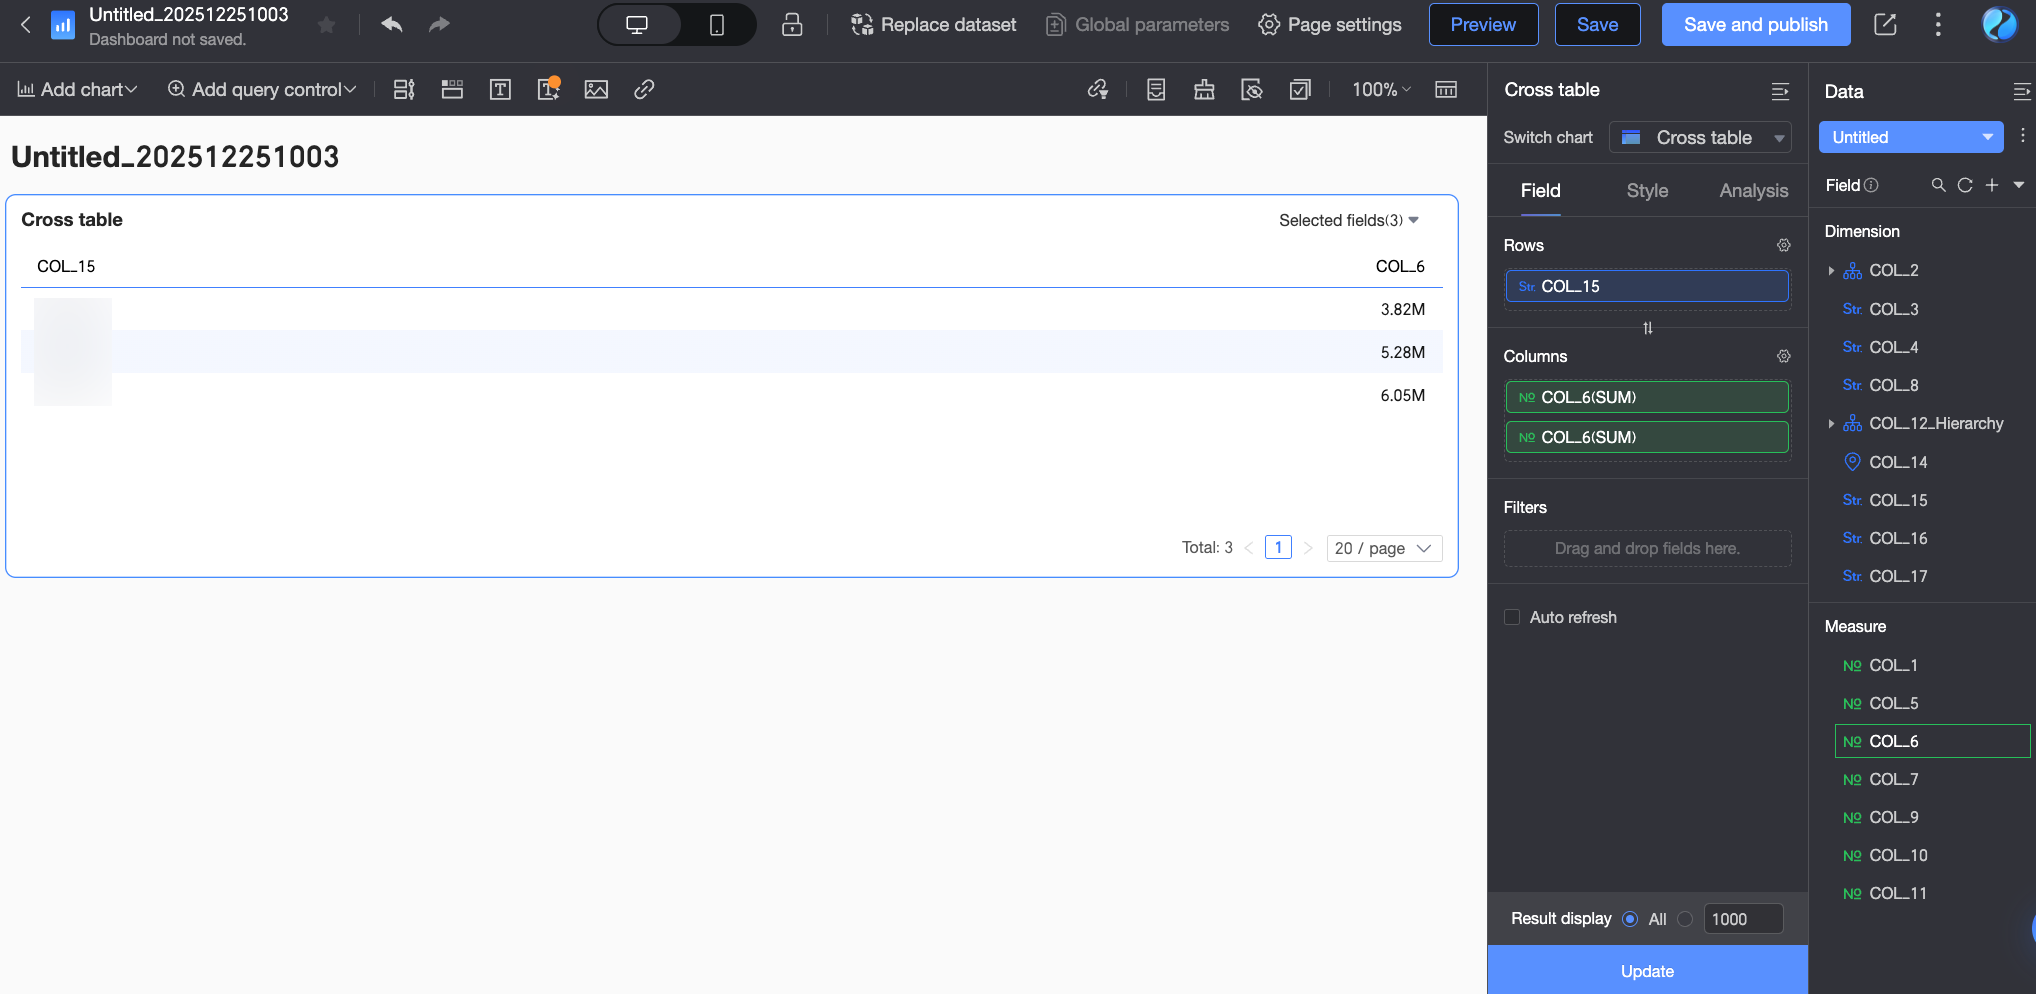
On the dashboard edit page, add a cross table and configure its fields using the dataset saved in the previous step. Because you need to calculate the month-over-month comparison for the order amount, drag two Order amount fields into the Columns area.
-
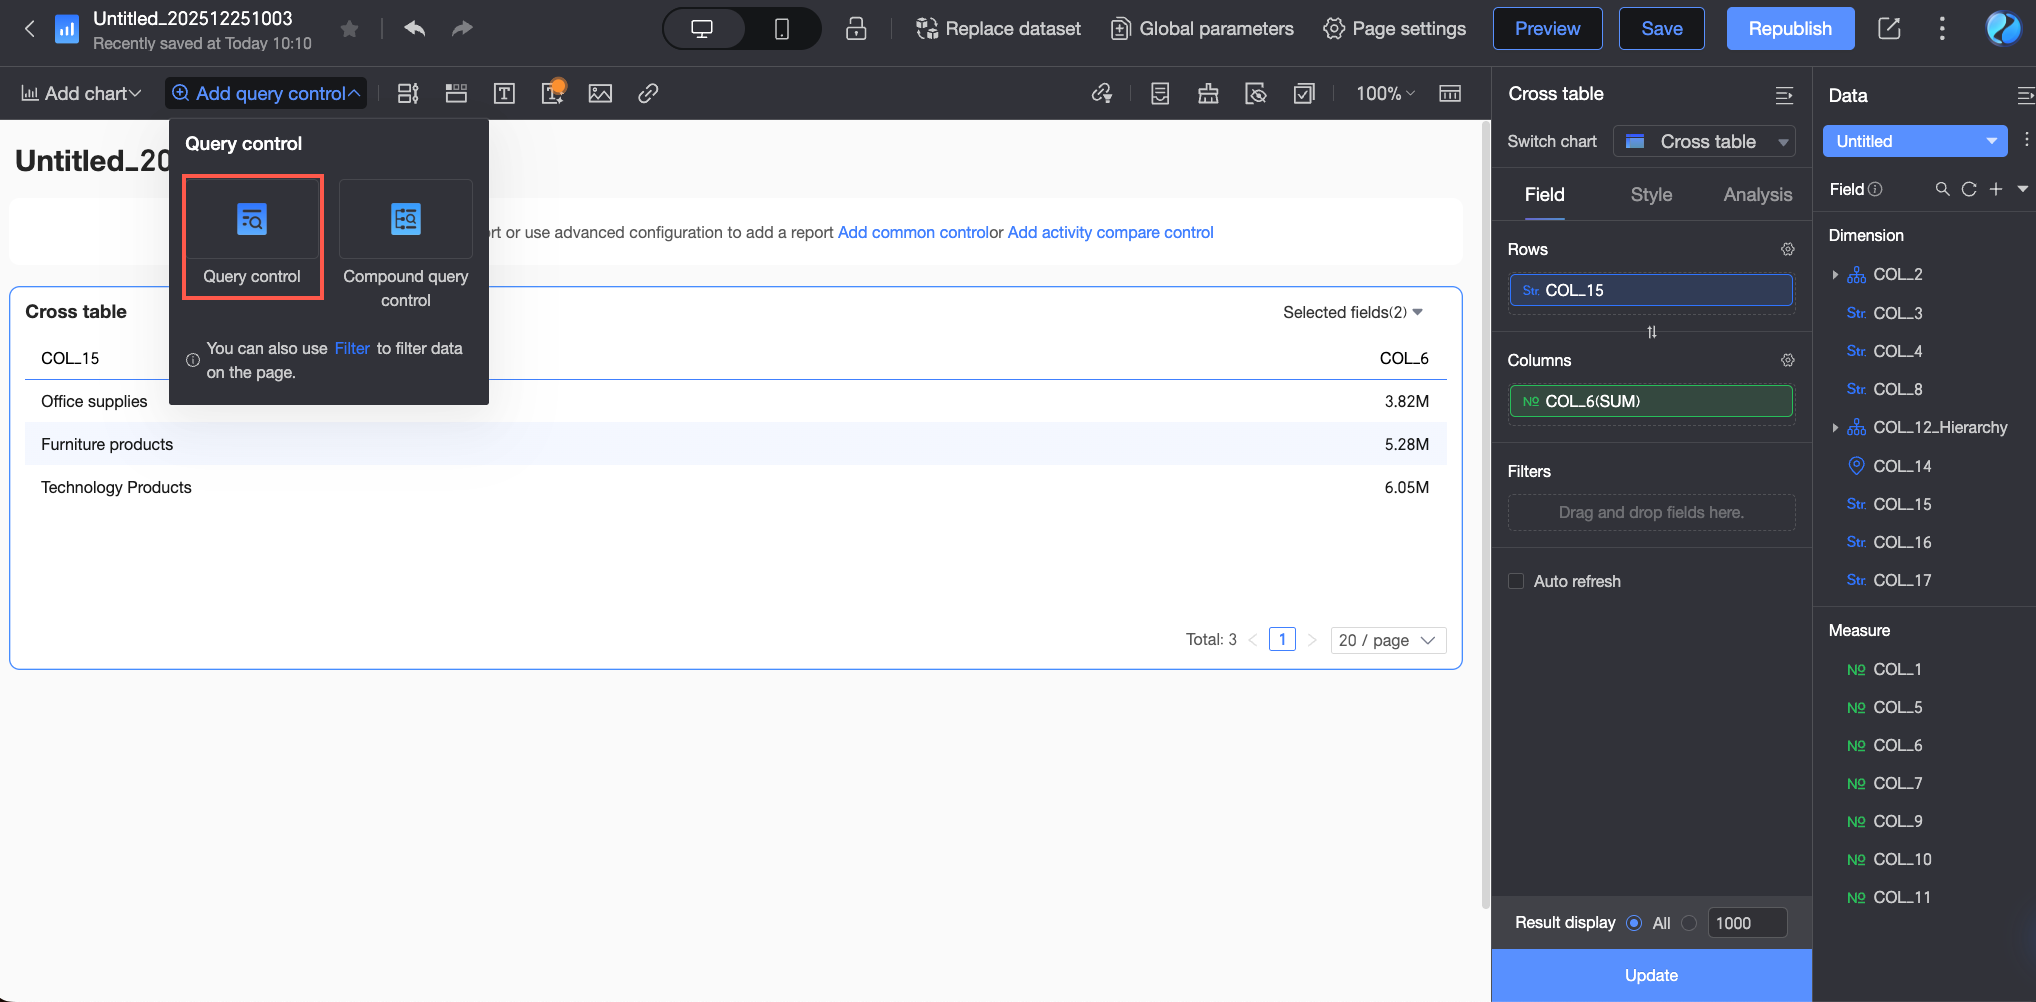
Click Add Query Control > Query Control to add an empty query control to the chart.
-
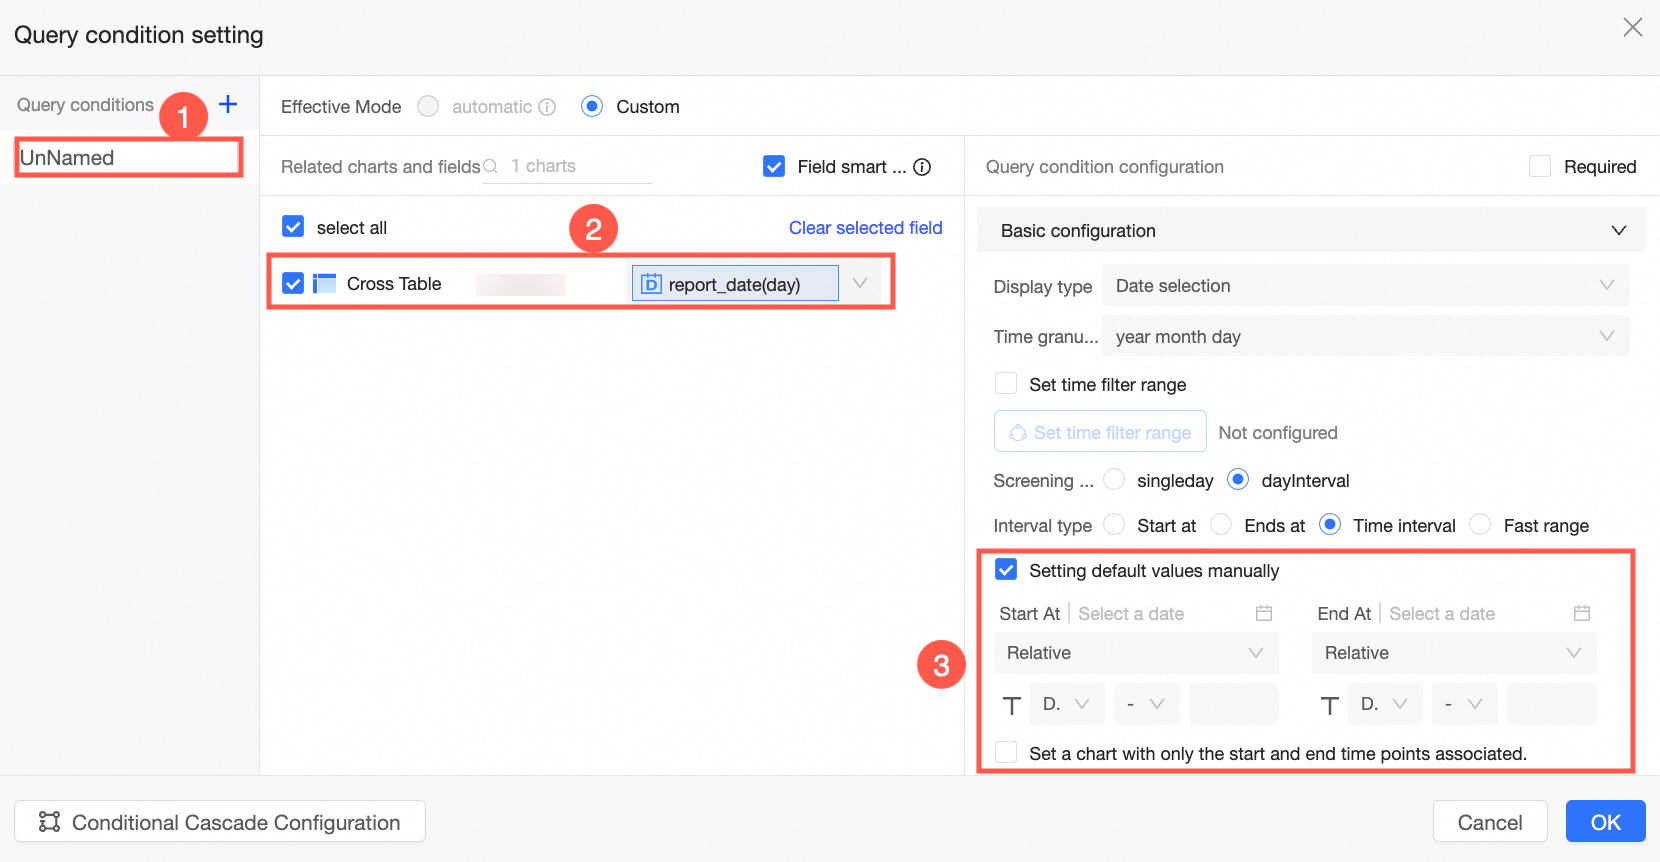
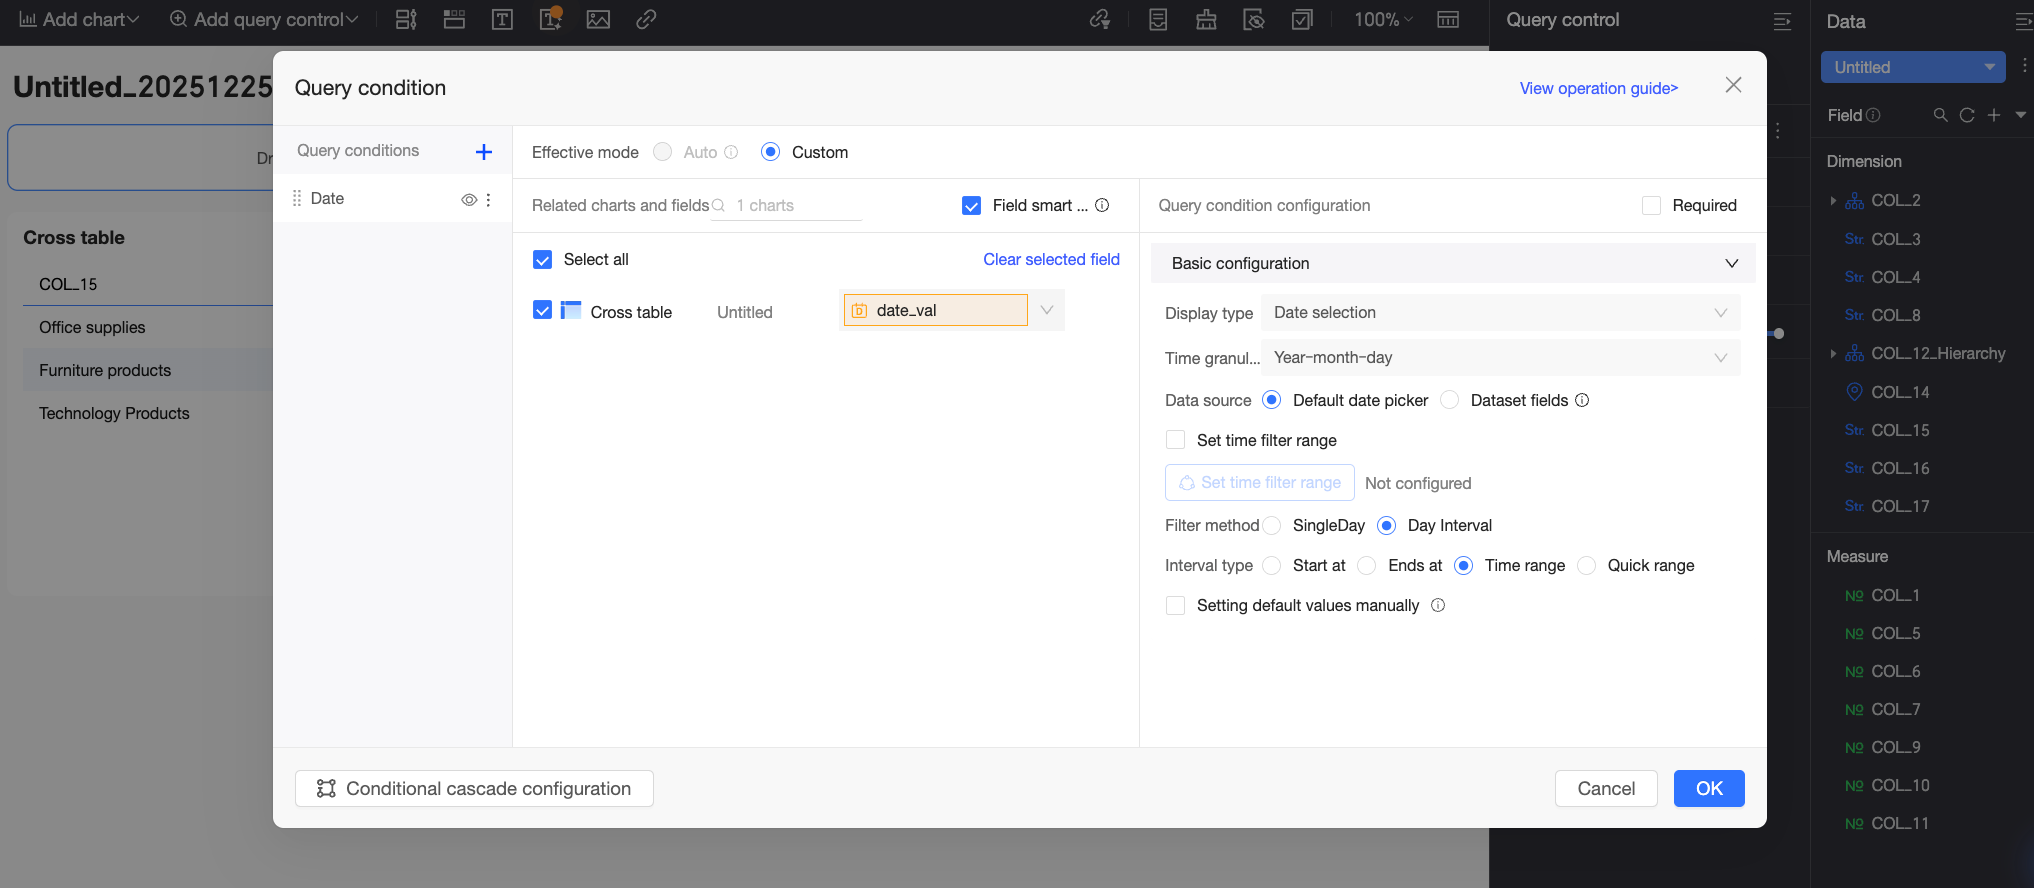
Click Add Standard Filter. In the Query Condition Settings dialog box, configure the query control's information, and then click OK to add the query control.
In this example, name the query control Time Range, associate it with the cross table on the current dashboard, and bind it to the value placeholder
date_valin the dataset that is used by the cross table. The date parameter value that is selected by the report viewer in the query control is dynamically passed to the dataset's SQL query condition through the value placeholder. This refreshes the cross table's data and enables order amount analysis based on the selected date.For more information about query control configuration, see Query controls.
-
-
Configure the time-based comparison: Configure the comparison for the Order amount field.
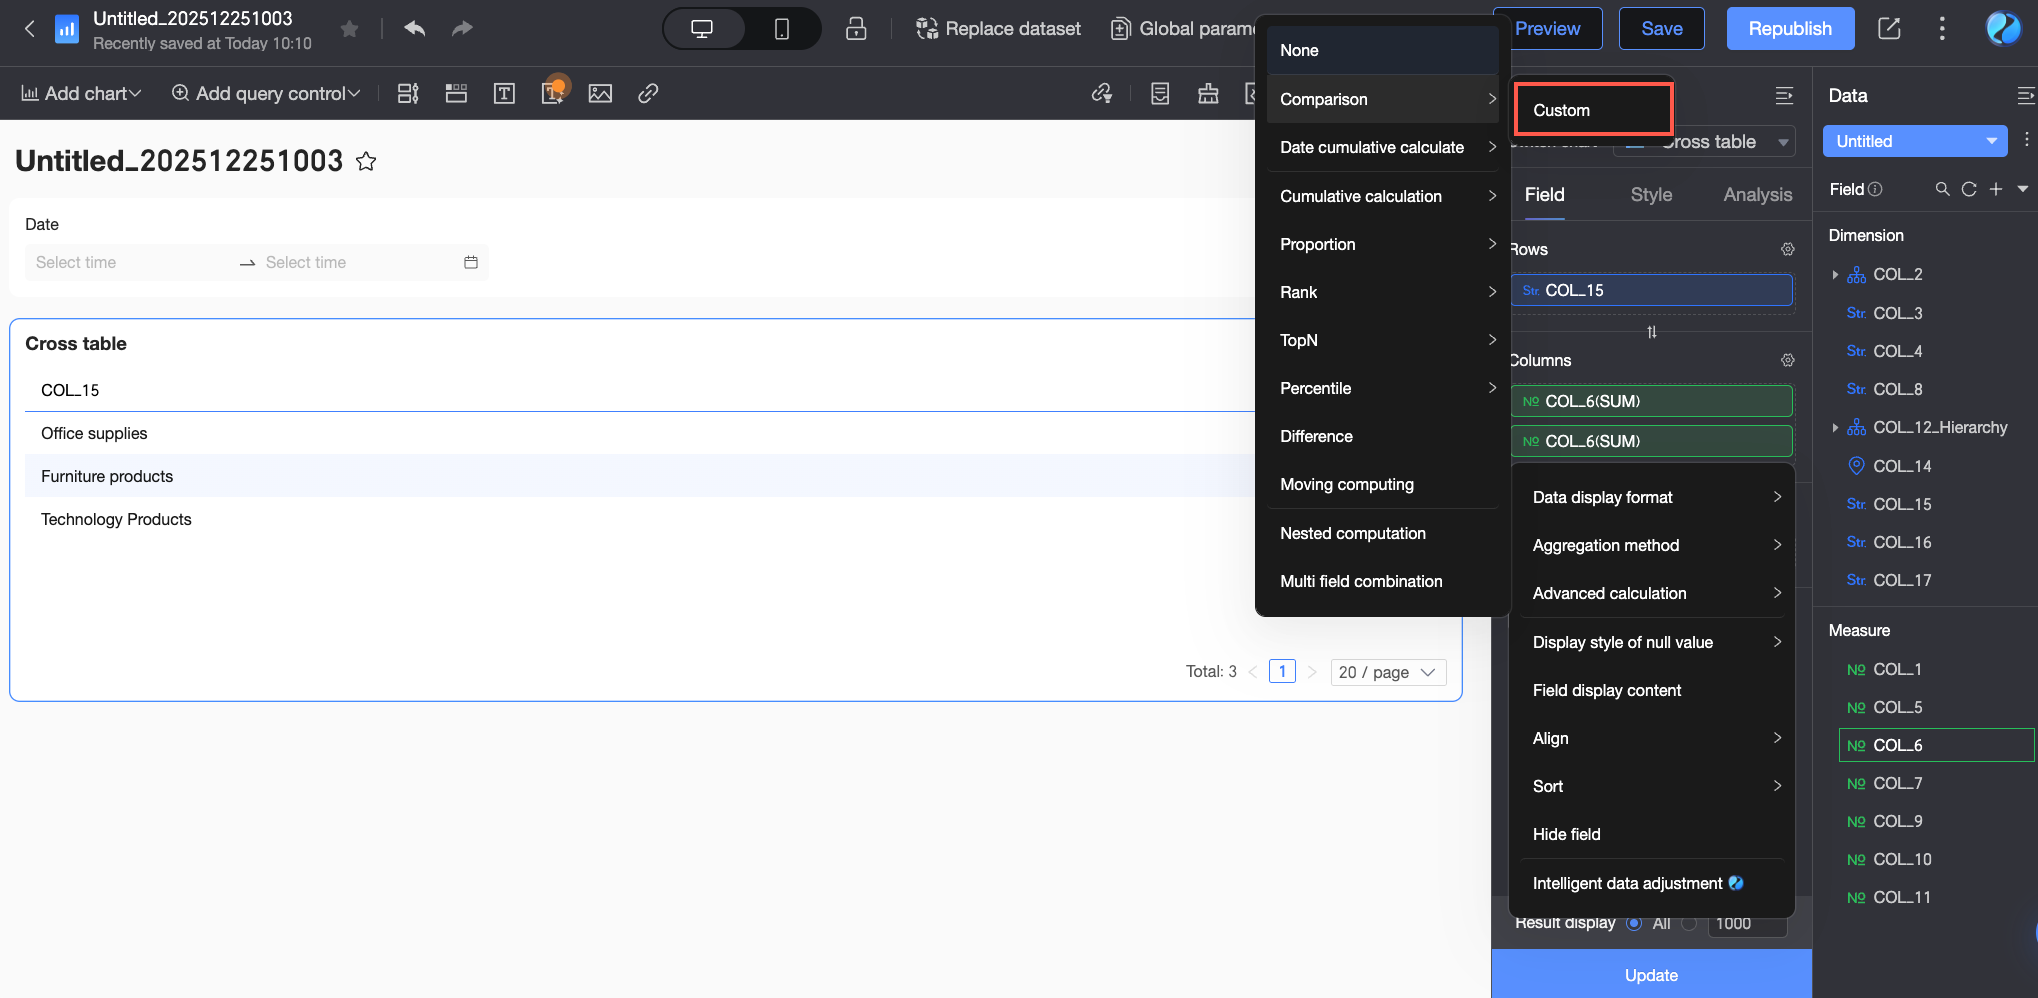
-
In the field configuration panel of the cross table, follow the steps shown in the figure to open the comparison settings interface.
-
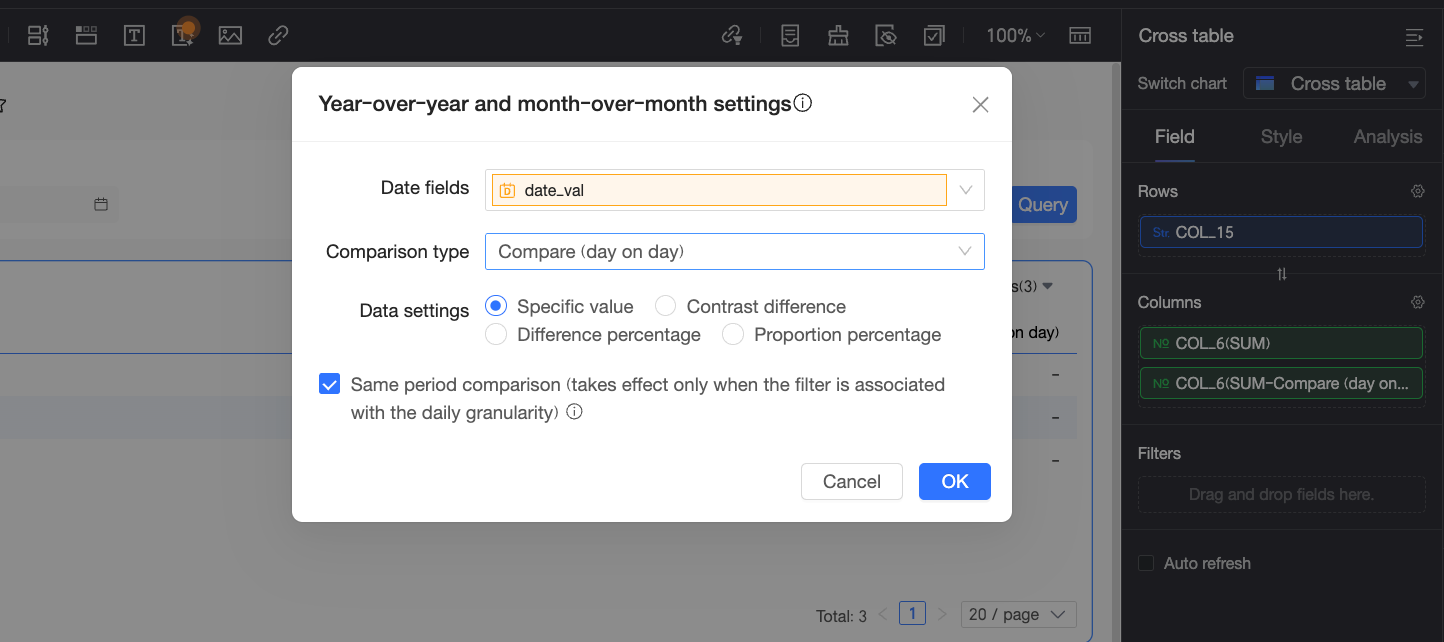
In the Comparison Settings dialog box, configure Date field, Comparison type, and Data settings.
In this example, set Date field to the date placeholder
date_val. The comparison is based on the date value that is received by this placeholder. Set Comparison type to Month-over-month and Data settings to Specific value.NoteEnsure that the placeholder selected in the date field is the same as the placeholder that is bound in the query control. Otherwise, the calculation will not be correct.
-
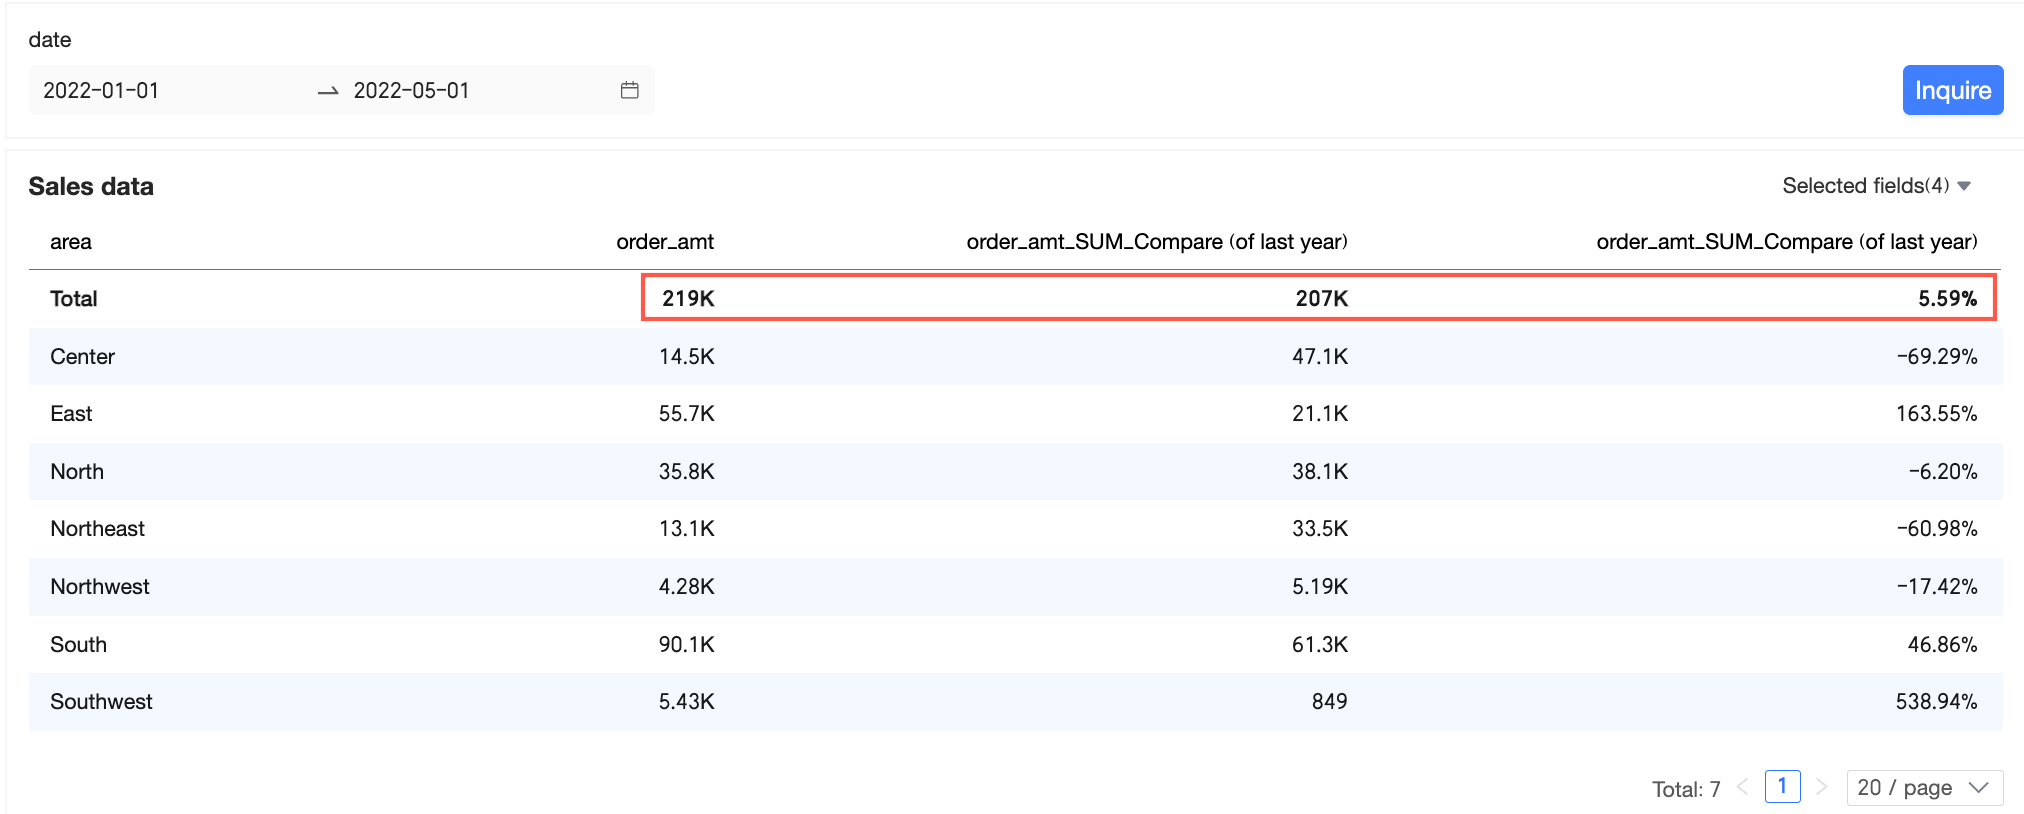
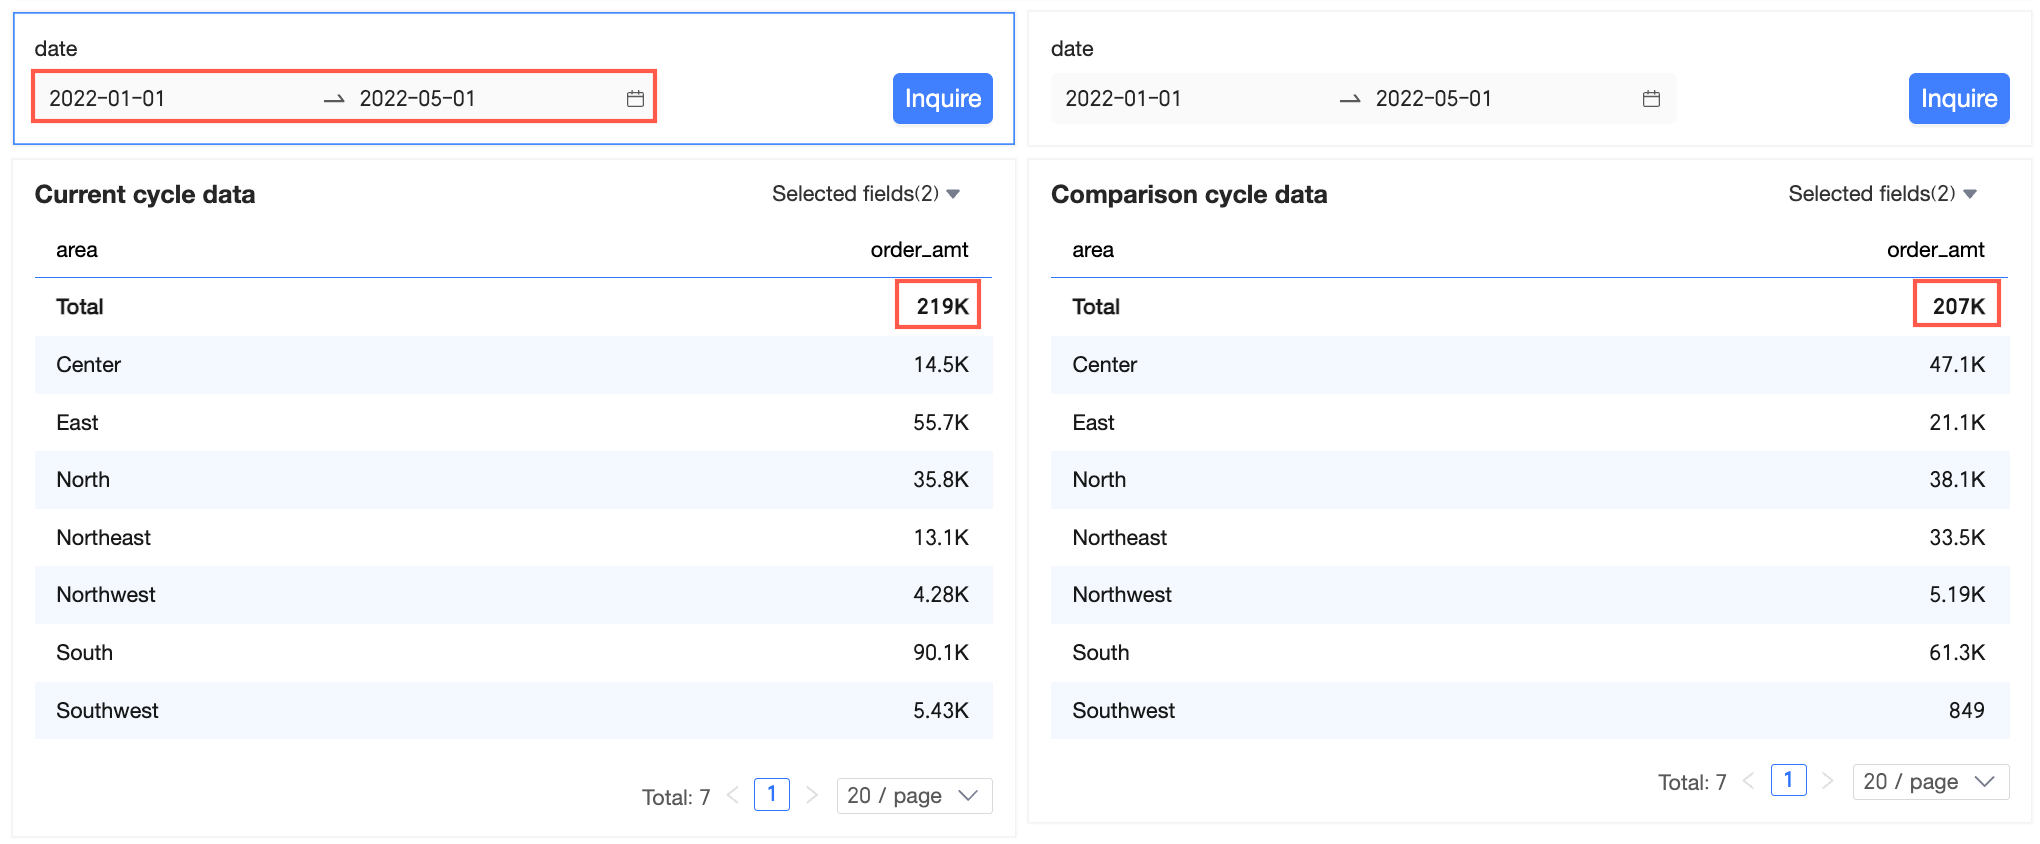
-
After configuring the comparison, click OK.
Custom Configuration
Custom configuration lets you set a comparison date based on your specific needs. The following example shows how to configure a comparison for the Order amount field with data from 2 months ago in a cross table.
-
On the dashboard edit page, on the Fields tab, add fields and configure the comparison.
-
Add fields.
-
In the Dimensions list, find Area and Order Date (month), and then double-click or drag them to the Rows area.
-
In the Measures list, find Order amount, and double-click or drag it to the Columns area. In this example, add two Order amount measures to the Columns area.
-
-
Hover over the Order amount measure, click the
icon, and select Advanced Calculation > Comparison > Custom. -
In the Comparison Settings window, configure the date field, comparison type, and data settings.
In this example, set the date field to Order Date (month), the comparison type to Custom, the comparison date to 2 Months Ago, and the data setting to Comparison Difference.
 Note
NoteData settings support Specific Value, Difference From, Percent Difference From, and Percentage Of.
-
Click OK and then click Update to update the chart.
-
-
Add and configure query conditions.
 Note
NoteThe date field configured in the query control must be the same as the date field in the comparison settings. In this example, both must be Order Date (month).
-
On the dashboard edit page, select a query range and click Query.

Advanced Configuration
When the Date field in the Comparison Settings window has a day granularity, you can use the Advanced configuration option. This lets you set the Comparison date to Start of this month, End of last month, Start of this quarter, End of last quarter, Start of this year, or End of last year. The following example shows how to set a comparison for the Order amount field relative to the data at the Start of this month in a cross table.
-
On the dashboard edit page, on the Fields tab, add fields and configure the comparison.
-
Add fields.
-
In the Dimensions list, find Area and Order Date (day), and then double-click or drag them to the Rows area.
-
In the Measures list, find Order amount, and double-click or drag it to the Columns area. In this example, add two Order amount measures to the Columns area.
-
-
Hover over the Order amount measure, click the
icon, and select Advanced Calculation > Comparison > Custom. -
In the Comparison Settings window, configure the date field, comparison type, and data settings.
In this example, the comparison date field is set to Order Date (day), the comparison type is set to Advanced Configuration, the comparison date is set to Beginning Of This Month, and Data Settings is set to Difference.
 Note
NoteData settings support Specific Value, Difference From, Percent Difference From, and Percentage Of.
-
Click OK and then click Update to update the chart.
-
-
Add and configure query conditions.
 Note
NoteThe date field configured in the query control must be the same as the date field used for the comparison.
-
On the dashboard editing page, select a query range and click Query.

Special Scenarios
When you configure the comparison feature and perform drill-down, dimension group switching, or field filtering operations on the chart, the comparison configuration will be adjusted according to the field changes. The specific adjustment rules are as follows.
Drill-down
When you perform a drill-down operation, the comparison feature will change to the corresponding granularity. For example, when you drill down from 2021 to quarters of 2021, the year-to-year comparison automatically changes to quarter-to-quarter comparison.
If you encounter non-comparison granularity fields such as "region", "hour", "minute", or "second" during the drill-down process (that is, when there is no date field in the chart), the comparison type will remain the same as the upper level.
The specific rules are as follows: After drilling down, the periodicity-valued comparison changes to the corresponding granularity's periodicity-valued comparison, and the interval-valued comparison remains as interval-valued comparison.
|
First layer granularity |
Configured comparison |
Drill-down granularity and corresponding comparison |
|||
|
Quarter |
Month |
Week |
Day |
||
|
Year |
Compare (Year to Year) |
Compare (Quarter to Quarter) |
Compare (Month to Month) |
Compare (Week to Week) |
Compare (Day to Day) |
|
Quarter |
Compare (Quarter to Quarter) |
/ |
Compare (Month to Month) |
Compare (Week to Week) |
Compare (Day to Day) |
|
Compare (of Last Year) |
/ |
Compare (of Last Year) |
|||
|
Month |
Compare (Month to Month) |
/ |
/ |
Compare (Week to Week) |
Compare (Day to Day) |
|
Compare (of Last Year) |
/ |
/ |
Compare (of Last Year) |
||
|
Week |
Compare (Week to Week) |
/ |
/ |
/ |
Compare (Day to Day) |
|
Compare (of Last Year) |
/ |
/ |
/ |
Compare (of Last Year) |
|
Dimension Group Switching
When you configure dimension groups in a chart and switch dimensions, the comparison calculation will follow the granularity change. For example, when you switch the date dimension group from year to quarter, the year-to-year comparison will automatically switch to quarter-to-quarter comparison.
If the dimension group is switched to a non-date field or another date field, the comparison configuration remains unchanged. It needs to work with the filter conditions in the filter bar. Otherwise, it returns empty values.
The specific rules are as follows: The "-" in the table below indicates that there is no corresponding comparison configuration. When switching, the comparison will be canceled, and only basic data will be displayed (if it is a secondary indicator, the secondary indicator will be cleared).
|
Month-over-Month/Year-over-Year |
Comparison configuration granularity |
Comparison |
Granularity after switching dimension group |
||||
|
Year |
Quarter |
Month |
Week |
Day |
|||
|
Month-over-Month |
Year |
Compare (Year to Year) |
Compare (Year to Year) |
Compare (Quarter to Quarter) |
Compare (Month to Month) |
Compare (Week to Week) |
Compare (Day to Day) |
|
Quarter |
Compare (Quarter to Quarter) |
Compare (Year to Year) |
Compare (Quarter to Quarter) |
Compare (Month to Month) |
Compare (Week to Week) |
Compare (Day to Day) |
|
|
Month |
Compare (Month to Month) |
Compare (Year to Year) |
Compare (Quarter to Quarter) |
Compare (Month to Month) |
Compare (Week to Week) |
Compare (Day to Day) |
|
|
Week |
Compare (Week to Week) |
Compare (Year to Year) |
Compare (Quarter to Quarter) |
Compare (Month to Month) |
Compare (Week to Week) |
Compare (Day to Day) |
|
|
Day |
Compare (Day to Day) |
Compare (Year to Year) |
Compare (Quarter to Quarter) |
Compare (Month to Month) |
Week-over-week |
Compare (Day to Day) |
|
|
Compare (of Last Year) |
Quarter |
Compare (of Last Year) |
- |
Compare (of Last Year) |
|||
|
Month |
Compare (of Last Year) |
- |
Compare (of Last Year) |
||||
|
Week |
Compare (of Last Year) |
- |
Compare (of Last Year) |
||||
|
Day |
Compare (of Last Year) |
- |
Compare (of Last Year) |
||||
|
Day |
Month-over-Month Comparison |
- |
Year-over-Year |
||||
|
Day |
Week-over-week |
- |
Compare (of Last Week) |
||||
Field Filtering
When you filter fields in the Selected Fields of the chart, the system will find the date field with the smallest granularity after filtering and set the corresponding comparison calculation. For example, if there are date fields of year, quarter, month, week, and day granularities, the comparison is currently set to day-to-day comparison. After filtering out the day granularity field, the chart will automatically display week-to-week comparison.
If there is no comparison date field in the chart after field filtering (all granularities are filtered out): The comparison configuration remains unchanged. It needs to work with the filter conditions in the filter bar. Otherwise, it returns empty values.
The specific rules are the same as those for dimension group switching.
Locate the Cause of no Comparison Result
-
Method 1: Make sure that the dataset contains data for the date for comparison. For example, if the dataset contains only data for 2020 but not for 2019, the year-on-year comparison result is displayed as -.
-
Method 2: Make sure that the date field that you specified in the filter bar is of the same granularity as the date field that you selected for comparison. For example, the two date fields are of the month granularity. If one date field is of the year granularity and the other is of the month granularity, no data is obtained.
-
Method 3: If no date field is configured in the data configuration, you must configure a date field for the filter bar that is associated with the chart and for the custom comparison. Otherwise, the comparison result cannot be obtained.