This topic answers frequently asked questions (FAQs) about online prediction services.
Service deployment and abnormal status
After you deploy a service, you can view the status, logs, and events of its service instances in the Service Instances list on the Overview page to identify issues.
Q: The service remains in the Waiting state for a long time. How do I resolve this?
After deployment, a service enters the Waiting state while it waits for resource scheduling and service instance startup. When all service instances have successfully started, the service enters the Running state. Possible causes include the following:
This issue usually occurs because the dedicated resource group has insufficient idle resources, which prevents instances from being scheduled. The following figure shows an example:
In this case, check whether the machine nodes in the dedicated resource group have enough idle resources, including CPU, Memory, and GPU. If an instance requires 3 CPU cores and 4 GB of memory, at least one machine node in the dedicated resource group must have at least 3 idle CPU cores and 4 GB of idle memory.
To prevent system failures during high-load periods, each machine node reserves one CPU core for system components. The schedulable resources are the total resources of the node minus the reserved core.
The following figure shows the node list of a dedicated resource group. For more information about how to view resource group details, see Use EAS resource groups.
The number before the forward slash (/) indicates the number of successfully started containers. The number after the forward slash (/) indicates the total number of containers. When you deploy a service using a custom image, a sidecar container is automatically injected into the instance for tasks such as traffic shaping and monitoring data collection. You do not need to manage this container. In the console, the total number of containers is 2, which includes your custom container and the engine's sidecar container. In this case, the service instance can receive traffic only after both containers are in the Ready state.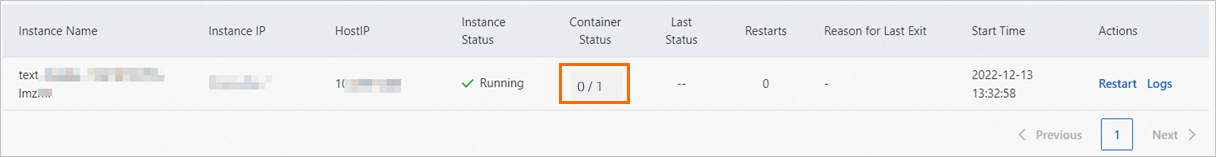
Problem description: An EAS service is deployed that uses a web framework, such as Flask, FastAPI, Sanic, or Django, to provide an API. The log shows Running on http://127.0.0.1:7000:
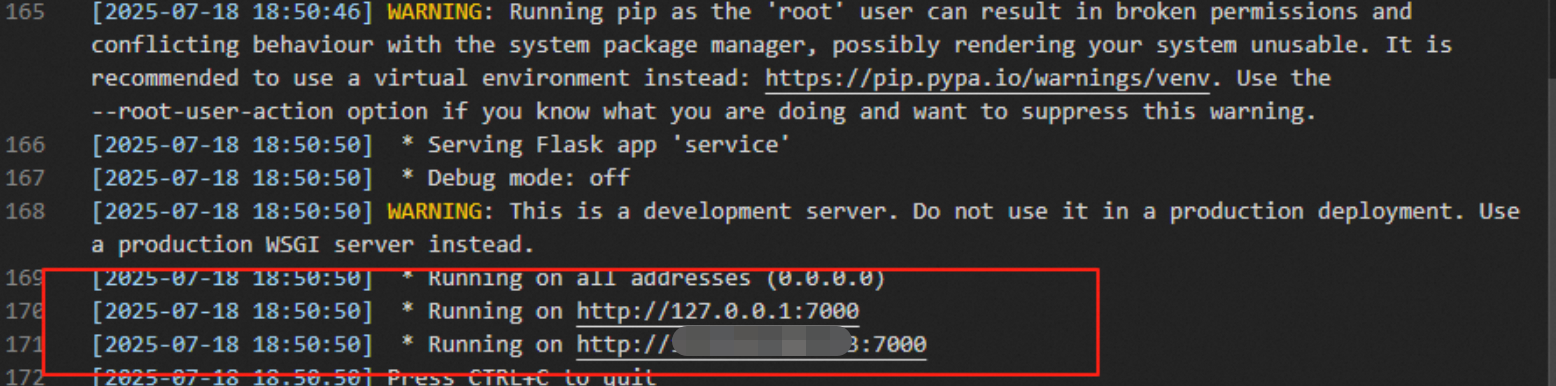
However, the PAI console shows that the EAS service is still in the Waiting state:

Cause: The health check for the EAS service worker failed. EAS expects the service to be exposed on port 8089, but the Flask application is providing services on port 7000.

Solution: Modify the port number configured for the EAS service to match the port in the code, and then restart the service.
Q: The service is in the Failed state. How do I resolve this?
A service enters the Failed state in the following two scenarios:
During service deployment: If a specified resource, such as a model path, does not exist, the deployment fails. The cause of the error is displayed in the service's status information, which you can use to identify the reason for the failure.
During service startup: The service fails to start after it is deployed and scheduled onto a resource. In this case, the status message
Instance <network-test-5ff76448fd-h9dsn> not healthy: Instance crashed, please inspect instance log.appears.This status message indicates that a service instance failed to start. You must check the status of the failed instance in the Service Instances list on the service's Overview page to determine the specific cause. The following are possible causes of the instance failure:
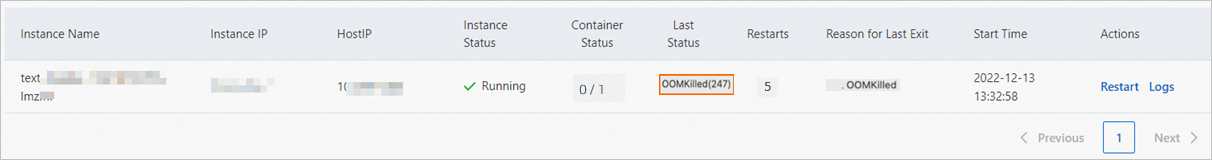
The service instance was terminated by the system due to an out-of-memory (OOM) error during startup. In this case, you must increase the memory that is allocated to the service and redeploy the service. The following figure shows the instance status:
A service may crash because of a code error during startup. If this happens, the Last Status is Error and an error code is displayed. Click the Log button in the Actions column for the instance to check the service logs and identify the cause of the failure. The following figure shows the instance status:

The service image failed to be pulled. For more information, see Q: What do I do if an image fails to be pulled (ImagePullBackOff)?.
Q: What do I do if an image fails to be pulled (ImagePullBackOff)?
If you see ImagePullBackOff as the Last Exit Reason in the service instance list, it likely means the image pull failed. If the following icon appears in the Status column, you can click it to view the specific cause.

Common causes for image pull failures include the following:
Failure cause | Possible error | Solution |
Insufficient system disk space |
| |
ACR access control not configured |
| If you use the public endpoint of the image, you need to enable public access for ACR. If you use the internal endpoint of the image:
|
EAS network configuration issue |
| If you use the public endpoint of the image, you need to configure Internet access for EAS. |
Missing or incorrect authentication information |
| If an ACR Enterprise Edition instance is not configured for public anonymous pulls and you pull the image from another region over the Internet, you must configure the username and password for the image repository during deployment. For more information about how to obtain the credentials, see Configure access credentials. |
Follow these recommendations based on the regions of your image repository and EAS service:
Same region: Use the internal URL to pull the image.
Different regions: For ACR Personal Edition, you must use the public image URL. For ACR Enterprise Edition, choose one of the following options:
If you have high requirements for security and stability, use the internal image URL. You must connect the VPCs using Cloud Enterprise Network (CEN). For more information, see Access an ACR Enterprise Edition instance from a different region or an IDC.
If your business scenario is simple or you cannot immediately connect the internal networks, use the public image URL as a temporary solution. Keep in mind that downloads over the Internet are slower.
Note the following about ACR Enterprise Edition instances:
Configure access control for VPCs and the Internet as needed.
If a repository does not allow anonymous image pulls, you must provide the username and password for the image repository in EAS when you pull an image from a different region over the Internet.
Q: The EAS service automatically restarts after being stopped
Problem description: An EAS service automatically restarts some time after it is stopped.
Cause:
This occurs because Auto Scaling is configured for the service, and the minimum number of instances is set to 0. After a period with no traffic, the number of instances is automatically scaled in to 0. If a request arrives when no instances are available, a scale-out is automatically triggered, even if the configured scale-out metric threshold is not met.
You can determine whether a scale-out was automatically triggered based on the auto scaling description in the deployment events.
Solution:
If you no longer need the service, you can delete it.
If you do not want to delete the service, you can manually stop it by clicking Stop in the console or by calling the
StopServiceAPI operation. A manually stopped service is not automatically scaled out by incoming traffic.If you do not want the service to be automatically stopped due to elastic scaling, do not set the minimum number of instances to 0.
You can also disable Auto Scaling as needed to prevent unexpected traffic from triggering a scale-out.
Q: PAI-EAS startup error: IoError(Os { code: 28, kind: StorageFull, message: "No space left on device" })
Problem description:
PAI-EAS reports the following error upon startup:
[2024-10-21 20:59:33] serialize_file(_flatten(tensors), filename, metadata=metadata)
[2024-10-21 20:59:33] safetensors_rust.SafetensorError: Error while serializing: IoError(Os { code: 28, kind: StorageFull, message: "No space left on device" })
[2024-10-21 20:59:35] time="2024-10-21T12:59:35Z" level=info msg="program stopped with status:exit status 1" program=/bin/sh
Cause: The system disk of the EAS instance is full because it contains too many model files, which prevents the service from starting properly.
Solution:
Solution 1: Expand the system disk for the EAS instance.
Solution 2: If the model files are too large, store them in external storage, such as OSS or NAS, and read them using storage mounts.
Q: Deployment error: fail to start program with error: fork/exec /bin/sh: exec format error
The exec format error indicates that the operating system cannot execute the target program file. The most common cause is that the CPU architecture of the executable file or container image is incompatible with the host system's architecture.
You can try switching to a different resource specification.
Q: Error: Invalid GPU count 6, only supported: [0 1 2 4 8 16]
To maximize communication efficiency between multiple GPUs, the number of GPUs specified for a single service instance must be a power of 2.
You can allocate 0, 1, 2, 4, 8, or 16 GPUs.
Resource issues
Resource usage and limits
Q: Why can't I select a 1-core, 2 GB resource configuration when deploying an EAS service?
To prevent issues, the 1-core, 2 GB resource specification is no longer available. EAS deploys system components on each machine node, and these components consume some machine resources. If the machine specification is too small, the proportion of resources occupied by system components is too high, which reduces the proportion of resources available for your service.
Q: What is the maximum number of services that can be deployed in EAS?
The maximum number of service instances that you can deploy in EAS depends on the available resources. You can view the resource usage in the machine list of the resource group in the console. For more information, see Use EAS resource groups.
If you allocate instances based on the number of CPU cores, the maximum number of instances that you can deploy is (Total number of CPU cores on the node - 1) / Number of cores used by each instance.
Q: What EAS specification has computing power similar to a 4090 graphics card?
The ecs.gn8ia-2x.8xlarge specification has performance similar to a 4090 graphics card.
Q: What is the maximum concurrency for a deployed model with a specific resource configuration?
The maximum concurrency of a model service depends on multiple factors, such as the model, scenario, and resource configuration. For more information, see Automatic stress testing.
Dedicated resource group management
Q: The dedicated resource group is always scaling out
This is usually because resources are insufficient in the current region. For subscription-based machine instances, if the creation fails due to insufficient resources, the system automatically creates a refund order. The paid amount is returned to your account.
Q: How do I delete a subscription instance from a dedicated resource group?
Go to the Alibaba Cloud Unsubscribe page to unsubscribe from unused subscription-based EAS dedicated machines. On the page, perform the following steps:
Set Type to Partial Refund.
Set Product Name to EAS Dedicated Machine Subscription.
Click Search to find the resource you want to unsubscribe from. Then, click Unsubscribe Resource in the Actions column and follow the instructions in the console to complete the process.
Q: Will service instance data be retained after I unsubscribe from an EAS resource group machine?
No, service instance data is not retained.
System disk management
Q: How do I expand the system disk?
You can configure or expand the system disk for a service in one of the following two ways:
Console configuration: When you create or update a service, go to , and set the System Disk size.

JSON configuration: In the service's JSON configuration file, modify the
diskvalue under themetadatafield."metadata": {"disk": "40Gi"}
If you use a dedicated resource group, the configured system disk size cannot exceed the system disk size of the node. If you need a larger system disk, you must release the current node and purchase a new one with a larger system disk specification.
Service updates and scaling
Q: What are the scaling policies for EAS?
You can choose a scaling policy based on your business needs: horizontal auto-scaling or scheduled scaling.
If you choose horizontal auto-scaling, you can configure it based on custom metrics, such as queries per second (QPS) or CPU utilization. For information about how to calculate and configure these metrics, see Horizontal auto-scaling.
To prevent frequent scaling due to metric fluctuations, the system applies a 10% tolerance range to the threshold. For example, if you set the QPS threshold to 10, a scale-out is typically triggered only when the QPS is consistently above 11 (10 × 1.1). This means:
If the QPS briefly fluctuates between 10 and 11, the system may not scale out immediately.
A scale-out is triggered only when the QPS is consistently stable at 11 to 12 or higher.
This mechanism helps reduce unnecessary resource changes, improving system stability and cost-effectiveness.
Q: Where are the scaled-out instances?
If you use a dedicated resource group and have configured an elastic resource pool, the service scales out using public resources when no node resources are available in the dedicated resource group.
Q: How do I smoothly update a service?
Problem description: You need to ensure that the service is not interrupted during an update. If dedicated resources are insufficient, the service should temporarily use public resources to complete the update. After the update, the instances should be rescheduled back to the dedicated resource group.
Solution: You need to use a combination of rolling updates, high-priority resource descheduling, and an elastic resource pool.
Configure rolling updates: This ensures that the service is not interrupted. Configure a rolling update policy under . For more information, see Rolling updates and graceful exit.
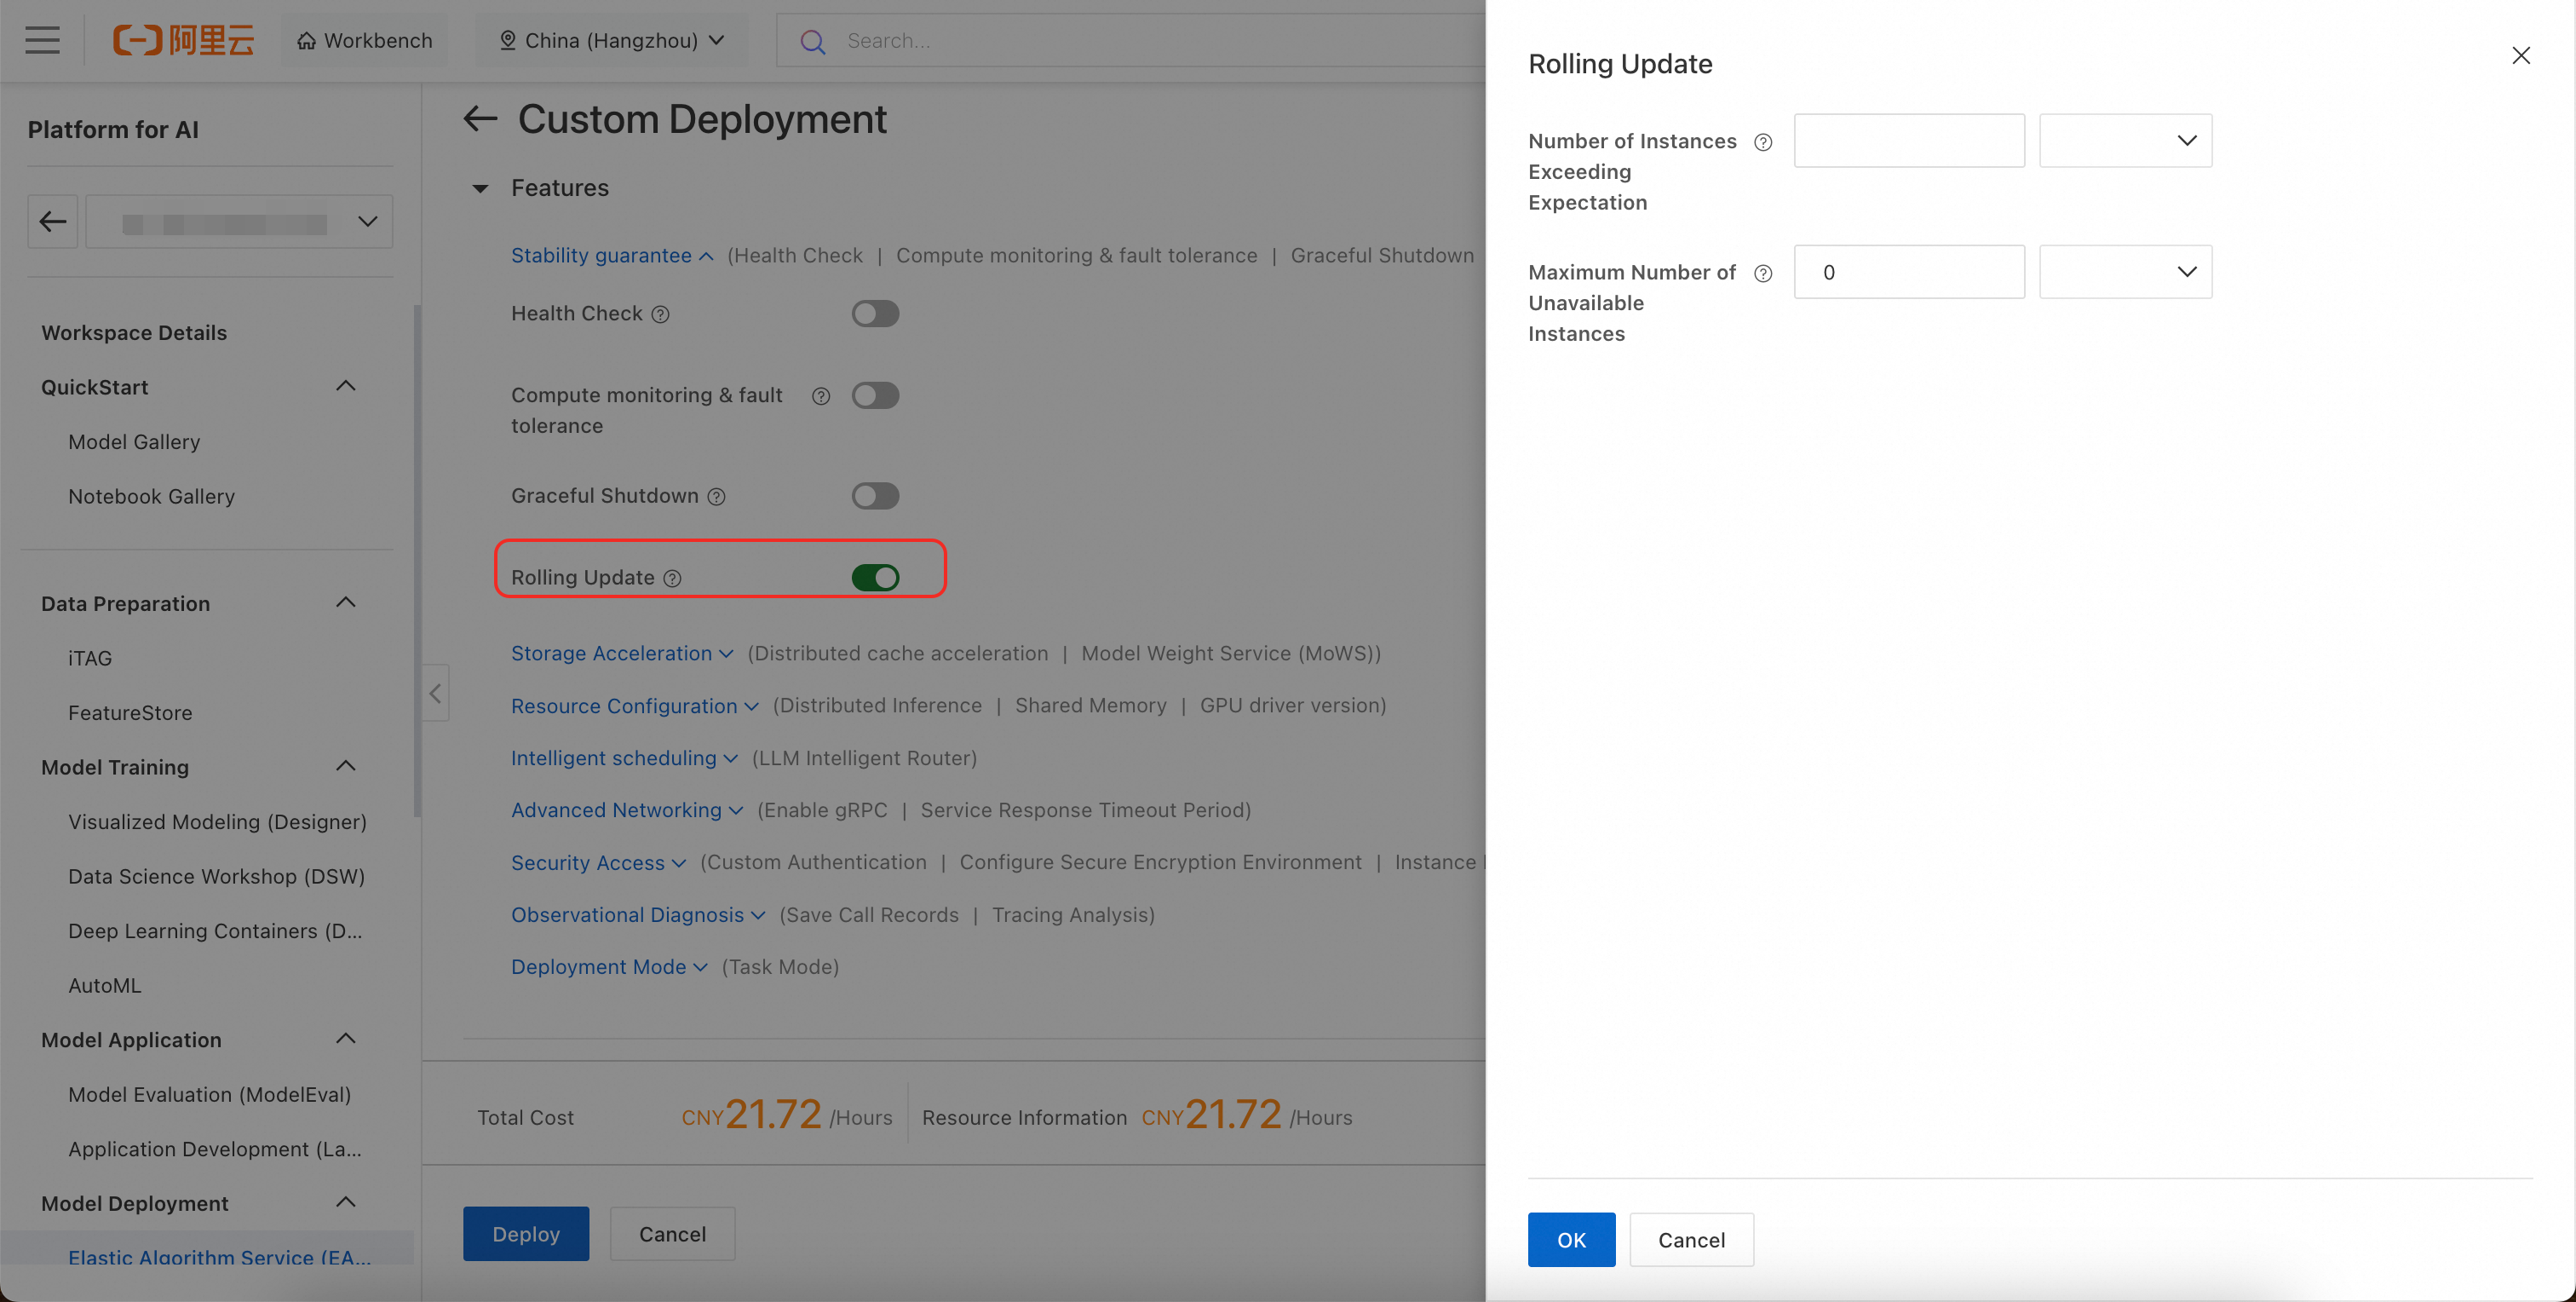
Enable the elastic resource pool: This allows excess instances to be deployed to a pay-as-you-go public resource group when the dedicated resource group has insufficient resources. For more information, see Elastic resource pools.
Enable high-priority resource descheduling: When space becomes available in the dedicated resource group (for example, when old instances are destroyed), the system automatically schedules instances from the public resource group back to the dedicated resource group to save costs.
Service invocation issues
Service invocation errors
Troubleshoot based on the returned status code. For more information, see Appendix: Service status codes and common errors.
HTTPS and custom domain names
Q: Does the service support HTTPS calls?
Yes. You can simply replace http:// with https:// in the service endpoint for encrypted transmission. If the client, such as Python requests, reports an SSL certificate validation error, the cause is usually a client-side environment configuration issue, not an issue with the EAS service itself.
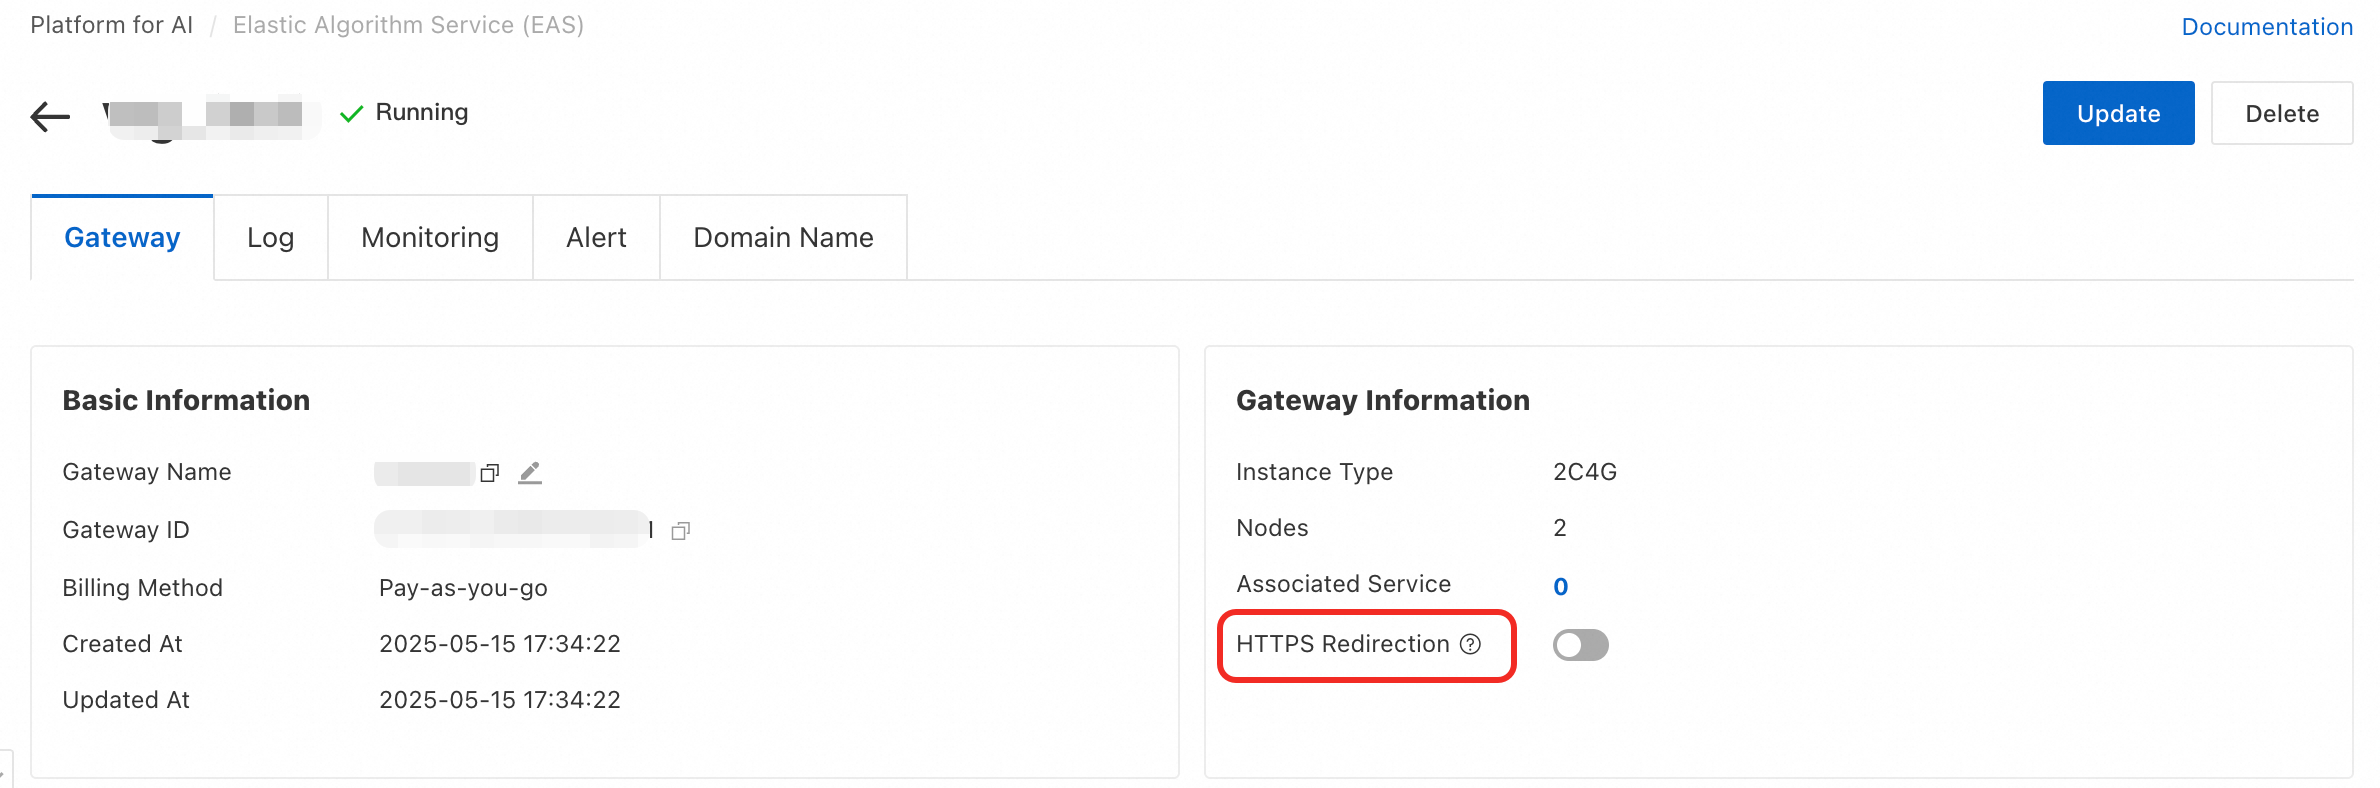
Q: How do I force HTTPS access?
Shared gateway: Does not support forced HTTPS.
Dedicated gateway: Supports forced HTTPS. You can enable HTTPS Redirection in the dedicated gateway configuration. After you enable it, all HTTP requests are automatically redirected to HTTPS.
Q: Can I use a custom domain name for invocation?
Yes. You need to create and use a fully managed dedicated gateway and configure your custom domain name in the gateway. For more information, see Use a dedicated gateway.
Token management
Q: Does the token expire or change?
No. The Token generated after a service is deployed is long-lived. Restarting, updating, or scaling the service does not change the token, unless you manually change the authentication method. It becomes invalid only when you manually reset the token or delete the service.
Q: Can I create multiple tokens for one service?
No. An EAS service supports only one authentication Token. To implement multi-user permission management or separate metering, we recommend that you use more flexible solutions, such as Alibaba Cloud RAM authentication.
Other invocation issues
Q: How do I enable streaming responses (Streaming) for an LLM service?
The EAS service itself does not provide a global switch for streaming. You must explicitly specify that you want streaming output in the request body of each API call. For example, when you call an LLM service that is compatible with the OpenAI format, add "stream": true to the JSON request body.
Q: What is the difference between VPC endpoint invocation and VPC direct connection?
VPC endpoint invocation: This method uses an internal-facing SLB and a gateway (a public endpoint uses an Internet-facing SLB and a gateway). This is the standard request model. In this model, requests are forwarded through Layer 4 of the SLB and Layer 7 of the gateway to reach the service instance. In high-traffic and high-concurrency scenarios, this forwarding causes some performance overhead. The gateway also has a bandwidth limit, which is 1 Gbps by default.
VPC direct connection: EAS provides a high-speed direct connection access mode that addresses performance and extensibility issues at no extra cost. After you enable VPC direct connection, a network path is established between your VPC and the EAS service VPC. Your requests use the service discovery feature provided by EAS to locate the service and then initiate load-balanced requests from the client. This process requires you to use the SDK provided by EAS and set endpoint_type to DIRECT.
For example, in the scenario described in Python SDK usage instructions, you can add the following line of code to switch from gateway invocation to direct connection:
client = PredictClient('http://pai-eas-vpc.cn-hangzhou.aliyuncs.com', 'mnist_saved_model_example')
client.set_token('M2FhNjJlZDBmMzBmMzE4NjFiNzZhMmUxY2IxZjkyMDczNzAzYjFi****')
client.set_endpoint_type(ENDPOINT_TYPE_DIRECT) # Direct link
client.init()
Permissions and network
Q: Why can't a RAM user automatically create or delete the EAS service-linked role?
Only users with specified permissions can automatically create or delete AliyunServiceRoleForPaiEas. Therefore, if a RAM user cannot automatically create or delete AliyunServiceRoleForPaiEas, you must grant the required access policy to the RAM user. The procedure is as follows:
Create a custom policy using the following policy script. For more information, see Create a custom permission policy.
Grant the custom policy that you created in the previous step to the target RAM user. For more information, see Manage the permissions of a RAM user.
Q: How does an EAS service access the Internet from within the service?
By default, an EAS service cannot access the public Internet. To access the public Internet, you must configure a VPC with Internet access capabilities for the EAS service. For more information, see Access public or private resources from EAS.
Service management
Q: Does an EAS instance support SSH logon?
No. As a managed service, EAS does not provide SSH permissions to access the container. To execute specific commands when the container starts, you can specify them in the Run Command field of the service configuration.
Q: What are the EAS service statuses?
EAS services can have the following statuses. You can also go to the Elastic Algorithm Service (EAS) page and view the Service Status column.
Creating: The service is being created.
Waiting: The service is waiting for instances to start.
Stopped: The service is stopped.
Failed: The service has failed.
Updating: The service is being updated. Instances will be updated.
Stopping: The service is being stopped.
HotUpdate: The service is being updated. This is a hot update, and instances are not updated.
Starting: The service is starting.
DeleteFailed: The service failed to be deleted.
Running: The service is running.
Scaling: The service is being updated, and instances are being scaled.
Pending: The service is waiting for a specific action.
Deleting: The service is being deleted.
Completed: The task is complete.
Preparing
Q: How do I check which RAM user created a service?
You can query events in the ActionTrail console. Set the event name to CreateService. For more information, see Query events in the ActionTrail console.
Q: Can I download official EAS images from the Internet?
No. PAI official images are internal platform images. You can use them only on the PAI platform. You cannot download them from outside the platform's containers.
Others
Q: Why can't I select an OSS bucket when deploying an EAS service?
When you deploy an EAS service, you can configure models and code using mounts. Make sure that the OSS bucket and NAS file system you use are in the same region as the EAS service. Otherwise, you cannot select them.
Q: TensorFlow issues
For more information, see TensorFlow FAQ.