This topic describes the status codes and common errors returned when you call a service.
Status code descriptions
|
Status code |
Description |
|
200 |
The service processed the request successfully. |
|
400 |
The Request Body format is incorrect or an exception occurred in the custom processor code. Note
If your custom processor code throws an exception, the server returns a 400 status code. To differentiate this from other errors, configure your custom processor to return a specific status code for exceptions. |
|
401 |
Service authentication failed. For more information, see 401 Authorization Failed. |
|
404 |
Service not found. For more information, see 404 Not Found. |
|
405 |
Method not allowed. For example, the server returns a 405 error if you send a POST request to a server that only supports GET requests. Try using a different HTTP method. |
|
408 |
The request timed out. The server has a default timeout of 5 seconds for each request. You can configure this by setting the Note
The total processing time for a single request includes the Processor's computation time, the time to receive network data packets, and any time spent waiting in a queue. |
|
429 |
The request triggered rate limiting.
|
|
450 |
|
|
499 |
The client closed the connection. When a client actively closes a connection, it does not receive the 499 status code. Instead, the server logs any unprocessed requests from that connection with a 499 status code. For example, if a client has an HTTP timeout of 30 ms and the server-side processing latency is 50 ms, the client abandons the request after 30 ms and closes the connection. A 499 status code then appears in the server-side monitoring. |
|
500 |
Internal server error. The server encountered an unexpected condition that prevented it from fulfilling the request. |
|
501 |
Not Implemented. The server does not support the functionality required to fulfill the request. |
|
502 |
Bad Gateway. The server, while acting as a gateway or proxy, received an invalid response from an upstream server. |
|
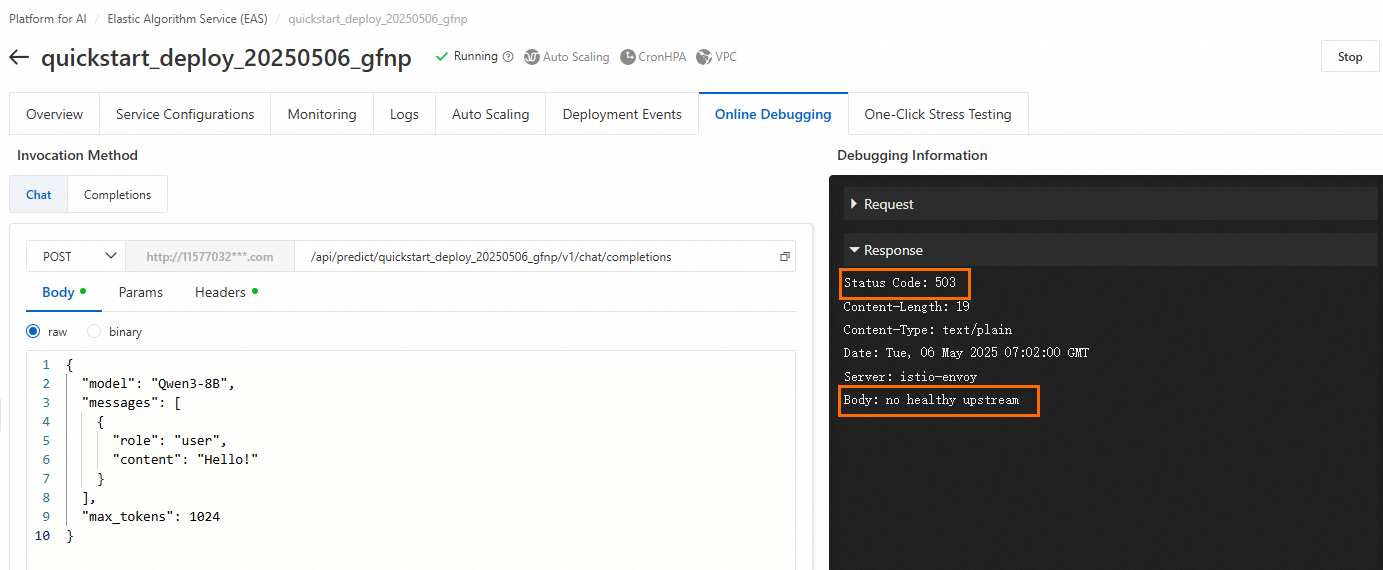
503 |
Service Unavailable. When you access a service through a gateway, if all backend service instances are not in a ready state, the gateway returns a 503 status code. For more information, see 503 no healthy upstream. |
|
504 |
Gateway Timeout. For more information, see 504 timeout. |
|
505 |
HTTP Version Not Supported. The server does not support the HTTP protocol version used in the request. |
SDK invocation error codes
When using the official EAS SDK to call a service, the SDK can generate its own error codes, which may differ from those the server returns. Always refer to the error codes in the gateway and service logs as the source of truth.
|
Status code |
Description |
|
512 |
When using the EAS Golang SDK, if the client actively disconnects, the SDK returns a 512 error code. This client-side timeout corresponds to a 499 Status Code on the server-side. |
Common errors
404 Not Found
A 404 error typically indicates an invalid request path, an incorrect request body, or an API that the service does not support. Use the following scenarios to troubleshoot based on the specific error message you receive.
Error type 1: {"object":"error","message":"The model `` does not exist.","type":"NotFoundError","param":null,"code":404}
Cause: The model parameter in the request body is empty or invalid when calling the /v1/chat/completions endpoint of a service deployed with vLLM.

Solution: The value of the model parameter must be a valid model name. Query for valid model names by using the v1/models endpoint.
Error type 2: {"detail":"Not Found"}
Cause: The request path is incomplete or incorrect. For example, when calling an LLM service's chat endpoint, you did not append the v1/chat/completions path to the base URL.

Solution: Ensure that the API request path is complete and correct. For LLM services, see LLM service invocation.
Error type 3: Calling the /v1/models endpoint of BladeLLM returns 404: Not Found.
Cause: The service deployed with BladeLLM does not support the v1/models endpoint.

Solution: For a list of supported APIs, see BladeLLM service invocation parameter configurations.
Error type 4: The online debugging page returns a 404 error with no other information.
Cause: The request path is incorrect. When you use online debugging, the base URL is typically http://123***.cn-hangzhou.pai-eas.aliyuncs.com/predict/service_name. Incorrectly modifying or deleting the service name part of the URL results in a 404 error.

Solution: When you use online debugging, you typically do not need to modify or delete the default URL. Append the specific API path you need to call.
Error type 5: An API call to ComfyUI returns "404 not found page".
400 Bad Request
The format of the request body is incorrect. Carefully check the request body format, such as the JSON structure, field names, and data types.
401 Authorization Failed
The authentication token is missing, incorrect, or used improperly. Check the following:
-
Check if the token is correct. On the service Overview page, click View Invocation Information in the Basic Information section.
NoteBy default, the service automatically generates the authentication token. You can also specify a custom token and update it during service updates.
-
Check if the token is set correctly.
-
If you use the
curlcommand, add the token to theAuthorizationfield in the HTTP header. For example:curl -H 'Authorization: NWMyN2UzNjBiZmI2YT***' http:// xxx.cn-shanghai.aliyuncs.com/api/predict/echo. -
If you use an SDK to access the service, call the corresponding
SetToken()function. For more information, see Instructions for using the Java SDK.
-
504 timeout
The server, acting as a gateway or proxy, did not receive a timely response from an upstream server. This usually means that the model inference is taking too long. To resolve this issue:
-
In your client code, increase the HTTP request timeout.
-
For long-running tasks, use the EAS Queue Service (Asynchronous Invocation) mode, which is designed to handle batch or long-running inference tasks.
450: Request discarded because the queue is full
When a server-side compute instance receives a request, it first places the request in a queue. When a worker in the instance becomes available, it retrieves data from the queue for processing. The default number of workers is 5, which you can adjust by using the metadata.rpc.worker_threads field in the create a serviceJSON file. If worker processing time is too long, requests can build up in the queue. When the queue is full, the instance immediately rejects new requests with a 450 Status Code to prevent excessive queueing from increasing latency and making the service unavailable. The default queue length is 64, which you can adjust by using the metadata.rpc.max_queue_size field in the create a service JSON file.
Limiting the queue length also acts as a form of rate limiting to prevent traffic spikes from causing a service cascade failure.
Solutions:
-
If you receive a small number of 450 status codes, you can retry the request. Because server-side instances are independent, a retry might be routed to a less busy instance, making the issue transparent to the client. However, do not retry indefinitely, as this would defeat the purpose of the rate-limiting protection.
-
If all requests return a 450 status code, it might indicate that the code inside the processor is stuck. If all workers deadlock while processing requests and are no longer retrieving data from the queue, you need to debug the processor's code to find the bug.
503 no healthy upstream
You receive a 503 error with the message "no healthy upstream" during online debugging:
Troubleshoot the issue as follows:
-
Check the instance status. If the instance has stopped, Restart Service.
-
If the service status is Running, the instance might have insufficient resources, such as CPU, memory, or GPU memory, which leads to a lack of buffer space.
-
If you are using public resources, try making the call again during off-peak hours, or switch to a different resource specification or region.
-
If you are using a dedicated resource (EAS Resource Group), ensure that the resource group has reserved enough CPU, memory, and GPU memory for the instance. We recommend leaving at least 20% of resources free as a buffer.
-
-
Another common scenario is that the service status is Running and all instances are Ready after deployment. However, a request triggers a bug in the code, which causes the backend service instance to crash and become unresponsive. In this situation, the gateway returns a 503 Status Code to the client. To identify and fix the bug, use the logs.
Error: Unexpected token 12606 while expecting start token 200006
When you use vllm to deploy gpt-oss, service calls might return the following error:

Solution: Try deploying with SGLang acceleration.
curl invocation error: no URL specified
You receive a no URL specified error after you send a request with the following command:
curl -X http://17****.cn-hangzhou.pai-eas.aliyuncs.com/api/predict/service_name/**path** \
-H "Content-Type: application/json" \
-H "Authorization: **********==" \
-d '{"***":"****"}'Cause: The curl command uses the -X flag but is missing the method, such as POST.
Invocation returns ASCII encoding
Modify your code as follows:
from flask import Flask, Response

@app.route('/hello', methods=['POST'])
def get_advice():
    result = "result"
    return Response(result, mimetype='text/plain', charset='utf-8')
How to resolve "[WARN] connection is closed: End of file" or "Write a Invalid stream: End of file" in service logs?
This warning log indicates that the client or server closed the connection, and the server was attempting to write a response back to that closed connection. A connection can be closed in two ways:
-
Server-side timeout: In Processor mode, the default server-side timeout is 5 seconds. You can change this by using the service's
metadata.rpc.keepaliveparameter. When the timeout is reached, the server closes the connection and records a 408 status code in its monitoring. -
Client-side timeout: Your calling code's settings determine the client-side timeout. If the client does not receive an HTTP response within its configured timeout period, it actively closes the connection. The server then records a 499 status code in its monitoring.
upstream connect error or disconnect/reset before headers. reset reason: connection termination
Issues such as a persistent connection timeout or imbalanced instance loads typically cause this error. If the server-side processing time exceeds the HTTP timeout configured on the client, the client abandons the request and actively closes the connection. A 499 status code then appears in the server-side monitoring. You can check the monitoring metrics for further confirmation. For time-consuming inference tasks, deploy an asynchronous inference service.
How to resolve online debugging failures for services deployed with a Tensorflow/Pytorch processor?
For performance reasons, TensorFlow/PyTorch Processors use a non-plaintext protobuf format for the request body. Online debugging currently supports only plaintext text input. Therefore, you cannot debug services deployed with these processors directly in the console. Use the provided EAS SDKs to call the service. For information about SDKs in different languages, see Service Invocation SDKs.