DataWorks allows you to create a data quality monitoring node and add monitoring rules to the node to monitor the data quality of a specific table of a data source. For example, you can use the data quality monitoring node to check whether dirty data exists. You can also configure a custom scheduling policy for the data quality monitoring node to periodically run the node to check data. This topic describes how to create and use a data quality monitoring node to monitor the data quality of a table.
Background information
To ensure data quality, DataWorks Data Quality detects changes in source data and tracks dirty data that is generated during the extract, transform, load (ETL) process. DataWorks Data Quality automatically blocks the running of tasks that involve dirty data to effectively stop the spread of dirty data to descendant tasks. This way, you can prevent tasks from producing unexpected dirty data that affects the smooth running of tasks and business decision-making. This also helps you reduce the time for troubleshooting issues and prevents the waste of resources caused by rerunning tasks. For more information, see Data Quality overview.
Limits
Supported data source types: MaxCompute, E-MapReduce (EMR), Hologres, Cloudera's Distribution Including Apache Hadoop (CDH) Hive, AnalyticDB for PostgreSQL, AnalyticDB for MySQL, and StarRocks.
Scope of tables that can be monitored:
You can monitor only the tables of a data source that is added to the workspace to which the current data quality monitoring node belongs.
Each data quality monitoring node can monitor the data quality of only one table. However, you can add multiple monitoring rules to a data quality monitoring node. The monitoring scope varies based on the table type.
Non-partitioned table: By default, all data in the table is monitored.
Partitioned table: You must specify a partition filter expression to determine the partition whose data quality you want to monitor.
NoteIf you want to monitor the data quality of multiple tables, create multiple data quality monitoring nodes.
Supported operations:
After you create data quality monitoring rules in Data Studio, you can run, modify, and publish the monitoring rules or perform other management operations on the monitoring rules only in Data Studio. In DataWorks Data Quality, you can view the monitoring rules but cannot trigger the monitoring rules to periodically run or perform management operations on them.
If you modify the monitoring rules configured in a data quality monitoring node and deploy the node, the original monitoring rules are replaced.
Prerequisites
The required computing resource is associated with the workspace. The table whose data quality you want to monitor is created in the computing resource.
Before you run a data quality monitoring node, you must create a table whose data quality you want to monitor. For more information, see Associate a computing resource and Node development.
A resource group is created.
You can run data quality monitoring nodes only by using a serverless resource group. For more information, see Resource group management.
(Required if you use a RAM user to develop tasks) The RAM user is added to the DataWorks workspace as a member and is assigned the Development or Workspace Administrator role. The Workspace Administrator role has extensive permissions. We recommend that you assign the Workspace Administrator role to a user only when necessary. For more information about how to add a member and assign roles to the member, see Add members to a workspace.
Step 1: Create a data quality monitoring node
Go to the Workspaces page in the DataWorks console. In the top navigation bar, select a desired region. Find the desired workspace and choose in the Actions column.
In the left-side navigation pane of the Data Studio page, click the
 icon. In the Workspace Directories section of the DATA STUDIO pane, click the
  icon and choose . In the Create Node dialog box, configure the Path and Name parameters and click OK.
Step 2: Configure data quality monitoring rules
1. Select a table whose data quality you want to monitor
In the Monitoring Rules section of the configuration tab of the node, click Add Table. In the Add Table panel, select the table whose data quality you want to monitor. You can click More and specify the filter conditions to quickly locate the desired table.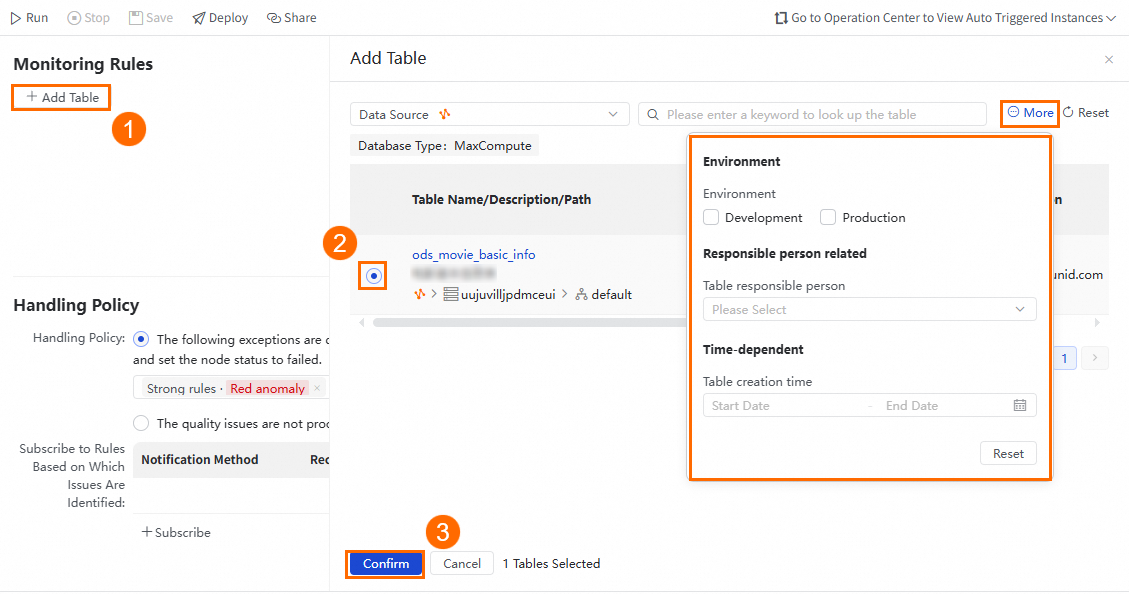
If the desired table is not displayed, you can go to Data Map and manually refresh the metadata of the table.
2. Configure the range of data that you want to monitor
Non-partitioned table: By default, all data in a table is monitored. If your table is a non-partitioned table, you can skip this configuration.
Partitioned table: If your table is a partitioned table, you must select the partition whose data quality you want to monitor. You can use scheduling parameters to specify the partition. You can click Preview to check whether the calculation result of the partition filter expression that you specified meets your expectations.
3. Configure data quality monitoring rules
You can create a monitoring rule or import an existing monitoring rule. By default, the configured rules are enabled.
DataWorks provides the Copilot-based rule recommendation feature for you to create data quality monitoring rules for a data quality monitoring node. The feature can automatically generate data quality monitoring rules based on the information of the table. You can accept or reject the monitoring rules based on your business requirements.
DataWorks Copilot Code Programming Assistant is available for public preview only in specific regions. If DataWorks Copilot is unavailable in the region where your workspace resides, you can refer to the following information to import existing or create data quality monitoring rules.
Create a monitoring rule
Click Create Rule to create a monitoring rule based on a template or a custom SQL statement.
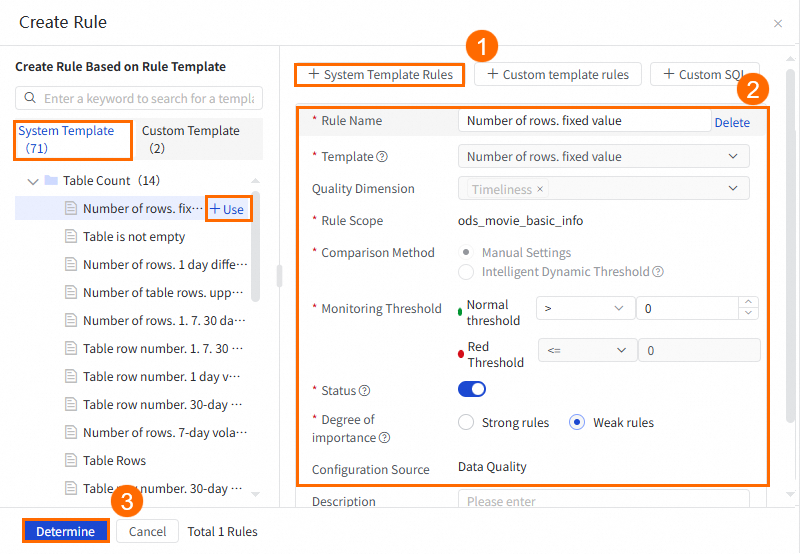
Method 1: Create a monitoring rule based on a built-in rule template
DataWorks provides various built-in rule templates that you can use to create a data quality monitoring rule. The following figure shows the procedure.
NoteYou can also find the desired template in the built-in rule template list on the left side of the Create Rule panel and click + Use to create a monitoring rule.
Method 2: Create a monitoring rule based on a custom rule template
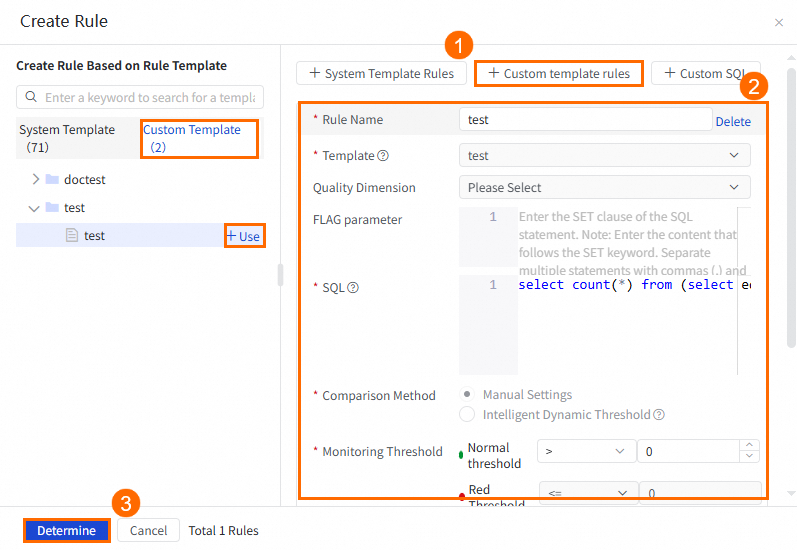
Before you use this method, you must perform the following steps to create a custom rule template: Go to the Data Quality page. In the left-side navigation pane, choose . In the Custom Template Category section of the Templates page, click the plus icon to create a custom rule template. Then, you can create a monitoring rule based on the rule template. For more information, see Create and manage custom rule templates.
The following figure shows how to create a monitoring rule based on a custom rule template.
NoteYou can also find the desired template in the custom rule template list on the left side of the Create Rule panel and click + Use to create a monitoring rule.
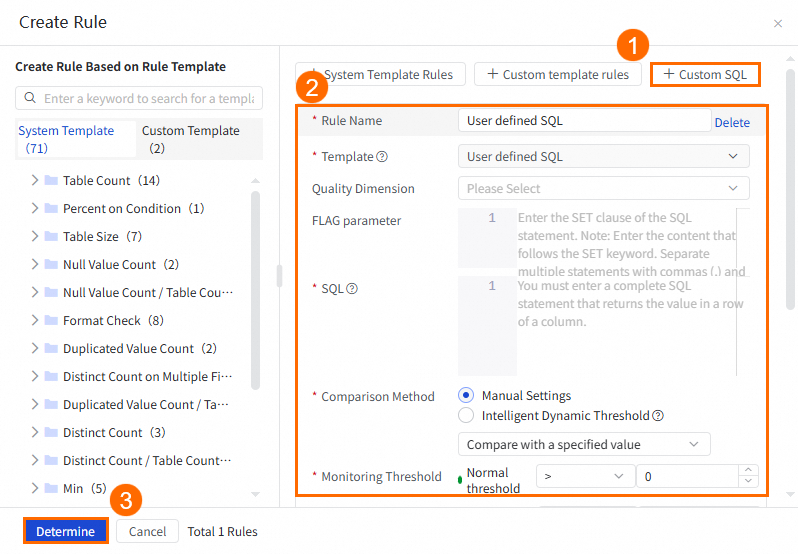
Method 3: Create a monitoring rule based on a custom SQL statement
This method allows you to configure custom data quality check logic for tables.
Import an existing monitoring rule
If you already created monitoring rules for the selected table in Data Quality, you can import the rules to clone the rules. If you did not create monitoring rules for the table, you can create monitoring rules for the table in Data Quality. For more information, see Configure rules: By table (single table).
NoteYou can import multiple rules at a time and configure monitoring rules for fields in a table.
Click Import Rule. In the Batch Import panel, you can specify filter conditions, such as the rule ID or name, rule template, and association range, to search for and select the rules that you want to import. The association range specifies the range of data that you want to monitor, which can be the entire table or specific fields in the table.
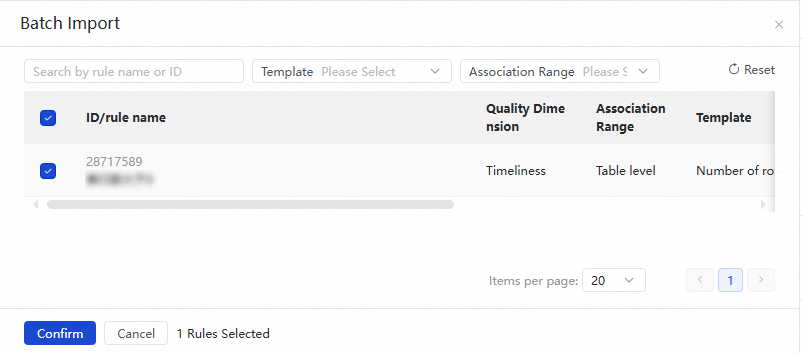
If you add and configure monitoring rules in a data quality monitoring node, after you publish the node, you can view the details of the monitoring rules in Data Quality. However, you cannot perform management operations on the rules, such as modifying or deleting the rules.
4. Configure runtime resources
Select the resources required to run the rules. This means that you must select the data source in which you want to run the related data quality monitoring node. By default, the data source to which the monitored table belongs is selected.
If you select another data source, make sure that the data source can access the table that you want to monitor.
Step 3: Configure a handling policy for the check result
In the Handling Policy section of the configuration tab of the data quality monitoring node, configure a handling policy and a subscription method for the exception that is identified based on the monitoring rule.
Exception categories
Exception category | Description |
Strong rule - Check failed |
|
Strong rule - Critical threshold exceeded | |
Strong rule - Warning threshold exceeded | |
Weak rule - Check failed | |
Weak rule - Critical threshold exceeded | |
Weak rule - Warning threshold exceeded |
Handling policies for exceptions
You can configure a policy to handle the exceptions that are identified based on the monitoring rules.
Do not ignore: Stop the current node and set the node status to Failed when a specific exception is identified on the node. For example, you can use this policy to handle the exception that the critical threshold of a strong monitoring rule is exceeded.
NoteIf the current node fails to run, the nodes that depend on the current node do not run. This blocks the production link and prevents the spread of dirty data.
You can add multiple exception categories for detection.
You can use this policy when an exception has a large impact and blocks the running of descendant nodes.
Ignore: Ignore the exception and continue to run the descendant nodes.
Subscription method for exceptions
You can specify a method to receive information about exceptions, such as by email. When an exception is identified, DataWorks pushes information about the exception by using the specified method. This way, the related personnel can handle the exception at the earliest opportunity.
DataWorks supports multiple methods to receive information about exceptions. You can view the methods in the DataWorks console. Take note of the following items:
If you use the email, email and text message, or phone call method, you can configure only the user to which the current account belongs as the recipient. Make sure that the email address or mobile phone number of the related user is correctly configured. For more information, see View and set alert contacts.
If you use other methods, specify the webhook URL used to receive the exception information. For information about how to obtain a webhook URL, see Obtain a webhook URL.
Step 4: Configure scheduling properties for the node
If you want to periodically run the created data quality monitoring node, click Properties in the right-side navigation pane of the configuration tab of the node and configure the scheduling properties for the node based on your business requirements. For more information, see Node scheduling configuration.
Step 5: Debug the data quality monitoring node
You can perform the following operations to check whether the node is configured as expected based on your business requirements:
Optional. Select a resource group and assign scheduling parameters to variables.
In the right-side navigation pane of the configuration tab of the data quality monitoring node, click Run Configuration. On the Debugging Configurations tab, configure a resource group for scheduling.
If you configure scheduling parameters for the node, assign values to the scheduling parameters in the Script Parameters section for debugging. For information about the value assignment logic of scheduling parameters, see Task debugging process.
Save and run the node.
In the top toolbar of the configuration tab, click the
 icon to save the node and the
  icon to run the node.
 After node running is complete, you can view the running result in the lower part of the configuration tab of the node. If the node fails to run, troubleshoot the issue based on the reported error.
Step 6: Deploy the data quality monitoring node
After the configuration of the node is complete, you must deploy the node. After the node is deployed, the system periodically runs the node based on the scheduling properties of the node.
When you deploy the node, the monitoring rules configured in the node are also deployed.
In the top toolbar of the configuration tab of the node, click the
 icon to save the node.
 In the top toolbar, click the
 icon to deploy the node.
For more information about how to deploy a node, see Node and workflow deployment.
What to do next
Perform O&M on the node: After you deploy the node, the node is periodically run based on the configurations. To view the scheduling status of the node, such as the node running status and the details of triggered monitoring rules, you can click O&M in the upper-right corner of the configuration tab of the node to go to Operation Center. For more information, see Manage auto triggered tasks.
Monitor data quality: After the data quality monitoring rule is published, you can go to the Data Quality page to view the details of the rule. However, you cannot perform management operations on the rule, such as modifying or deleting the rule. For more information, see Data Quality.