Insufficient memory in Tair (Redis OSS-compatible) may cause issues such as frequently evicted keys, increased response time, and an unstable number of queries per second (QPS). These issues may interrupt your workloads. If an instance is out of memory or if you receive a memory alert for the instance, you can refer to this topic to determine whether the memory usage is consistently high, whether the memory usage suddenly increases, or whether memory usage skew occurs. You can also resolve the issue by using strategies such as splitting large keys, setting expiration policies, and upgrading specifications.
Symptoms of high memory usage
High memory usage can manifest in the following three scenarios:
The memory usage remains high for a long period of time. If the memory usage exceeds 95%, you must respond in a timely manner.
The memory usage is consistently low but suddenly spikes to a high level, even reaching 100%.
The overall memory usage of the instance is low, but the memory usage of a specific data node is close to 100%.
Take appropriate measures to reduce the memory usage based on the specific scenario.
Solutions to consistently high memory usage
Check whether the existing keys meet business requirements and delete unnecessary keys in a timely manner.
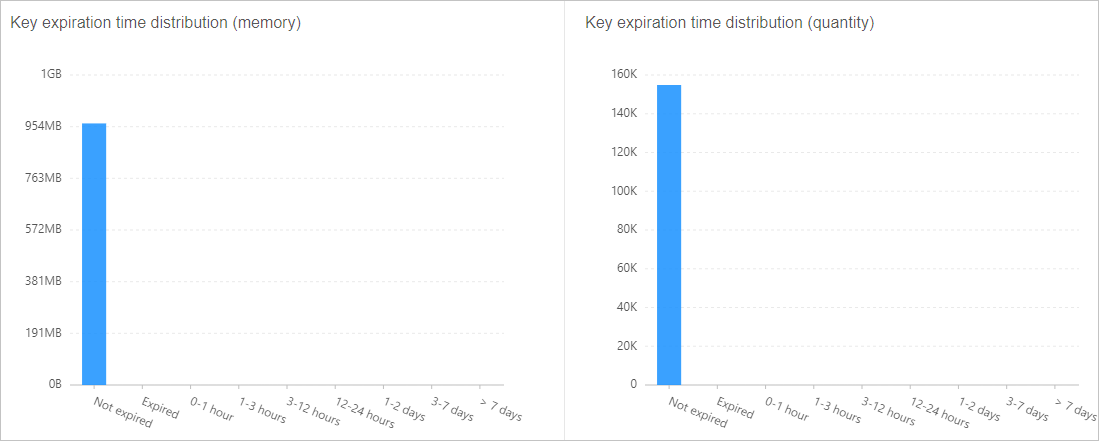
Use the cache analytics feature to analyze the distribution of large keys and the time-to-live (TTL) of keys. For more information, see Use the offline key analysis feature.
Check whether proper TTL values are configured for keys.
NoteIn the following example, no TTL values are configured for keys. We recommend that you configure proper TTL values on your client based on your business requirements.
Figure 4. Key TTL distribution example
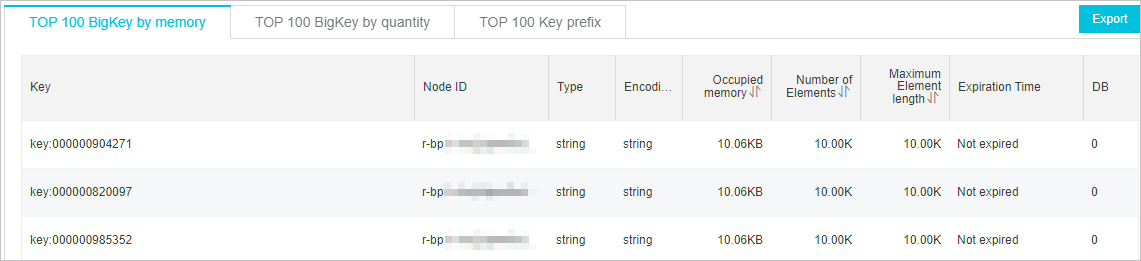
Evaluate large keys and split large keys on the client.
Figure 5. Large key analysis example
Configure a proper eviction policy or modify the value of the maxmemory-policy parameter based on your business requirements. For more information, see Configure instance parameters.
Notevolatile-lru is the default eviction policy of Tair (Redis OSS-compatible). For more information, see How does Tair (Redis OSS-compatible) evict data by default?
Set the frequency of deleting expired keys to a proper value or modify the value of the hz parameter based on your business requirements. For more information, see Adjust the frequency of background tasks.
NoteWe recommend that you set the hz parameter to a value that is smaller than 100. If this value is large, CPU utilization is affected. You can also configure dynamic frequency control for instances whose major version is 5.0 or later. For more information, see Enable dynamic frequency control for background tasks.
If the memory usage is still high after you perform the preceding steps, consider upgrading the instance to a larger memory size to accommodate more data and improve overall performance. For more information, see Change the configurations of an instance.
NoteBefore you upgrade your instance, you can purchase a pay-as-you-go instance to test whether the specifications to which you want to upgrade meet the requirements of your workloads. You can release the pay-as-you-go instance after you complete the test. For more information, see Release pay-as-you-go instances.
Solutions to sudden increase in memory usage
Causes
The memory usage may suddenly increase due to the following reasons:
A large amount of new data is written in a short period of time.
A large number of new connections are established in a short period of time.
Burst access generates a large amount of traffic that exceeds the network bandwidth, resulting in a backlog in the input and output buffers.
The client cannot keep up with the processing speed of Tair (Redis OSS-compatible), resulting in a backlog in the output buffer.
Solutions
Identify the causes of the sudden increase in memory usage and use the suggested solutions to resolve the issue.
Check whether a large amount of new data is written
Troubleshooting method:
On the Performance Monitor page, check the inbound traffic and write queries per second (QPS) of the instance. If the inbound traffic and write QPS follow the same trend as the memory usage, the sudden increase in memory usage is caused by a large amount of written data.
Solution:
Configure appropriate time-to-live (TTL) values for keys to automatically delete keys that are no longer needed, or manually delete unnecessary keys.
Upgrade the instance specifications by increasing the memory capacity to mitigate the sudden increase in memory usage. For more information, see Change the configurations of an instance.
If your instance is a standard instance and the memory usage remains high after you increase the memory capacity, you can upgrade the instance to a cluster instance. This way, you can distribute data across multiple data shards to reduce the memory pressure on individual data shards. For more information, see Change the configurations of an instance.
Check whether a large number of new connections are created
Troubleshooting method:
On the Performance Monitor page, view the number of connections to the instance. If the number of connections suddenly increases and follows the same trend as the memory usage, the sudden increase in memory usage is caused by a large number of new connections.
Solution:
Check whether connection leaks exist.
Configure connection timeout periods to automatically close idle connections. For more information, see Specify a timeout period for client connections.
Check whether sudden traffic spikes lead to backlog in the input and output buffers
Troubleshooting method:
Check whether the inbound and outbound traffic usage of the instance reaches 100%.
Run the
MEMORY STATScommand to check whether clients.normal occupies an excessive amount of memory.Noteclients.normal reflects the total amount of memory that is used by the input and output buffers for all normal client connections.
Solution:
Check the cause of traffic burst.
Increase the network bandwidth of the instance. For more information, see Manually increase the bandwidth of an instance and Enable bandwidth auto scaling.
Upgrade the instance specifications to ensure optimal usage of the input and output buffers. For more information, see Change the configurations of an instance.
Check whether client-side performance issues lead to backlog in the output buffer
Troubleshooting method:
In redis-cli, run the MEMORY DOCTOR command to view the value of big_client_buf. If big_client_buf is set to 1, at least one client has a large output buffer that consumes a significant amount of memory.
Solution:
Run the CLIENT LIST command to check which client has a large output buffer that consumes a significant amount of memory (omem). Check whether the client application has performance issues.
Solutions to high memory usage of specific data nodes
Symptoms
If the instance is a cluster instance, you may find that the memory usage of specific data shards is high based on the following symptoms:
You receive a memory usage alert from CloudMonitor. The alert message shows that the memory usage of a specific data node exceeds the threshold.
The instance diagnostic report shows that memory usage skew occurs.
On the Performance Monitor page, the overall memory usage of the instance is not high, but a specific data node has high memory usage.
Causes
If the memory usage of the instance is low but the memory usage of a data node is high, memory usage skew occurs.
Solutions
Check whether large keys exist and split large keys
Identify large keys
You can use the offline key analysis feature to identify large keys. For more information, see Use the offline key analysis feature.
For information about how to identify large keys, see Identify and handle large keys and hotkeys.
Split large keys
For example, you can split a HASH key that contains tens of thousands of members into multiple HASH keys that have the appropriate number of members. For cluster instances, you can split large keys to balance the memory usage across multiple data shards.
Check whether hash tags are used
If hash tags are used, consider splitting a hash tag into multiple hash tags based on your business requirements. This way, data is evenly distributed across different data nodes.
Upgrade instance specifications
Upgrading the instance specifications by increasing the memory allocated to each shard can serve as a temporary solution to prevent memory skew. For more information, see Change the configurations of an instance.
The system initiates a precheck for data skew during instance specification change. If the instance type that you select cannot handle the data skew issue, the system reports an error. Select an instance type that has higher specifications and try again.
After you upgrade the instance specifications, memory usage skew may be alleviated. However, skew may also occur on bandwidth and CPU resources.
Appendix 1: Memory usage of Tair (Redis OSS-compatible)
The memory usage of Tair (Redis OSS-compatible) is divided into three parts. The following table describes the memory usage.
Memory usage | Description |
Memory consumed by link-related operations | Includes the memory consumed by the input buffer, the memory consumed by the output buffer, the memory consumed by the JIT overhead, the memory consumed by the Fake Lua Link, and the memory consumed to cache the executed Lua scripts. The memory consumption dynamically changes. You can run the INFO command to obtain the client cache information from the Clients column in the output. Note The memory consumed by the input buffer and output buffer is small and varies based on the number of connections from each client. When a client initiates range-based operations or when a client sends and receives large keys at low speeds, the memory consumed by the input buffer and output buffer increases. As a result, the memory that can be used to store data decreases, and out of memory (OOM) issues may occur. |
Memory consumed by data | Includes the memory consumed to store field values. This part of memory consumption is a crucial object that needs to be analyzed. |
Memory consumed by management operations | Includes the memory consumed by hash sets, the memory consumed by the replication buffer, and the memory consumed by the append-only file (AOF) buffer. The memory consumption remains stable within the range of 32 MB to 64 MB, which is small. Note A large number of keys, such as hundreds of millions, consume large amounts of memory. |
Most OOM issues occur due to inefficient management of dynamically acquired and released memory. For example, if a large number of requests are piled up due to throttling, the amount of dynamically acquired memory rapidly increases. OOM issues may also occur due to complex or inappropriate Lua scripts. The management of dynamically acquired and freed memory is enhanced in Tair (Enterprise Edition). We recommend that you use Tair (Enterprise Edition). For more information, see Overview.
Appendix 2: Other methods to check memory usage
Use the MEMORY STATS command to view the memory usage
Use the MEMORY DOCTOR command to view memory diagnostic suggestions
In redis-cli, run the MEMORY DOCTOR command to obtain memory diagnostic suggestions.
Figure 3. Diagnostic result example 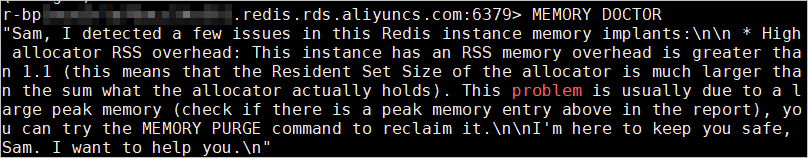
After you run the MEMORY DOCTOR command, the diagnostic suggestions for your instance are provided from the following dimensions. You can make optimization decisions based on the diagnostic suggestions.
    int empty = 0;     /* Instance is empty or almost empty. */
    int big_peak = 0;       /* Memory peak is much larger than used mem. */
    int high_frag = 0;      /* High fragmentation. */
    int high_alloc_frag = 0;/* High allocator fragmentation. */
    int high_proc_rss = 0;  /* High process rss overhead. */
    int high_alloc_rss = 0; /* High rss overhead. */
    int big_slave_buf = 0;  /* Slave buffers are too big. */
    int big_client_buf = 0; /* Client buffers are too big. */
    int many_scripts = 0;   /* Script cache has too many scripts. */