By Qikai Yang
In the current booming era of cloud-native observability, OpenTelemetry and Prometheus are well-known names. OpenTelemetry, an open-source project under CNCF (Cloud Native Computing Foundation), aims to become the industry standard for application performance monitoring in the cloud-native era. It provides a unified set of APIs and SDKs for generating, collecting, and processing telemetry data from distributed systems. In summary, OpenTelemetry sets the standard for observability and is language-independent, supporting various programming languages and frameworks while integrating with different observability platforms.
Prometheus is the most popular open-source monitoring system currently in use, adopted by widely-used cloud-native projects such as Kubernetes and Envoy. Although Prometheus has a powerful query language, its data format is specific to Prometheus and can only integrate with the Prometheus server, not other systems.
However, OpenTelemetry aims to establish a unified standard among traces, logs, and metrics. This results in a unified data format that offers sufficient flexibility and interactivity while being fully compatible with Prometheus. As a result, more developers and operations and maintenance personnel are attracted to using OpenTelemetry for carrying traces and logs, along with metrics. Through integration with the Prometheus ecosystem, OpenTelemetry enables enhanced observability and monitoring capabilities.

This article focuses on the construction of system observability, specifically the metric monitoring system. It compares the similarities and differences between OpenTelemetry and Prometheus and briefly provides personal opinions on choosing between the two. The article also explores how to connect OpenTelemetry metrics in applications to Prometheus and the underlying principles. Finally, it introduces Alibaba Cloud Managed Service for Prometheus and related practices. The goal of this article is to provide readers with a better understanding of the integration between OpenTelemetry and Prometheus within the ecosystem.
If you are an R&D and O&M personnel, you may be confused about whether to choose OpenTelemetry or Prometheus when performing system observation, especially when building a metric monitoring system. Before answering this question, we need to have a clear understanding of the differences between OpenTelemetry and Prometheus.
Before comparing, it is still necessary to give an in-depth introduction to the OpenTelemetry data model for metrics.
OpenTelemetry fragments metrics into three interacting models: the Event model, the Timeseries model, and the Metric Stream model. An Event model represents how instrumentation reports metric data. A Timeseries model represents how backends store metric data. A Metric Stream model defines the OpenTelemetry Protocol (OTLP) and represents how metric data streams are manipulated and transmitted between the Event model and the Timeseries storage. This is the model specified in this document.
The Event model is where the recording of data happens. Its foundation is made of Instruments[1], which are used to record data observations via events. These raw events are then transformed in some fashion before being sent to some other system. OpenTelemetry metrics are designed such that the same instruments and events can be used in different ways to generate metric streams.
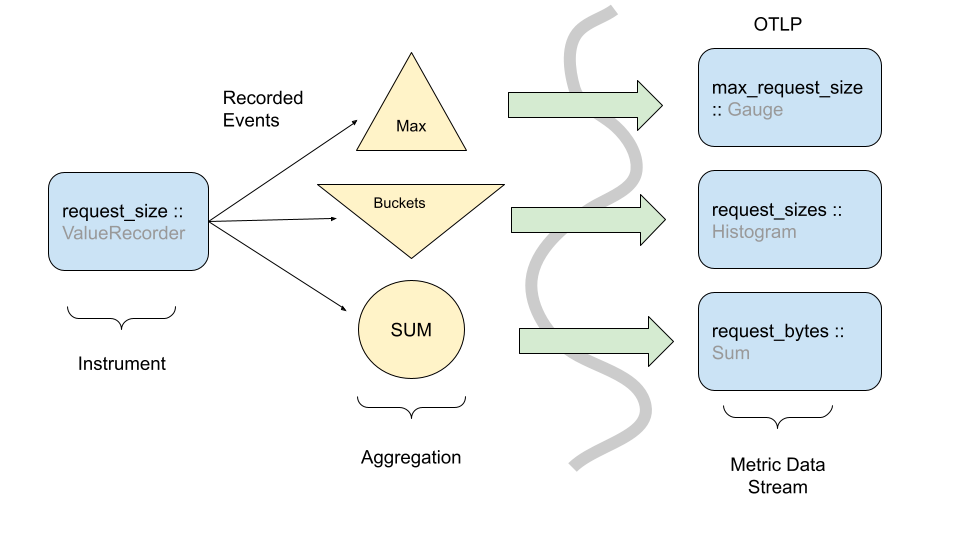
Even though observation events could be reported directly to a backend, in practice this would be infeasible due to the sheer volume of data used in observability systems, and the limited amount of network/CPU resources available for telemetry collection purposes. The best example of this is the Histogram metric where raw events are recorded in a compressed format rather than individual timeseries.
Note: The above diagram shows how one instrument can transform events into more than one type of metric stream.
In this low-level metrics data model, a Timeseries is defined by an entity consisting of several metadata properties:
The primary data of each timeseries are ordered (timestamp, value) points, with one of the following value types:
The OpenTelemetry protocol (OTLP) data model is composed of Metric data streams. These streams are in turn composed of metric data points. Metric data streams can be converted directly into Timeseries. Metric streams are grouped into individual Metric objects, identified by:
Including the name, the Metric object is defined by the following properties:
The data point type, unit, and intrinsic properties are considered identifying, whereas the description field is explicitly not identifying in nature. Extrinsic properties of specific points are not considered identifying; these include but are not limited to:
The Metric object contains individual streams, identified by the set of Attributes. Within the individual streams, points are identified by one or two timestamps, details vary by data point type.
Sums[2] in OTLP consist of the following:
A set of data points, each containing:
When the aggregation temporality is delta, we expect to have no overlap in time windows for metric streams. For example,
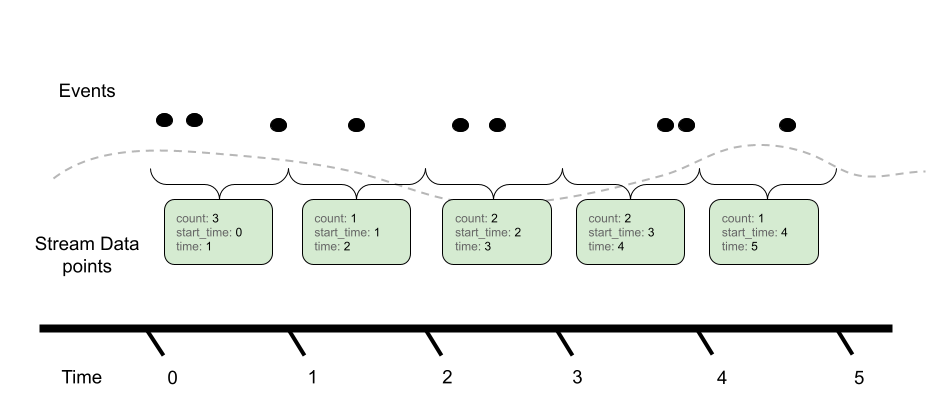
Contrast with cumulative aggregation temporality where we expect to report the full sum since start (usually start means a process/application start):
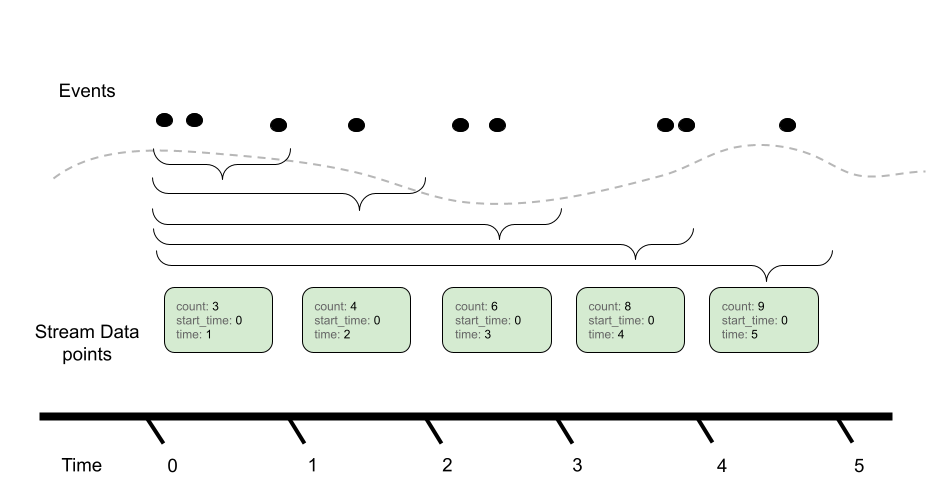
There are various tradeoffs between using Delta vs. Cumulative aggregation, in various use cases. For example,
OTLP supports both models, and allows APIs, SDKs and users to determine the best tradeoff for their use case.
A Gauge[5] in OTLP represents a sampled value at a given time. A Gauge stream consists of a set of data points, each containing:
In OTLP, a point within a Gauge stream represents the last-sampled event for a given time window.
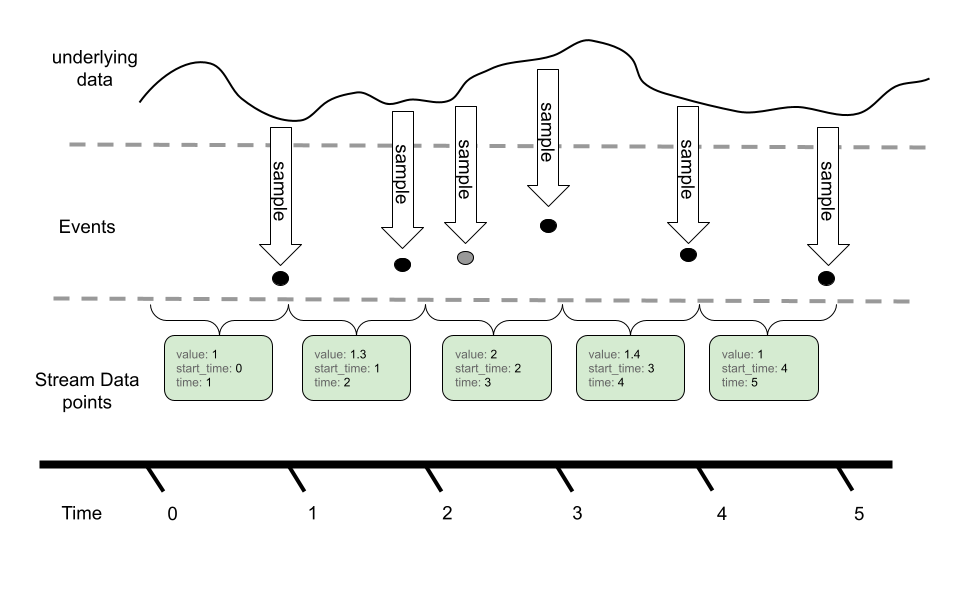
In this example, we can see an underlying timeseries we are sampling with our Gauge. While the event model can sample more than once for a given metric reporting interval, only the last value is reported in the metric stream via OTLP.
Gauges do not provide an aggregation semantic, instead “last sample value” is used when performing operations like temporal alignment or adjusting resolution. Gauges can be aggregated through transformation into histograms, or other metric types. These operations are not done by default, and require direct user configuration.
Histogram[6] metric data points convey a population of recorded measurements in a compressed format. A histogram divides a set of events into several populations and provides an overall event count and aggregate sum for all events.
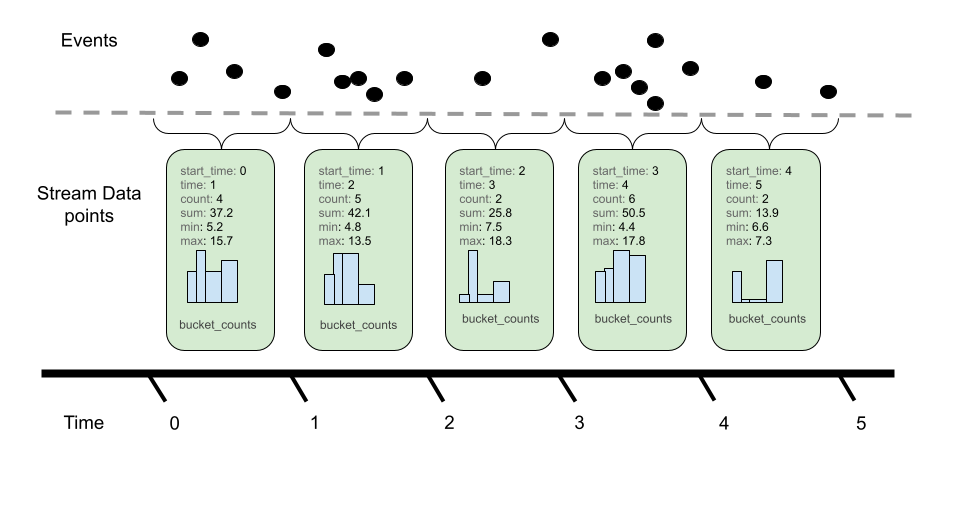
Histogram consists of the following:
Like Sums, Histograms also define an aggregation temporality. The picture above denotes Delta temporality where accumulated event counts are reset to zero after reporting and a new aggregation occurs. Cumulative continues to aggregate events, resetting with the use of a new start time. The aggregation temporality also has implications on the min and max fields. Min and max are more useful for Delta temporality, since the values represented by Cumulative min and max will stabilize as more events are recorded. Additionally, it is possible to convert min and max from Delta to Cumulative, but not from Cumulative to Delta. When converting from Cumulative to Delta, min and max can be dropped, or captured in an alternative representation such as a gauge.
Bucket counts are optional. A Histogram without buckets conveys a population only in terms of the sum and count, and may be interpreted as a histogram with a single bucket covering (-Inf, +Inf).
The following is sample data of a Cumulative Histogram:
2023-11-29T13:43:45.238Z  info  ResourceMetrics #0
Resource SchemaURL:
Resource attributes:
     -> service.name: Str(opentelemetry-metric-demo-delta-or-cumulative)
     -> service.version: Str(0.0.1)
     -> telemetry.sdk.language: Str(java)
     -> telemetry.sdk.name: Str(opentelemetry)
     -> telemetry.sdk.version: Str(1.29.0)
ScopeMetrics #0
ScopeMetrics SchemaURL:
InstrumentationScope aliyun
Metric #0
Descriptor:
     -> Name: cumulative_long_histogram
     -> Description: ot cumulative demo cumulative_long_histogram
     -> Unit: ms
     -> DataType: Histogram
     -> AggregationTemporality: Cumulative
HistogramDataPoints #0
StartTimestamp: 2023-11-29 13:43:15.181 +0000 UTC
Timestamp: 2023-11-29 13:43:45.182 +0000 UTC
Count: 2
Sum: 141.000000
Min: 62.000000
Max: 79.000000
ExplicitBounds #0: 0.000000
ExplicitBounds #1: 5.000000
ExplicitBounds #2: 10.000000
ExplicitBounds #3: 25.000000
ExplicitBounds #4: 50.000000
ExplicitBounds #5: 75.000000
ExplicitBounds #6: 100.000000
ExplicitBounds #7: 250.000000
ExplicitBounds #8: 500.000000
ExplicitBounds #9: 750.000000
ExplicitBounds #10: 1000.000000
ExplicitBounds #11: 2500.000000
ExplicitBounds #12: 5000.000000
ExplicitBounds #13: 7500.000000
ExplicitBounds #14: 10000.000000
Buckets #0, Count: 0
Buckets #1, Count: 0
Buckets #2, Count: 0
Buckets #3, Count: 0
Buckets #4, Count: 0
Buckets #5, Count: 1
Buckets #6, Count: 1
Buckets #7, Count: 0
Buckets #8, Count: 0
Buckets #9, Count: 0
Buckets #10, Count: 0
Buckets #11, Count: 0
Buckets #12, Count: 0
Buckets #13, Count: 0
Buckets #14, Count: 0
Buckets #15, Count: 0ExponentialHistogram data points are an alternate representation to the Histogram data point, used to convey a population of recorded measurements in a compressed format. ExponentialHistogram compresses bucket boundaries using an exponential formula, making it suitable for conveying high dynamic range data with small relative error, compared with alternative representations of similar size.
Statements about Histogram that refer to aggregation temporality, attributes, and timestamps, as well as the sum, count, min, max and exemplars fields, are the same for ExponentialHistogram. These fields all share the same interpretation as for Histogram, only the bucket structure differs between these two types. The following is a data format of a delta ExponentialHistogram:
2023-11-29T13:13:09.866Z  info  ResourceMetrics #0
Resource SchemaURL:
Resource attributes:
     -> service.name: Str(opentelemetry-metric-demo-delta-or-cumulative)
     -> service.version: Str(0.0.1)
     -> telemetry.sdk.language: Str(java)
     -> telemetry.sdk.name: Str(opentelemetry)
     -> telemetry.sdk.version: Str(1.29.0)
ScopeMetrics #0
ScopeMetrics SchemaURL:
InstrumentationScope aliyun
Metric #0
Descriptor:
     -> Name: cumulative_long_e_histogram
     -> Description: ot cumulative demo cumulative_long_e_histogram
     -> Unit: ms
     -> DataType: ExponentialHistogram
     -> AggregationTemporality: Cumulative
ExponentialHistogramDataPoints #0
StartTimestamp: 2023-11-29 13:11:54.858 +0000 UTC
Timestamp: 2023-11-29 13:13:09.86 +0000 UTC
Count: 3
Sum: 191.000000
Min: 15.000000
Max: 89.000000
Bucket (14.993341, 15.321652], Count: 1
Bucket (15.321652, 15.657153], Count: 0
Bucket (15.657153, 16.000000], Count: 0
Bucket (16.000000, 16.350354], Count: 0
Bucket (16.350354, 16.708381], Count: 0
Bucket (16.708381, 17.074246], Count: 0
Bucket (17.074246, 17.448124], Count: 0
Bucket (17.448124, 17.830188], Count: 0
Bucket (17.830188, 18.220618], Count: 0
Bucket (18.220618, 18.619598], Count: 0
Bucket (18.619598, 19.027314], Count: 0
Bucket (19.027314, 19.443958], Count: 0
Bucket (19.443958, 19.869725], Count: 0
Bucket (19.869725, 20.304815], Count: 0
Bucket (20.304815, 20.749433], Count: 0
Bucket (20.749433, 21.203786], Count: 0
Bucket (21.203786, 21.668089], Count: 0
Bucket (21.668089, 22.142558], Count: 0
Bucket (22.142558, 22.627417], Count: 0
Bucket (22.627417, 23.122893], Count: 0
Bucket (23.122893, 23.629218], Count: 0
Bucket (23.629218, 24.146631], Count: 0
Bucket (24.146631, 24.675373], Count: 0
Bucket (24.675373, 25.215694], Count: 0
Bucket (25.215694, 25.767845], Count: 0
Bucket (25.767845, 26.332088], Count: 0
Bucket (26.332088, 26.908685], Count: 0
Bucket (26.908685, 27.497909], Count: 0
Bucket (27.497909, 28.100035], Count: 0
Bucket (28.100035, 28.715345], Count: 0
Bucket (28.715345, 29.344129], Count: 0
Bucket (29.344129, 29.986682], Count: 0
Bucket (29.986682, 30.643305], Count: 0
Bucket (30.643305, 31.314306], Count: 0
Bucket (31.314306, 32.000000], Count: 0
Bucket (32.000000, 32.700709], Count: 0
Bucket (32.700709, 33.416761], Count: 0
Bucket (33.416761, 34.148493], Count: 0
Bucket (34.148493, 34.896247], Count: 0
Bucket (34.896247, 35.660376], Count: 0
Bucket (35.660376, 36.441236], Count: 0
Bucket (36.441236, 37.239195], Count: 0
Bucket (37.239195, 38.054628], Count: 0
Bucket (38.054628, 38.887916], Count: 0
Bucket (38.887916, 39.739450], Count: 0
Bucket (39.739450, 40.609631], Count: 0
Bucket (40.609631, 41.498866], Count: 0
Bucket (41.498866, 42.407573], Count: 0
Bucket (42.407573, 43.336178], Count: 0
Bucket (43.336178, 44.285116], Count: 0
Bucket (44.285116, 45.254834], Count: 0
Bucket (45.254834, 46.245786], Count: 0
Bucket (46.245786, 47.258437], Count: 0
Bucket (47.258437, 48.293262], Count: 0
Bucket (48.293262, 49.350746], Count: 0
Bucket (49.350746, 50.431387], Count: 0
Bucket (50.431387, 51.535691], Count: 0
Bucket (51.535691, 52.664175], Count: 0
Bucket (52.664175, 53.817371], Count: 0
Bucket (53.817371, 54.995818], Count: 0
Bucket (54.995818, 56.200069], Count: 0
Bucket (56.200069, 57.430690], Count: 0
Bucket (57.430690, 58.688259], Count: 0
Bucket (58.688259, 59.973364], Count: 0
Bucket (59.973364, 61.286610], Count: 0
Bucket (61.286610, 62.628612], Count: 0
Bucket (62.628612, 64.000000], Count: 0
Bucket (64.000000, 65.401418], Count: 0
Bucket (65.401418, 66.833522], Count: 0
Bucket (66.833522, 68.296986], Count: 0
Bucket (68.296986, 69.792495], Count: 0
Bucket (69.792495, 71.320752], Count: 0
Bucket (71.320752, 72.882473], Count: 0
Bucket (72.882473, 74.478391], Count: 0
Bucket (74.478391, 76.109255], Count: 0
Bucket (76.109255, 77.775831], Count: 0
Bucket (77.775831, 79.478900], Count: 0
Bucket (79.478900, 81.219261], Count: 0
Bucket (81.219261, 82.997731], Count: 0
Bucket (82.997731, 84.815145], Count: 0
Bucket (84.815145, 86.672355], Count: 0
Bucket (86.672355, 88.570232], Count: 1
Bucket (88.570232, 90.509668], Count: 1The resolution of the ExponentialHistogram is characterized by a parameter known as scale, with larger values of scale offering greater precision. Bucket boundaries of the ExponentialHistogram are located at integer powers of the base, also known as the "growth factor", where:
base = 2**(2**(-scale))The symbol ** in these formulas represents exponentiation, thus 2**x is read as Two to the power of x, typically computed by an expression like math.Pow(2.0, x). Calculated base values for selected scales are shown below:
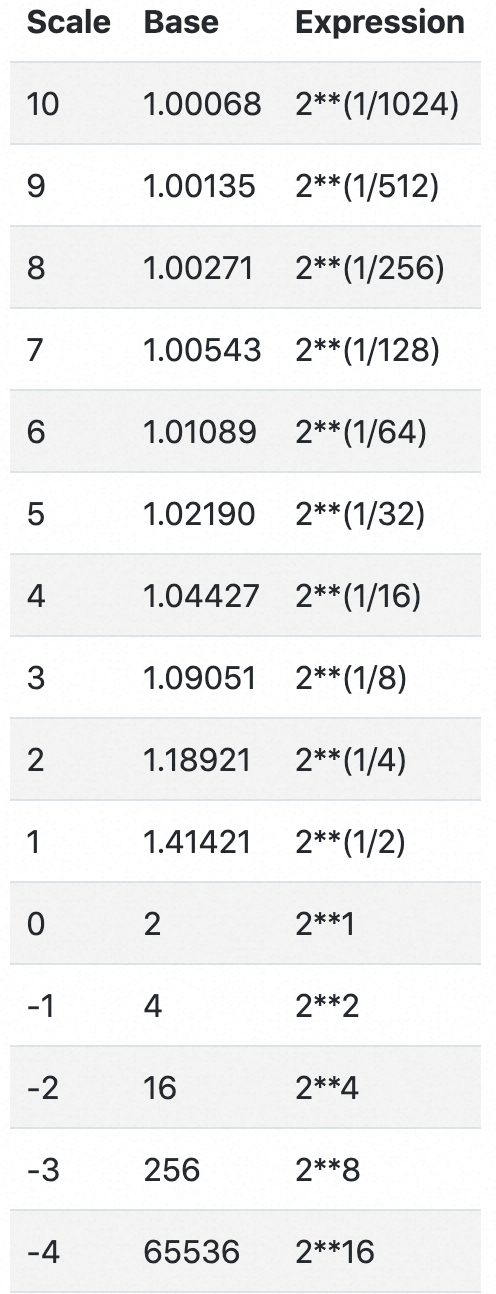
An important property of this design is described as perfect subsetting. Buckets of an exponential Histogram with a given scale map exactly into buckets of exponential Histograms with lesser scales, which allows consumers to lower the resolution of a histogram (i.e., downscale) without introducing error. The data of the preceding Delta ExponentialHistogram uses the default Base2ExponentialHistogramAggregation, where max scale is 20.
private static final int DEFAULT_MAX_BUCKETS = 160;
    private static final int DEFAULT_MAX_SCALE = 20;
    private static final Aggregation DEFAULT = new Base2ExponentialHistogramAggregation(160, 20);
    private final int maxBuckets;
    private final int maxScale;

    private Base2ExponentialHistogramAggregation(int maxBuckets, int maxScale) {
        this.maxBuckets = maxBuckets;
        this.maxScale = maxScale;
    }

    public static Aggregation getDefault() {
        return DEFAULT;
    }

    public static Aggregation create(int maxBuckets, int maxScale) {
        Utils.checkArgument(maxBuckets >= 1, "maxBuckets must be > 0");
        Utils.checkArgument(maxScale <= 20 && maxScale >= -10, "maxScale must be -10 <= x <= 20");
        return new Base2ExponentialHistogramAggregation(maxBuckets, maxScale);
} The ExponentialHistogram bucket identified by index, a signed integer, represents values in the population that are greater than baseindex and less than or equal to base(index+1). The positive and negative ranges of the histogram are expressed separately. Negative values are mapped by their absolute value into the negative range using the same scale as the positive range. Note that in the negative range, therefore, histogram buckets use lower-inclusive boundaries. Each range of the ExponentialHistogram data point uses a dense representation of the buckets, where a range of buckets is expressed as a single offset value, a signed integer, and an array of count values, where array element i represents the bucket count for bucket index offset+i.
For a given range, positive or negative:
(1, base]
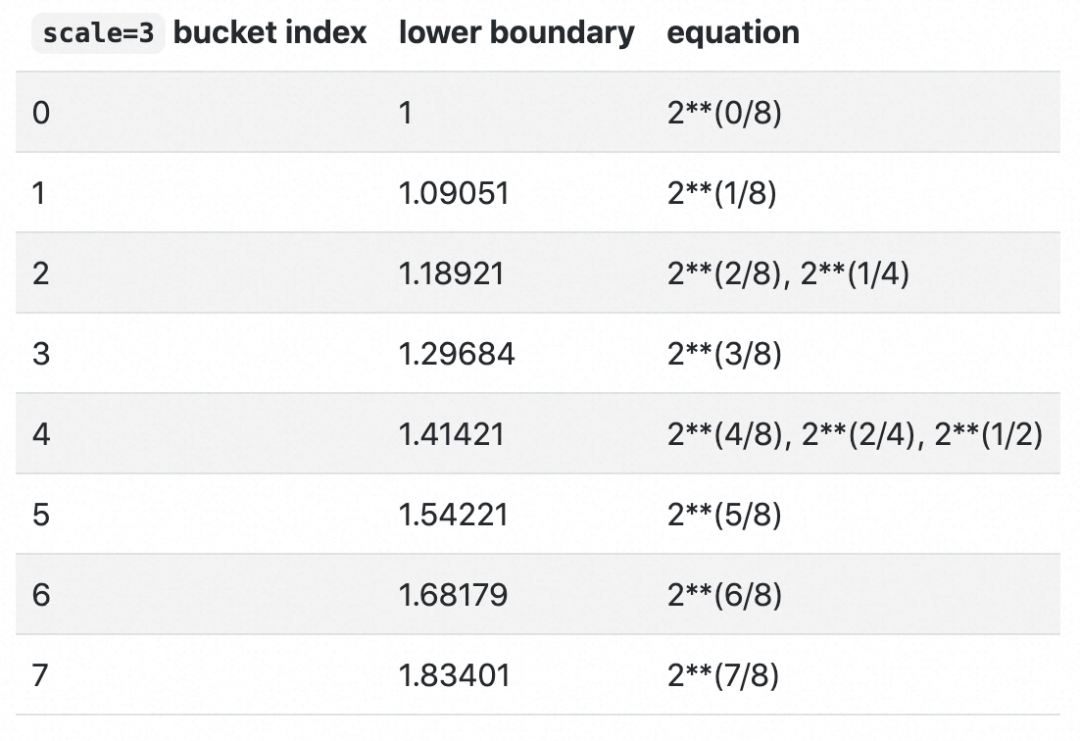
2**scale buckets between successive powers of 2For example, with scale=3 there are 2**3 buckets between 1 and 2. Note that the lower boundary for bucket index 4 in a scale=3 histogram maps into the lower boundary for bucket index 2 in a scale=2 histogram and maps into the lower boundary for bucket index 1 (i.e., the base) in a scale=1 histogram —these are examples of perfect subsetting.
Note: Summary is not recommended for new applications in the latest version, so this article will not introduce this point in detail.
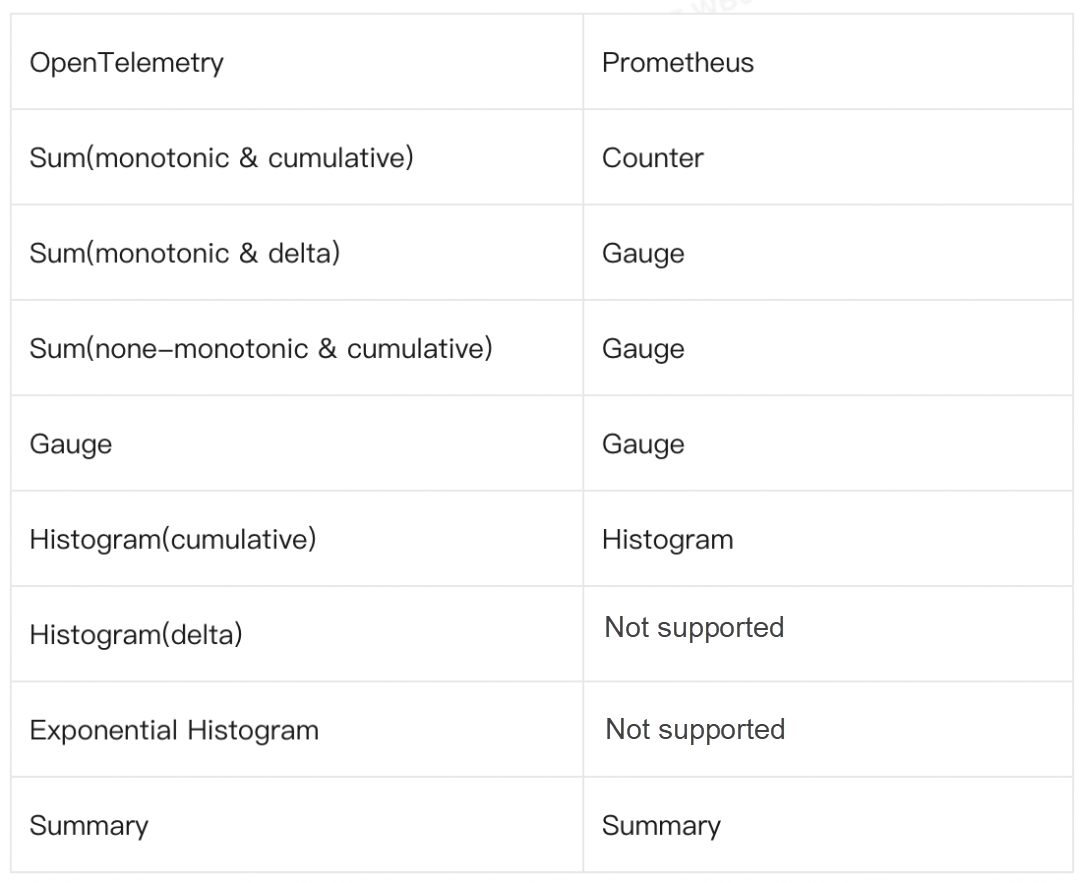
This article will not introduce the metric types of Prometheus in detail. For more information, see the Prometheus official website[7]. By comparing the OpenTelemetry metric types and the Prometheus metric types, we can find that:
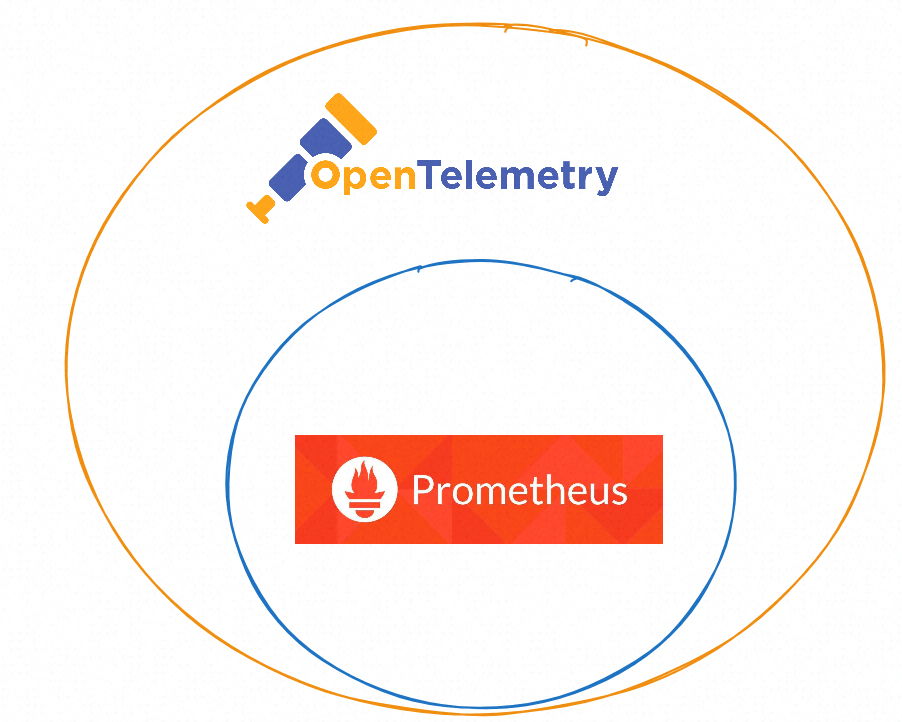
From the preceding summary of model comparison, OpenTelemetry can represent all Prometheus metric types, including counter, gauge, summary, and histogram, while Prometheus cannot represent certain configurations of OpenTelemetry metrics, including delta representations and exponential histograms (although these will be added to Prometheus soon) as well as integer values. In other words, Prometheus metrics are a strict subset of OpenTelemetry metrics.
Despite this, there are still some differences between the two that need to be emphasized here.
It is undeniable that both OpenTelemetry and Prometheus are excellent, and sometimes it is difficult to make a choice between the two. The general principle is to adopt measures suiting your business scenarios and handle problems with a developmental perspective. The following is my personal opinion. Comments and suggestions are welcome.
However, even if you choose OpenTelemetry as the client, the metrics are in turn stored in Prometheus. This is a bit awkward. The current situation is that most organizations are likely to use a mix of these two standards: Prometheus for infrastructure monitoring, which has a more mature integration ecosystem to extract metrics from hundreds of components, and OpenTelemetry for developed services.

The next section focuses on how to connect OpenTelemetry metrics to Prometheus.
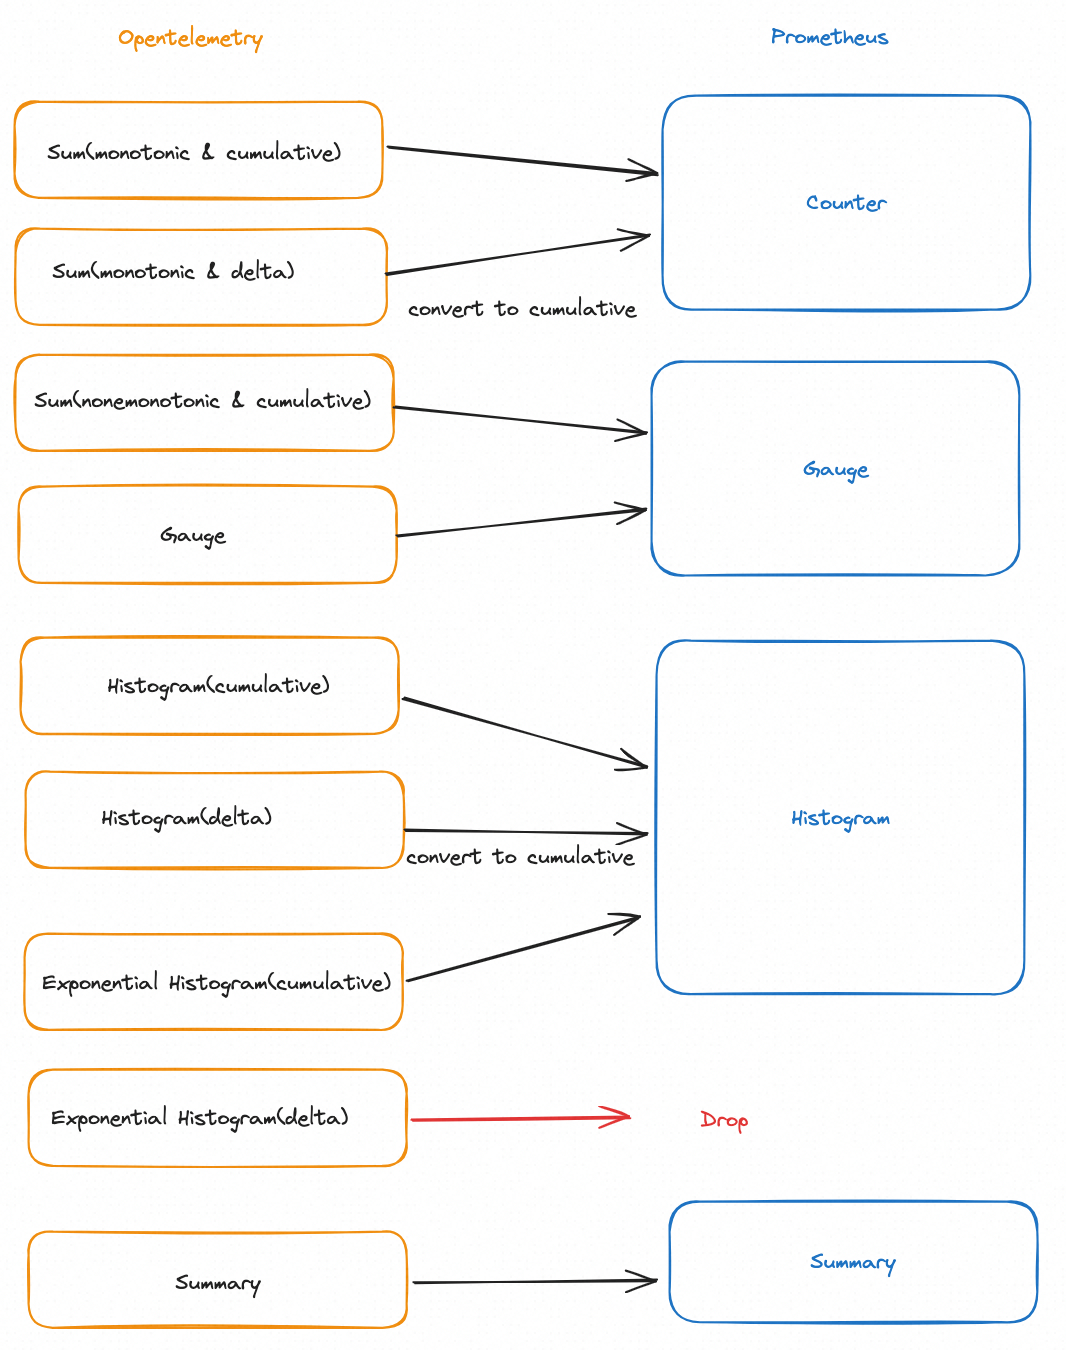
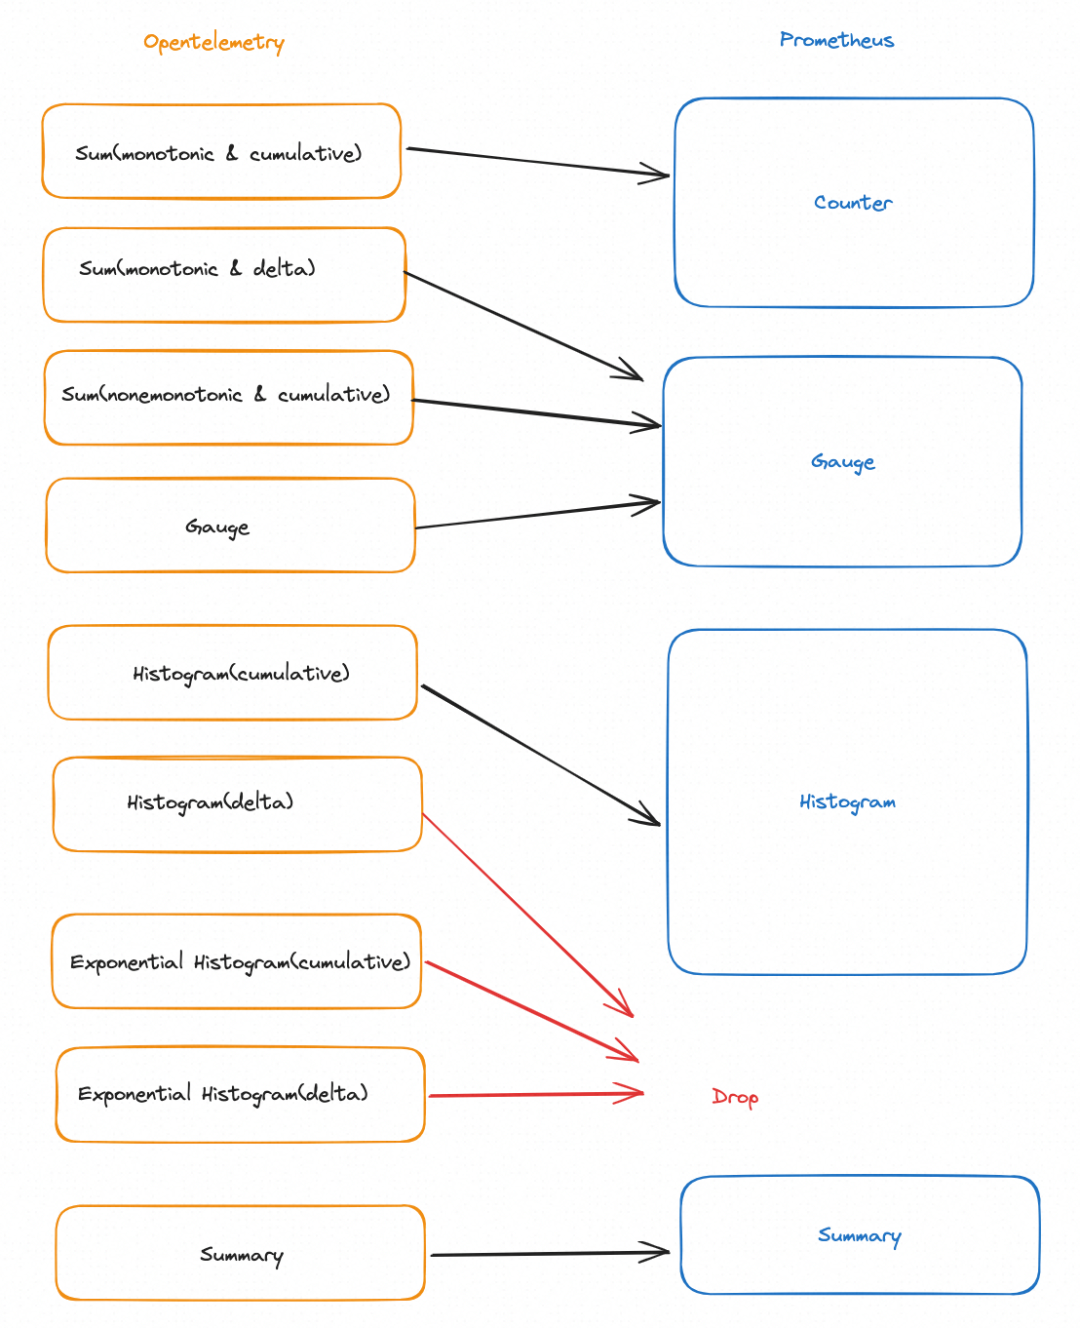
The key to connecting OpenTelemetry metrics to Prometheus is to convert OpenTelemetry metrics to Prometheus metrics. Therefore, be it OpenTelemetry collector or Prometheus exporter bridge on the client, the essence is format conversion.
1) OpenTelemetry Official Website
The following figure shows the conversion paths from OpenTelemetry metrics to Prometheus metrics suggested in the documentation on the OpenTelemetry official website.
For more information, see otlp-metric-points-to-prometheus[8]
2) Implementation of OpenTelemetry Collector
The specific implementation of OpenTelemetry Collector is slightly different from the recommended implementation of the official website. For more information, see prometheus-client-bridge[9]. The following figure shows the conversion relationship. The key differences between OpenTelemetry and OpenTelemetry are as follows:
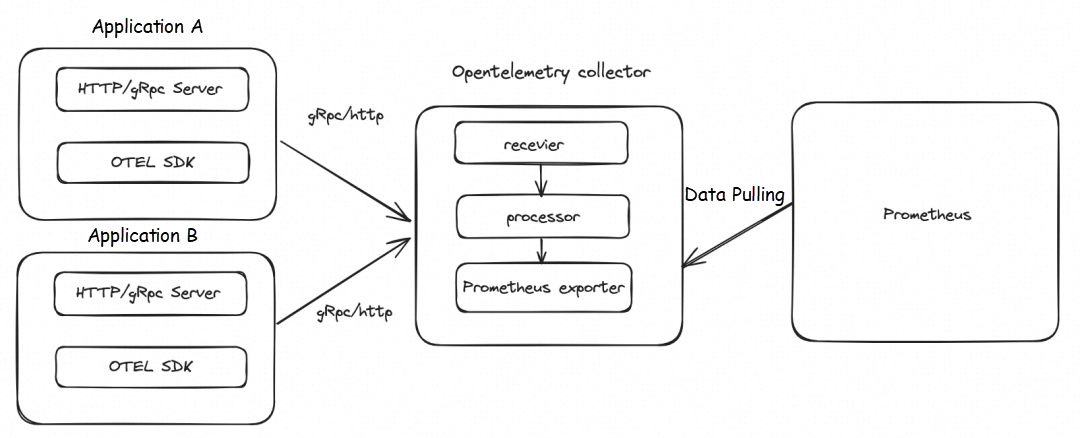
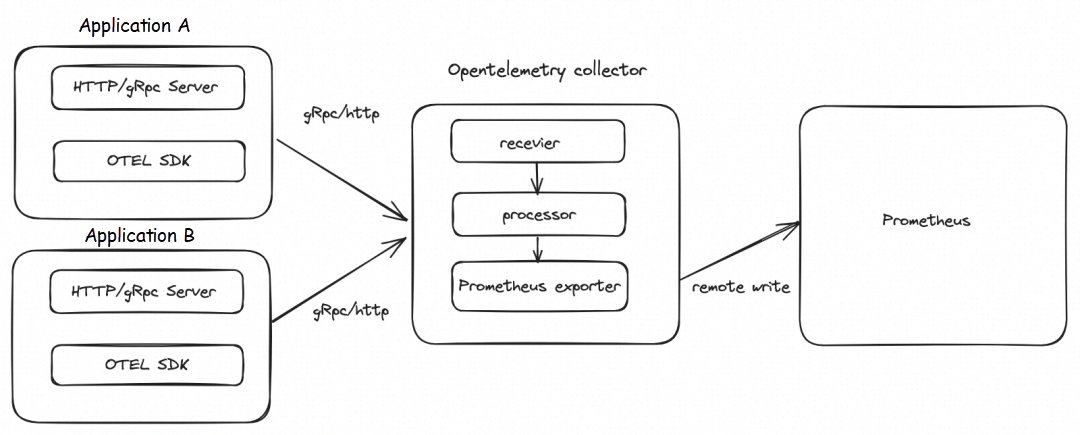
Take Java applications as an example. Currently, Java applications, similar to other multi-language applications, can connect OpenTelemetry metrics to Prometheus in the following common ways. Of course, there are other solutions, such as using a micrometer, which are not described in detail here.
For specific code, see https://github.com/OuyangKevin/opentelemetry-metric-java-demo/blob/main/metric-http/README.md
For specific code, see https://github.com/OuyangKevin/opentelemetry-metric-java-demo/blob/main/metric-grpc/README.md
Note: The earlier version of OpenTelemetry Collector does not support the remote write mode. If you want to verify the method, use the latest version.
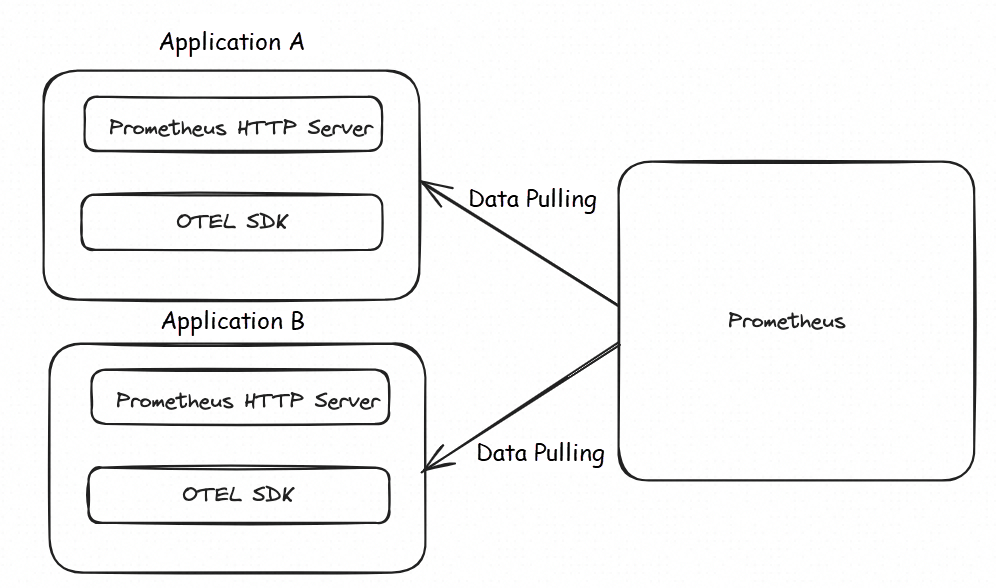
The following is the core code of initialization:
For specific code, see https://github.com/OuyangKevin/opentelemetry-metric-java-demo/blob/main/metric-prometheus/README.md
PrometheusHttpServer prometheusHttpServer = PrometheusHttpServer.builder().setPort(1000).build();
Resource resource = Resource.getDefault().toBuilder().put(SERVICE_NAME, "opentelemetry-metric-demo-http").put(SERVICE_VERSION, "0.0.1").build();
SdkMeterProvider sdkMeterProvider = SdkMeterProvider.builder()
        .registerMetricReader(prometheusHttpServer)
        .setResource(resource)
        .build();

LongCounter longCounter = sdkMeterProvider
        .get("aliyun")
        .counterBuilder("ping_long_counter")
        .setDescription("ot http demo long_counter")
        .setUnit("ms")
.build();At present, Managed Service for Prometheus fully supports the connection of OpenTelemetry metrics. You only need to modify the reporting endpoint and authentication configurations to seamlessly connect to Managed Service for Prometheus. You can go to the Prometheus console for experience[10].
For more information about the use limits, see the OpenTelemetry instructions for the reporting endpoint for OpenTelemetry metrics: https://www.alibabacloud.com/help/en/prometheus/user-guide/instructions-for-using-the-reporting-address-of-opentelemetry-indicator/
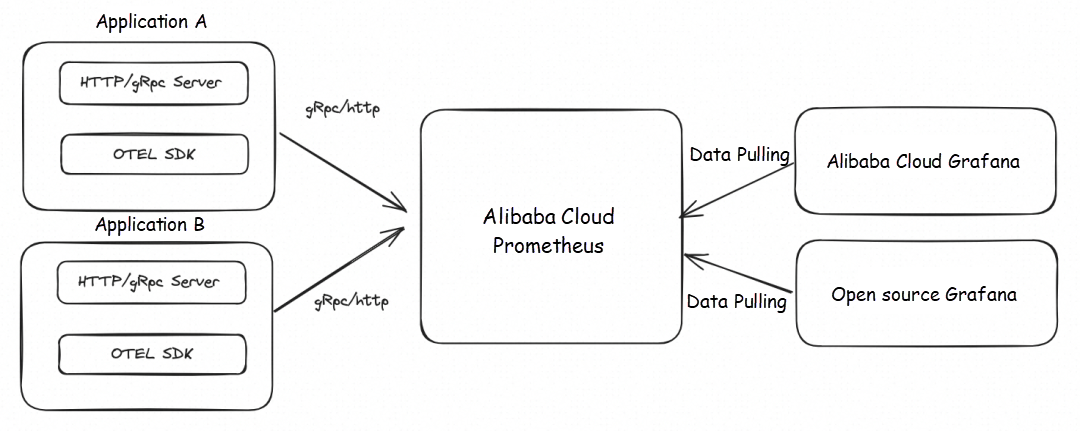
Before you connect Managed Service for Prometheus, make sure that the following types of Prometheus instances are created. For more information, see

The following example shows how to use Java to implement the instrumentation of OpenTelemetry metrics in a SpringBoot project.
  <properties>
      <java.version>1.8</java.version>
      <org.springframework.boot.version>2.7.17</org.springframework.boot.version>
      <org.projectlombok.version>1.18.0</org.projectlombok.version>
      <opentelemetry.version>1.31.0</opentelemetry.version>
  </properties>

  <dependencies>
      <!-- springboot -->
      <dependency>
          <groupId>org.springframework.boot</groupId>
          <artifactId>spring-boot-starter-web</artifactId>
          <version>${org.springframework.boot.version}</version>
      </dependency>
      <dependency>
          <groupId>org.springframework.boot</groupId>
          <artifactId>spring-boot-starter-actuator</artifactId>
          <version>${org.springframework.boot.version}</version>
      </dependency>
      <dependency>
          <groupId>org.springframework.boot</groupId>
          <artifactId>spring-boot-starter-aop</artifactId>
          <version>${org.springframework.boot.version}</version>
      </dependency>


      <!-- opentelemetry -->
      <dependency>
          <groupId>io.opentelemetry</groupId>
          <artifactId>opentelemetry-api</artifactId>
          <version>${opentelemetry.version}</version>
      </dependency>
      <dependency>
          <groupId>io.opentelemetry</groupId>
          <artifactId>opentelemetry-sdk</artifactId>
          <version>${opentelemetry.version}</version>
      </dependency>

      <dependency>
          <groupId>io.opentelemetry</groupId>
          <artifactId>opentelemetry-exporter-otlp</artifactId>
          <version>${opentelemetry.version}</version>
      </dependency>
</dependencies>Modify the Endpoint parameter in the OtlpHttpMetricExporterBuilder and replace it with the reporting endpoint that is obtained in the preceding section. In this way, you can connect the OpenTelemetry metrics of your application to Managed Service for Prometheus.
For the specific demo, see https://github.com/OuyangKevin/opentelemetry-metric-java-demo/blob/main/metric-http/README.md
@Bean
  public OpenTelemetry openTelemetry() {
    String endpoint = httpMetricConfig.getOetlExporterOtlpEndpoint();//自己修改
    Resource resource = Resource.getDefault().toBuilder()
                       .put("service.name", "opentelemetry-metric-demo-http")
                       .put("service.version", "0.0.1").build();

    SdkMeterProvider defaultSdkMeterProvider = SdkMeterProvider.builder()
            .registerMetricReader(PeriodicMetricReader.builder(
                    OtlpHttpMetricExporter.builder()
                            .setEndpoint(endpoint)
                            .build())
                    .setInterval(15, TimeUnit.SECONDS).build())
            .setResource(resource)
            .build();


    OpenTelemetry openTelemetry = OpenTelemetrySdk.builder()
            .setMeterProvider(defaultSdkMeterProvider)
            .buildAndRegisterGlobal();
    return openTelemetry;
}
When you initialize the OpenTelemetry bean, you can configure the parameters of the reporting client. The following table describes the parameters.
1) By default, compression is disabled for OpenTelemetry clients. It is recommended that you set the Compression parameter to gzip to reduce network transmission consumption.
OtlpHttpMetricExporter.builder()
 .setEndpoint("******")
 .setCompression("gzip")
 .build()
2) After OpenTelemetry metrics are reported to Managed Service for Prometheus, you can add the Header "metricNamespace" if you want to add a prefix to all metrics. The following example sets the metricNamespace value to ot, and all reported metrics will be prefixed with ot_.
OtlpHttpMetricExporter.builder()
  .setEndpoint("******")
  .setCompression("gzip")
  .addHeader("metricNamespace","ot")
   .build()
3) After OpenTelemetry metrics are reported to Managed Service for Prometheus, all metrics will be prefixed with the OpenTelemetry Scope Label by default. If you want to skip, you can add the Header skipGlobalLabel and set the value to true.
OtlpHttpMetricExporter.builder()
  .setEndpoint("******")
  .setCompression("gzip")
  .addHeader("skipGlobalLabel","true")
.build()
Define business metrics. In the following example, a LongCounter and a LongHistogram are set.
@RestController
public class MetricController {

    @Autowired
    private OpenTelemetry openTelemetry;

    @GetMapping("/ping")
    public String ping(){
         long startTime = System.currentTimeMillis();
         Meter meter = openTelemetry.getMeter("io_opentelemetry_metric_ping");

         LongCounter longCounter = meter.counterBuilder("ping_long_counter")
                 .setDescription("ot http demo long_counter")
                 .setUnit("ms")
                 .build();

         LongHistogram longHistogram= meter.histogramBuilder("ping_long_histogram")
             .ofLongs()
             .setDescription("ot http demo histogram")
             .setUnit("ms")
             .build();

         try{
             longCounter.add(1,Attributes.of(AttributeKey.stringKey("regionId"),"cn-hangzhou"));
             TimeUnit.MILLISECONDS.sleep(new Random().nextInt(10));
         }catch (Throwable e){

         }finally {
             longHistogram.record(System.currentTimeMillis() - startTime);
         }
         return "ping success!";
    }
}
The following table shows the mappings between OpenTelemetry and Managed Service for Prometheus. Delta histograms need to be converted to cumulative histograms to be supported by Prometheus. Therefore, Managed Service for Prometheus does not support the conversion of OpenTelemetry delta histograms. OpenTelemetry cumulative histograms are recommended in this scenario.
 icon, and then choose the Datasource to the right of Explore.
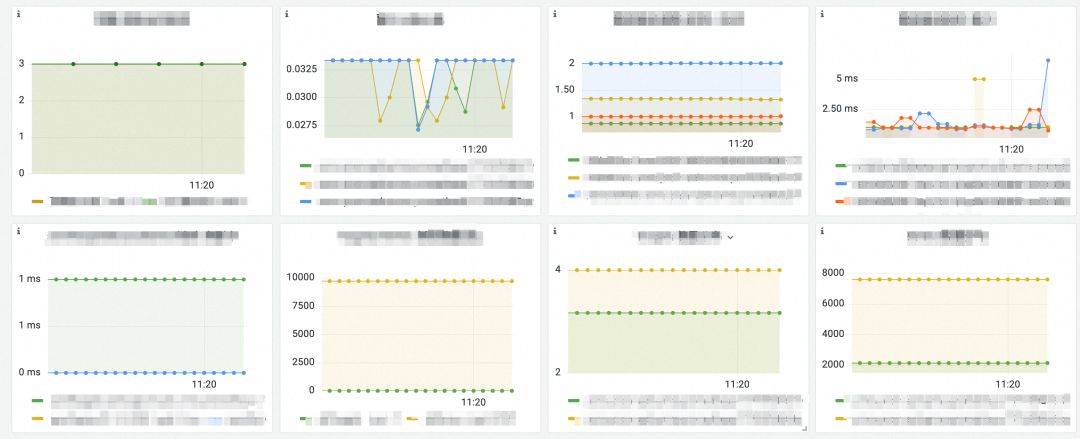
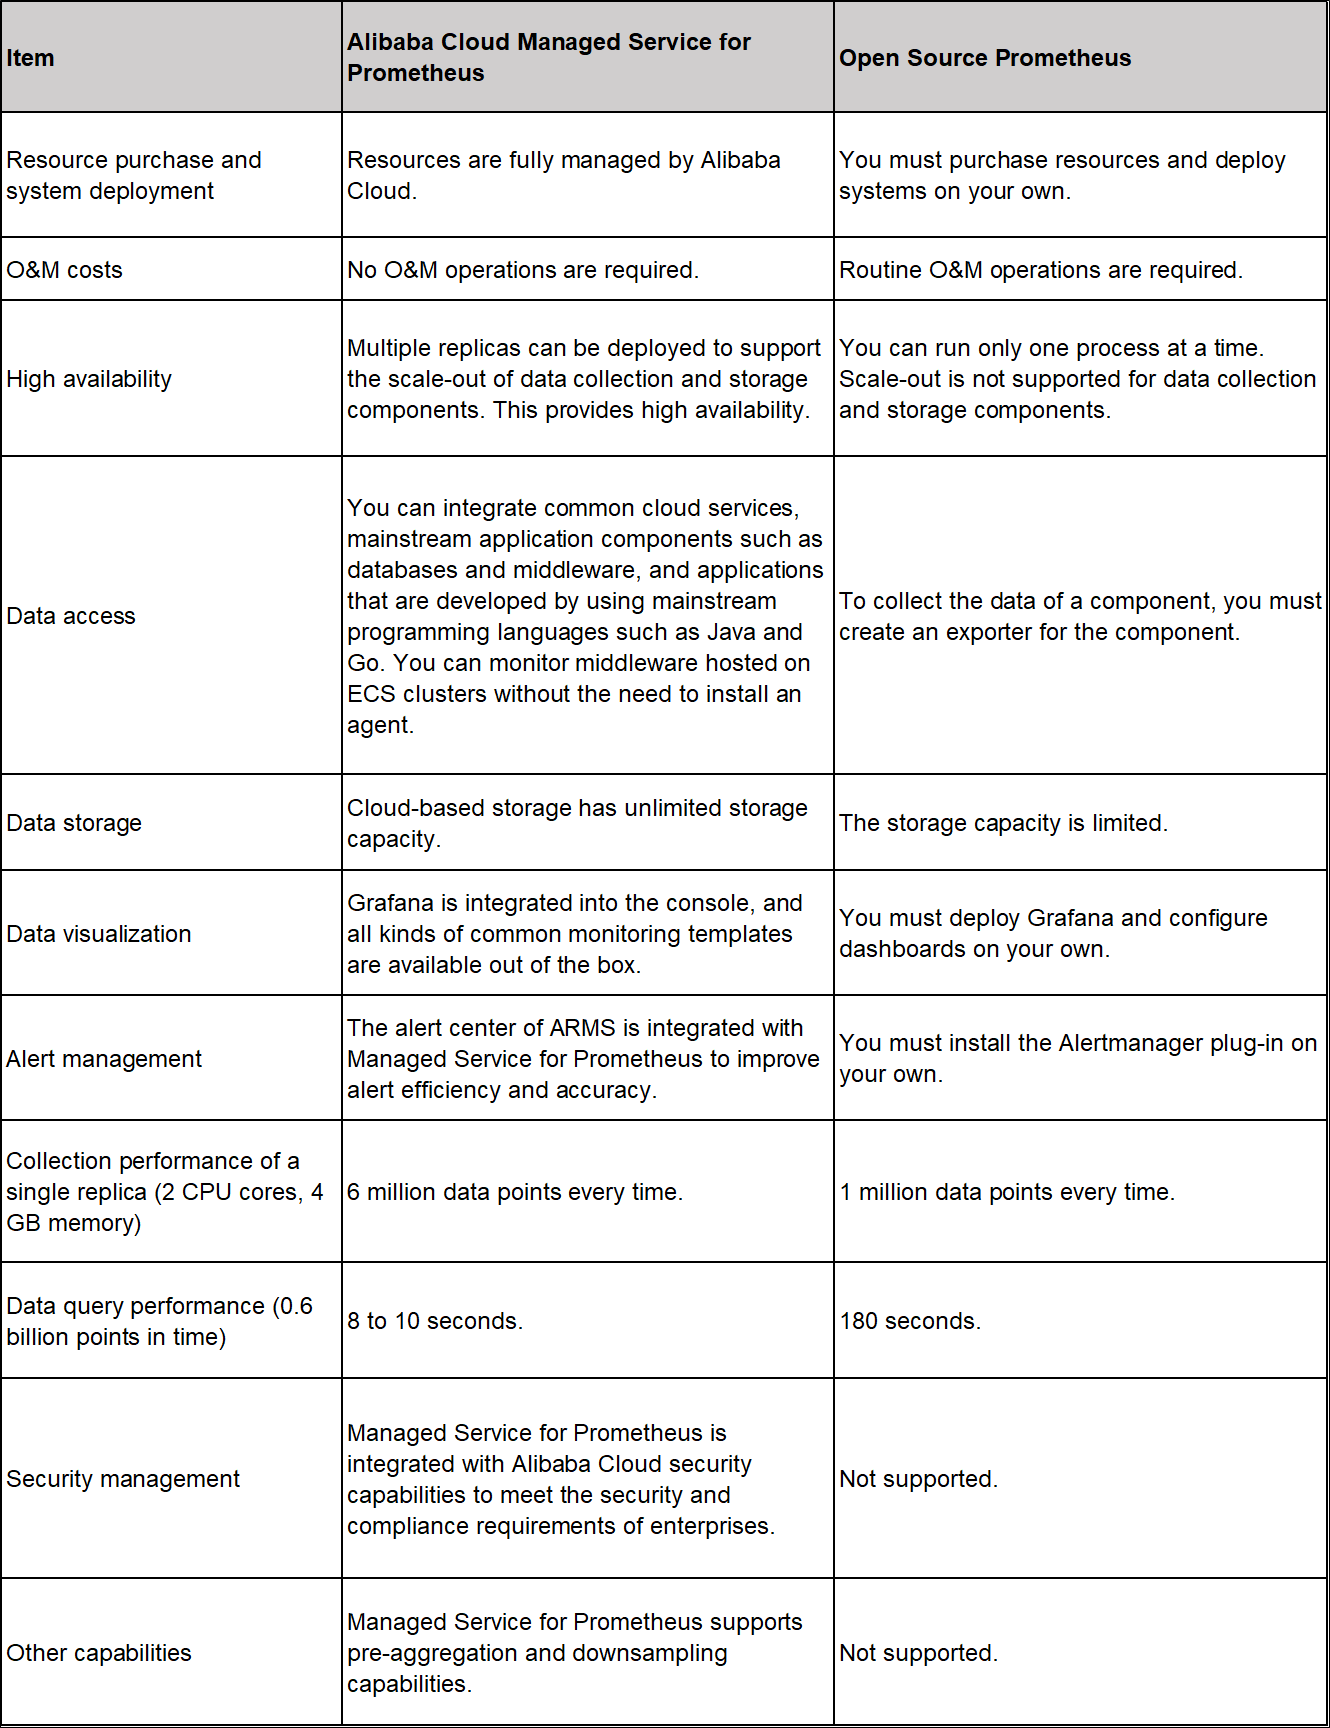
Alibaba Cloud Managed Service for Prometheus is fully compatible with the open-source Prometheus ecosystem. It offers various ready-to-use preset monitoring dashboards and integrates with a comprehensive range of Kubernetes basic monitoring and common service dashboards. Additionally, it provides fully managed Prometheus services. The advantages of Alibaba Cloud Managed Service for Prometheus can be summarized as ready-to-use, cost-effective, open-source and compatible, scalable for unlimited data, high performance, and high availability.
[1] Instruments
https://opentelemetry.io/docs/specs/otel/metrics/api/#instrument
[2] Sums
https://github.com/open-telemetry/opentelemetry-proto/blob/v0.9.0/opentelemetry/proto/metrics/v1/metrics.proto#L230
[3] monotonic
https://en.wikipedia.org/wiki/Monotonic_function
[4] exemplars
https://opentelemetry.io/docs/specs/otel/metrics/data-model/#exemplars
[5] Gauge
https://github.com/open-telemetry/opentelemetry-proto/blob/v0.9.0/opentelemetry/proto/metrics/v1/metrics.proto#L200
[6] Histogram
https://github.com/open-telemetry/opentelemetry-proto/blob/v0.9.0/opentelemetry/proto/metrics/v1/metrics.proto#L258
[7] Introduction
https://prometheus.io/docs/concepts/metric_types/
[8] otlp-metric-points-to-prometheus
https://opentelemetry.io/docs/specs/otel/compatibility/prometheus_and_openmetrics/#otlp-metric-points-to-prometheus
[9] prometheus-client-bridge
https://github.com/open-telemetry/opentelemetry-java-contrib/blob/main/prometheus-client-bridge/src/main/java/io/opentelemetry/contrib/metrics/prometheus/clientbridge/MetricAdapter.java
[10] Managed Service for Prometheus console
https://account.aliyun.com/login/login.htm?oauth_callback=https%3A%2F%2Fprometheus.console.aliyun.com%2F#/home
[11] Prometheus instances for Container Service
https://www.alibabacloud.com/help/en/prometheus/user-guide/create-a-prometheus-instance-to-monitor-an-ack-cluster
[12] Prometheus instances for general purpose
https://www.alibabacloud.com/help/en/prometheus/user-guide/create-a-prometheus-instance-for-remote-storage
[13] Prometheus instances for ECS
https://www.alibabacloud.com/help/en/prometheus/user-guide/create-a-prometheus-instance-to-monitor-an-ecs-instance
[14] Prometheus instances for cloud services
https://www.alibabacloud.com/help/en/prometheus/user-guide/create-a-prometheus-instance-to-monitor-alibaba-cloud-services
[15] Managed Service for Grafana console
https://account.aliyun.com/login/login.htm?oauth_callback=/#/grafana/workspace/

640 posts | 55 followers
FollowAlibaba Cloud Native Community - April 13, 2023
Alibaba Cloud Native Community - February 13, 2023
DavidZhang - January 15, 2021
Alibaba Cloud Native Community - August 30, 2022
Alibaba Cloud Native - April 6, 2022
Alibaba Developer - August 2, 2021

640 posts | 55 followers
Follow Function Compute
Alibaba Cloud Function Compute is a fully-managed event-driven compute service. It allows you to focus on writing and uploading code without the need to manage infrastructure such as servers.
Learn More Managed Service for Prometheus
Multi-source metrics are aggregated to monitor the status of your business and services in real time.
Learn More Cloud-Native Applications Management Solution
Accelerate and secure the development, deployment, and management of containerized applications cost-effectively.
Learn More Managed Service for OpenTelemetry
Allows developers to quickly identify root causes and analyze performance bottlenecks for distributed applications.
Learn MoreMore Posts by Alibaba Cloud Native Community