By Taiye
In robotics and automation, a control loop is an ongoing process that adjusts the system's state. Take a thermostat as an example: when you set a temperature, you're defining the desired state, while the actual room temperature represents the current state. The thermostat then cycles the heating or cooling on and off to move the current temperature toward the set point.
Similarly, in Kubernetes, a controller is a continuous loop that monitors the cluster's state and makes adjustments when necessary. Each controller works to align the current state of the cluster more closely with the desired state.
Common types of controllers in Kubernetes include:
• Deployment: a stateless container controller that manages pods by controlling the ReplicaSet.
• StatefulSet: a stateful container controller that ensures that pods are ordered and unique and that the network identifier and storage of a pod are consistent before and after the pod is rebuilt.
• DeamonSet: a daemon container controller that ensures that there is only one pod on every node.
• Job: a general task container controller that executes only once.
• CronJob: a scheduled task container controller that executes at the scheduled time.
The following figure shows the actions of the ReplicaSetController when a user creates a deployment with three replicas:
• List pods to compare the number of pods.
• When the number is inconsistent, create or delete pods.
• Ensure that the number of pods that are currently running is consistent with the number defined by the user.
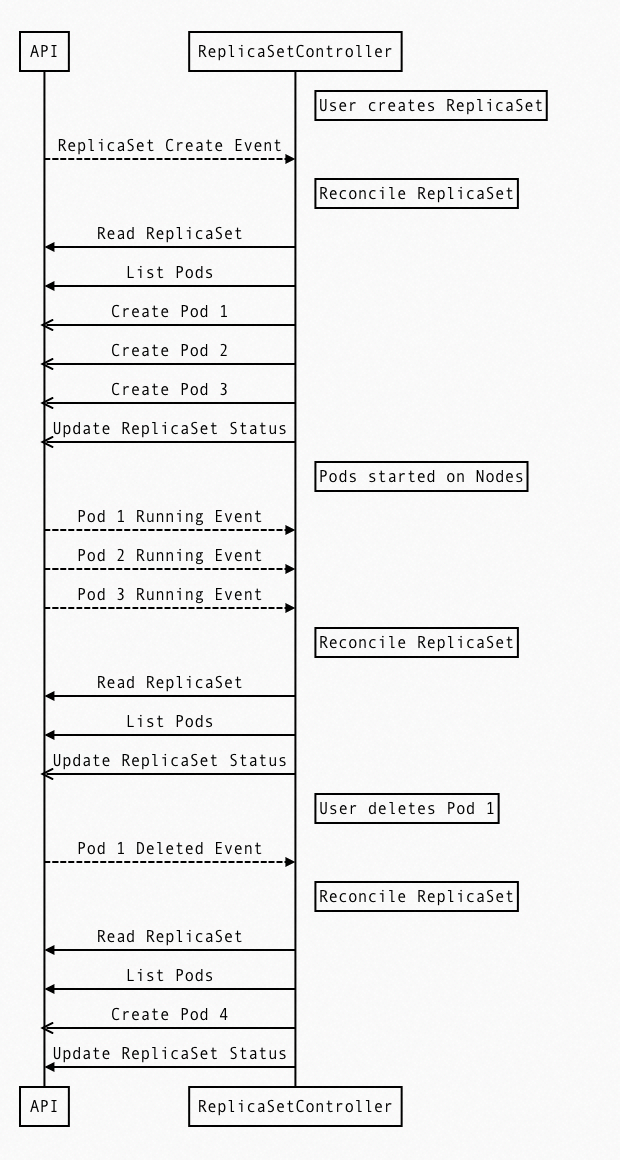
In Kubernetes, Deployment, DaemonSet, StatefulSet, Service, and ConfigMap are all considered resources. The actions of creating, updating, and deleting these resources are known as events. The Kubernetes Controller Manager monitors these events and triggers appropriate actions to fulfill the desired specifications (Spec). This approach is declarative, meaning users only need to focus on the application's end state. However, the resources provided by Kubernetes may not fully meet all user needs. To address this, Kubernetes offers custom resources and Kubernetes operators as extensions.
The operator pattern in Kubernetes is a synthesis of two concepts: custom resources and custom controllers.
A resource in Kubernetes is an endpoint in the Kubernetes API that stores a collection of API objects of a certain type. By adding custom resource definitions (CRDs), we can extend Kubernetes with more types of objects. Once these new object types are added, we can use kubectl to interact with our custom API objects just like the built-in ones.
Every controller in Kubernetes runs a control loop that watches for changes to specific resources in the cluster. This loop ensures that the current state of a resource aligns with the state desired by the controller. The process of transitioning a resource from its current state to the desired state is known as reconciliation. A custom controller, or operator, is a controller designed for custom resources.
There are two types of scaffolds for generating operator code: KubeBuilder and OperatorSDK. In this example, the sample code is generated by KubeBuilder.
The command line is as follows:
// Initialize the project.
kubebuilder init --domain my.domain --repo my.domain/demo
// Create an API.
kubebuilder create api --group demo --version v1alpha1 --kind Mydemo
// Create a webhook.
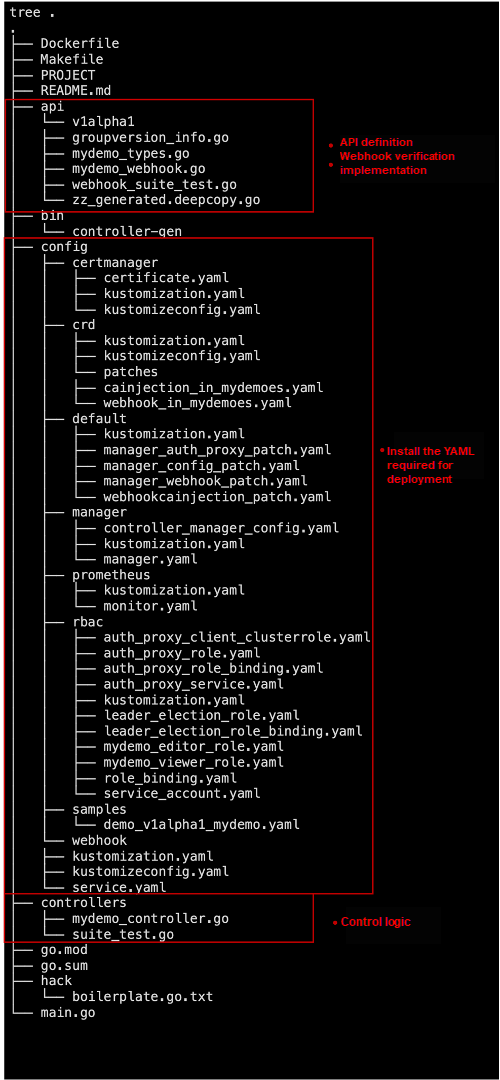
kubebuilder create webhook --group demo --version v1alpha1 --kind Mydemo --defaulting --programmatic-validationThe main body of the code structure includes three parts:
• API definition and webhook implementation
• YAML definition required for operator installation and deployment
• Control logic
The following are what needs to be implemented in the code:
1. CR (custom resource) field definition and registration
mydemo_types.go: The required fields for the resource need to be defined in MydemoSpec.
// MydemoSpec defines the desired state of Mydemo
type MydemoSpec struct {
  // INSERT ADDITIONAL SPEC FIELDS - desired state of cluster
  // Important: Run "make" to regenerate code after modifying this file
  // Foo is an example field of Mydemo. Edit mydemo_types.go to remove/update
  Foo string `json:"foo,omitempty"`
}
func init() {
  SchemeBuilder.Register(&Mydemo{}, &MydemoList{})
}
2. Interface for the webhook to verify the CR
mydemo_webhook.go: The ValidateCreate, ValidateUpdate, and ValidateDelete functions verify resource creation, update, and deletion respectively.
// ValidateCreate implements webhook.Validator so a webhook will be registered for the type
func (r *Mydemo) ValidateCreate() error {
  mydemolog.Info("validate create", "name", r.Name)
  // TODO(user): fill in your validation logic upon object creation.
  return nil
}
// ValidateUpdate implements webhook.Validator so a webhook will be registered for the type
func (r *Mydemo) ValidateUpdate(old runtime.Object) error {
  mydemolog.Info("validate update", "name", r.Name)
  // TODO(user): fill in your validation logic upon object update.
  return nil
}
// ValidateDelete implements webhook.Validator so a webhook will be registered for the type
func (r *Mydemo) ValidateDelete() error {
  mydemolog.Info("validate delete", "name", r.Name)
  // TODO(user): fill in your validation logic upon object deletion.
  return nil
}
3. Implementation of control logic
mydemo_controller.go: The reconcile function mainly unifies the current state and the desired state. For internal Kubernetes resources, the number of pods needs to be reconciled. However, custom resources may be bound to resources in third-party databases. For Logtail, creating a CR is equivalent to creating a collection configuration. The consistency between the two resources needs to be processed in the reconcile function.
// Reconcile is part of the main kubernetes reconciliation loop which aims to
// move the current state of the cluster closer to the desired state.
// TODO(user): Modify the Reconcile function to compare the state specified by
// the Mydemo object against the actual cluster state, and then
// perform operations to make the cluster state reflect the state specified by
// the user.
//
// For more details, check Reconcile and its Result here:
// - https://pkg.go.dev/sigs.k8s.io/controller-runtime@v0.12.1/pkg/reconcile
func (r *MydemoReconciler) Reconcile(ctx context.Context, req ctrl.Request) (ctrl.Result, error) {
  _ = log.FromContext(ctx)
  // TODO(user): your logic here
  return ctrl.Result{}, nil
}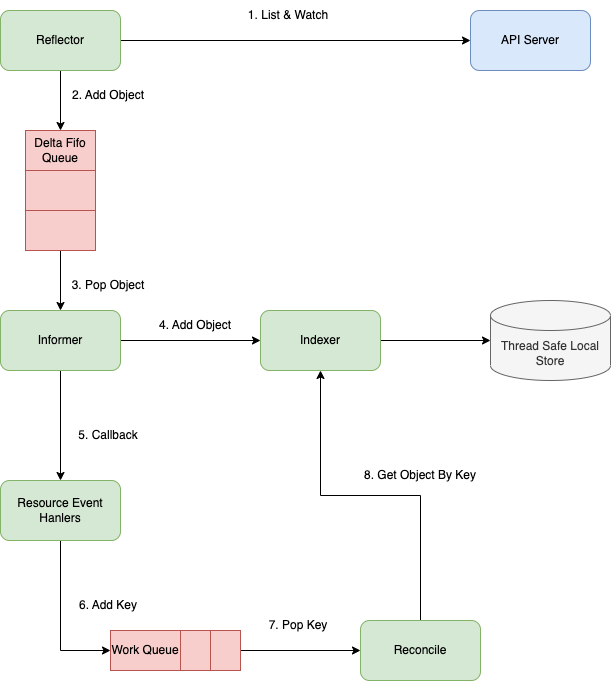
The following diagram shows the entire process of an operator.
• Reflector: The reflector executes the Kubernetes List and Watch APIs to obtain resource objects from apiServer and watch changed objects, and then puts the objects and events into DeltaFIFO.
• First, call the Kubernetes List API to obtain all objects of a resource and cache them in memory.
• Then, call the Watch API to watch the resource to maintain the cache.
• DeltaFIFO: DeltaFIFO is an incremental queue in the producer-consumer pattern, where the reflector is the producer and the informer is the consumer.
• Informer: The informer consumes the DeltaFIFO queue, obtains the objects, stores the latest data in a thread-safe storage system, and calls the callback function in the resource event handler to notify the controller to process the data.
• Indexer: The indexer is a combination of storage and index. It contains thread-safe storage and creates an index for storage, which accelerates data retrieval.
• ResourceEventHandler: ResourceEventHandler is an interface that defines three methods: OnAdd, OnUpdate, and OnDelete, which adds, updates and deletes events respectively. The infomer takes the instance out of DeltaFIFO, updates the data in the cache based on the events that occur on the instance, and then calls the ResourceEventHandler registered by the user to put it into the work queue.
• Work queue: The speed at which events are generated is inconsistent with the speed at which we process them. Therefore, queues are needed for buffering.
• Reconcile: After the key is taken out of the work queue, the reconcile obtains the complete object from the indexer and then processes it.
According to the code introduction in the first part, the operator not only operates CR, but also has some data for CR verification logic, which is implemented through webhook.
There are two types of webhooks in Kubernetes:
• Validating admission webhooks: mainly used to validate resources before the resources are persisted to ETCD. Resources that do not meet the requirements are rejected and the corresponding information is provided.
• Mutating admission webhooks: mainly used to mutate resources before the resources are persisted to ETCD. For example, adding an init container or a Sidecar container.
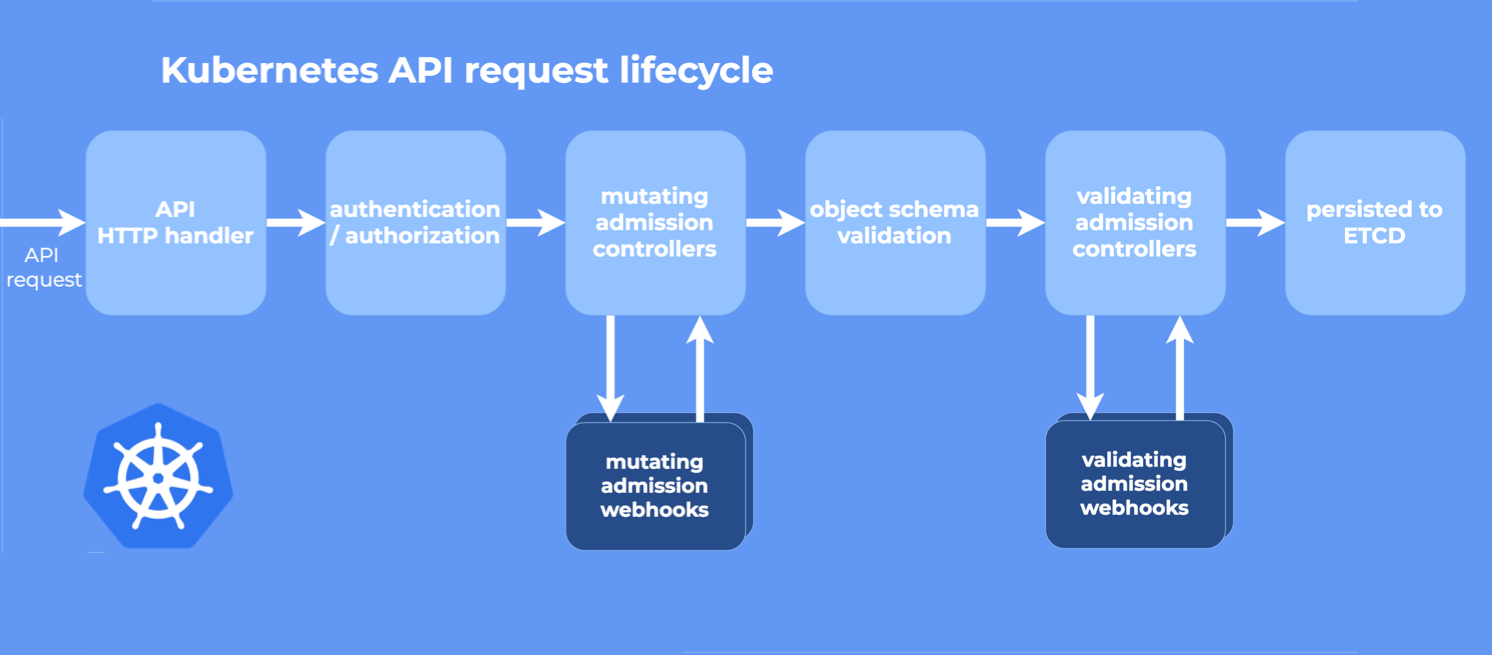
Webhooks used in Operator are mainly validating ones, which are used to validate whether the fields of the object meet the requirements. Mutating webhooks are also applicable in Operator. For example, the Sidecar mode deployment of the OpenTelmetrics operator uses muting webhooks to automatically inject the OpenTelmetrics collector into pods.
Fluent Bit is written in C language. It mainly includes input, filter, and output plug-ins and features lightweight with high performance. Fluentd is written in Ruby language, and the most important feature is that it is rich in plug-ins and has stronger data processing capabilities.
| Fluent Bit | Fluentd |
| Embedded Linux/containers /servers | Containers/servers |
| C | C & Ruby |
| ~650KB | ~40MB |
| High performance | High performance |
| Zero dependencies, except for some plug-ins with special requirements | Built on Ruby Gems and dependent on Gems |
| About 70 plug-ins | Over 1,000 plug-ins |
| Apache License v2.0 | Apache License v2.0 |
Fluent Operator was contributed by the KubeSphere community to the Fluent community in 2021, initially to meet the need to manage Fluent Bit in a cloud-native manner. It helps to deploy, configure, and uninstall Fluent Bit and Fluentd flexibly and easily. It also provides plug-ins that support Fluentd and Fluent Bit. You can customize the plug-ins based on your business requirements.
Fluent Operator provides a variety of deployment modes. You can choose the mode based on your business requirements:
• Fluent Bit only mode: This mode is suitable for scenarios where you just need to process the collected logs and send them to a third-party storage system.
• Fluent Bit + Fluentd mode: This mode is suitable for scenarios where you need to perform some advanced processing on the logs collected before they are sent to a third-party storage system.
• Fluentd only mode: This mode is suitable for scenarios where you need to receive logs through networks such as HTTP or Syslog, and then process and send them to a third-party storage system.
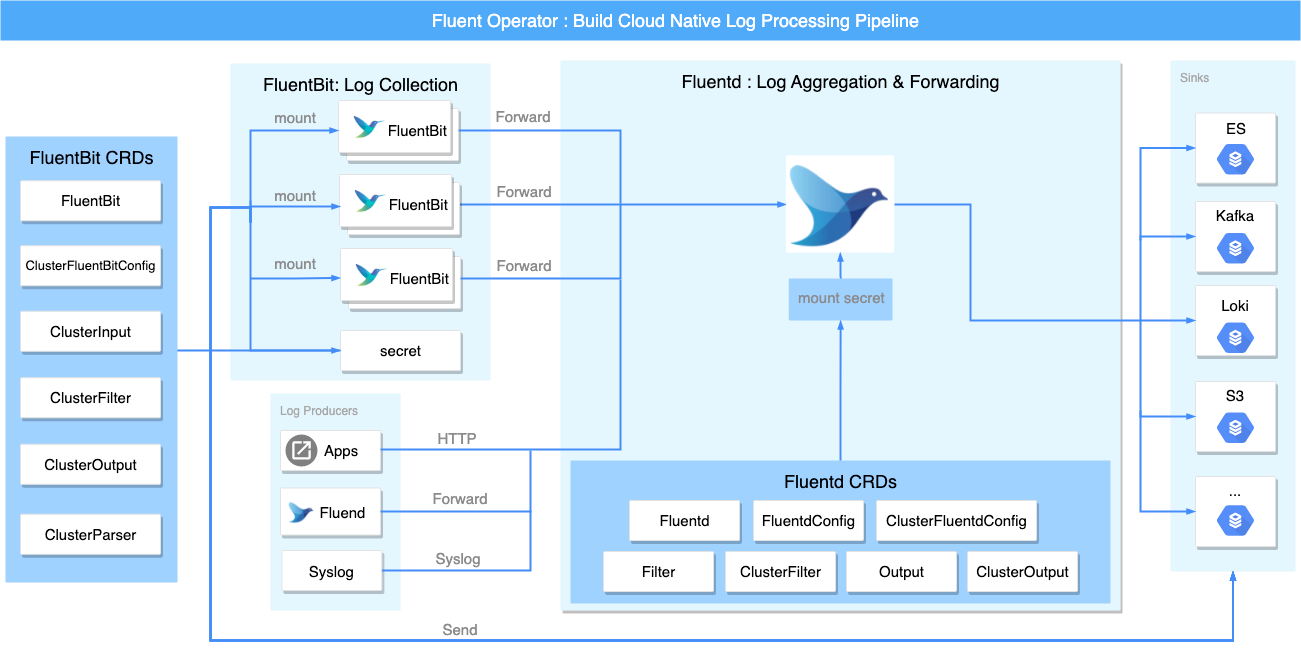
The following CRDs are included in Fluent Bit:
• FluentBit: Defines the Fluent Bit DaemonSet and its configs.
• ClusterFluentBitConfig: Selects ClusterInput, ClusterParser, ClusterFilter, and ClusterOutput and generates the final config into a Secret Config.
• ClusterInput: Defines cluster-level input config sections. This plug-in allows you to customize the types of logs to be collected.
• ClusterParser: Defines cluster-level parser config sections. This plug-in is used to parse logs.
• ClusterFilter: Defines cluster-level filter config sections. This plug-in is used to filter logs.
• ClusterOutput: Defines cluster-level output config sections. This plug-in is mainly responsible for sending processed logs to a third-party storage system.
Each ClusterInput, ClusterParser, ClusterFilter, and ClusterOutput represents a Fluent Bit config section. Then, ClusterFluentBitConfig selects from them via label selectors. After that, Fluent Operator constructs the CRDs that meet the conditions into the final config and stores it into a Secret Config. Finally, it mounts on the DaemonSet of Fluent Bit.
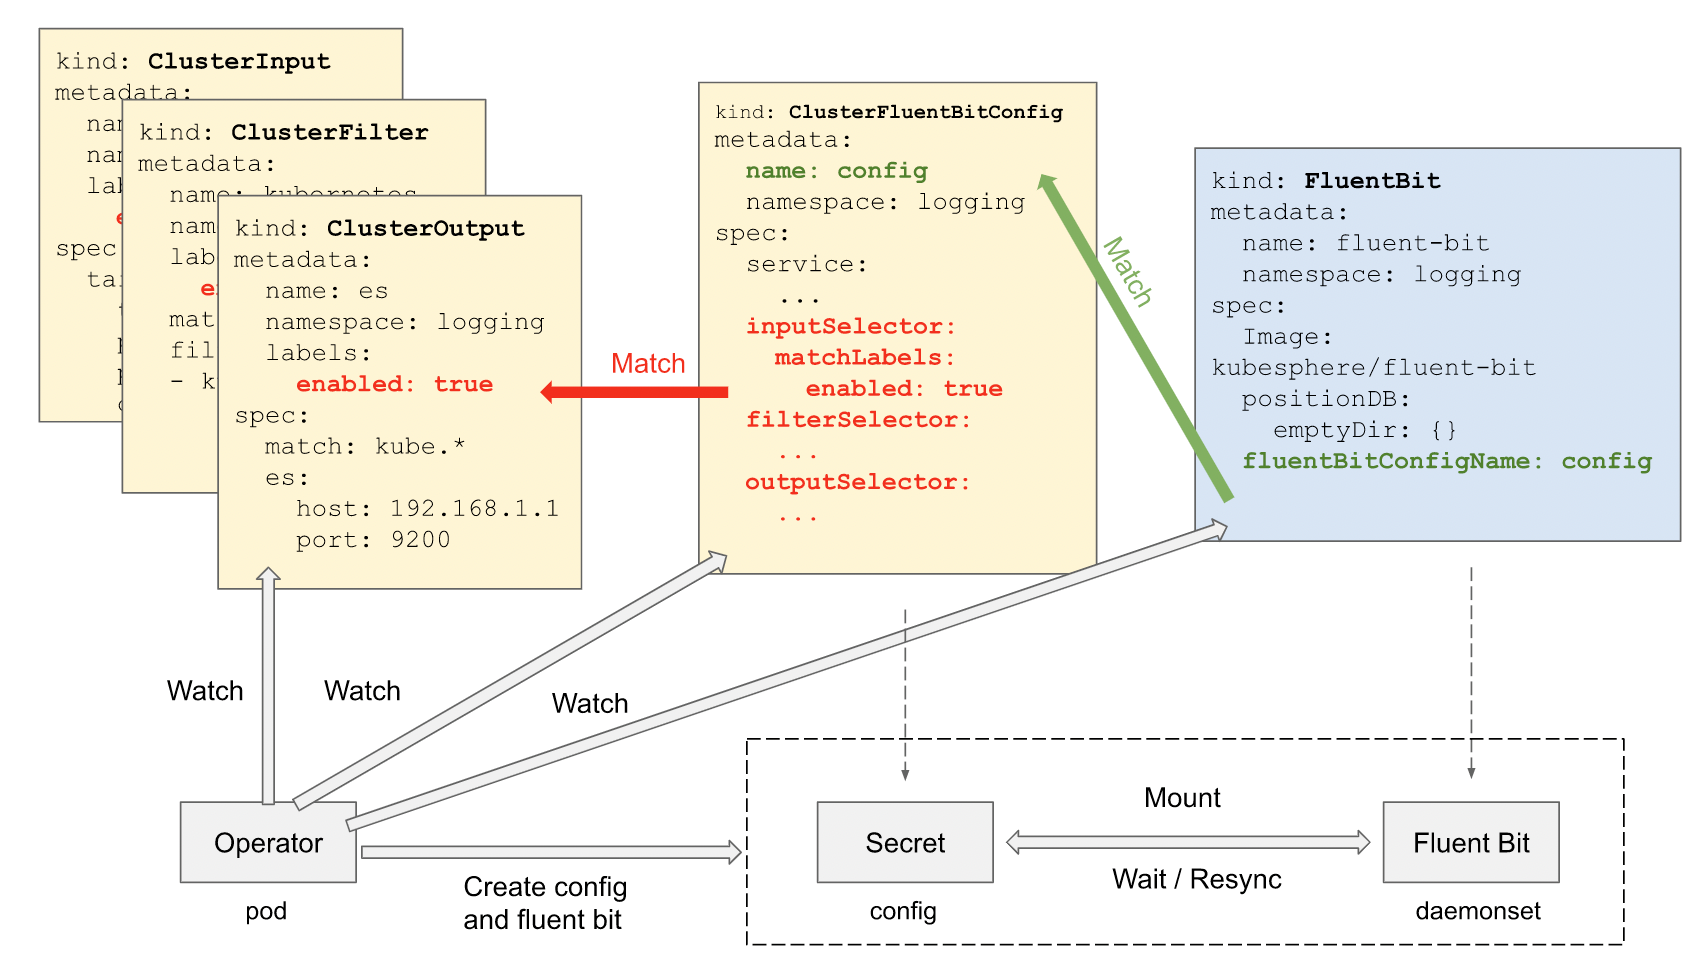
To solve the problem that Fluent Bit does not support hot load config, a wrapper called Fluent Bit watcher is added to restart the Fluent Bit process as soon as Fluent Bit config changes are detected. In this way, the Fluent Bit pod does not need to be restarted to reload the new config.
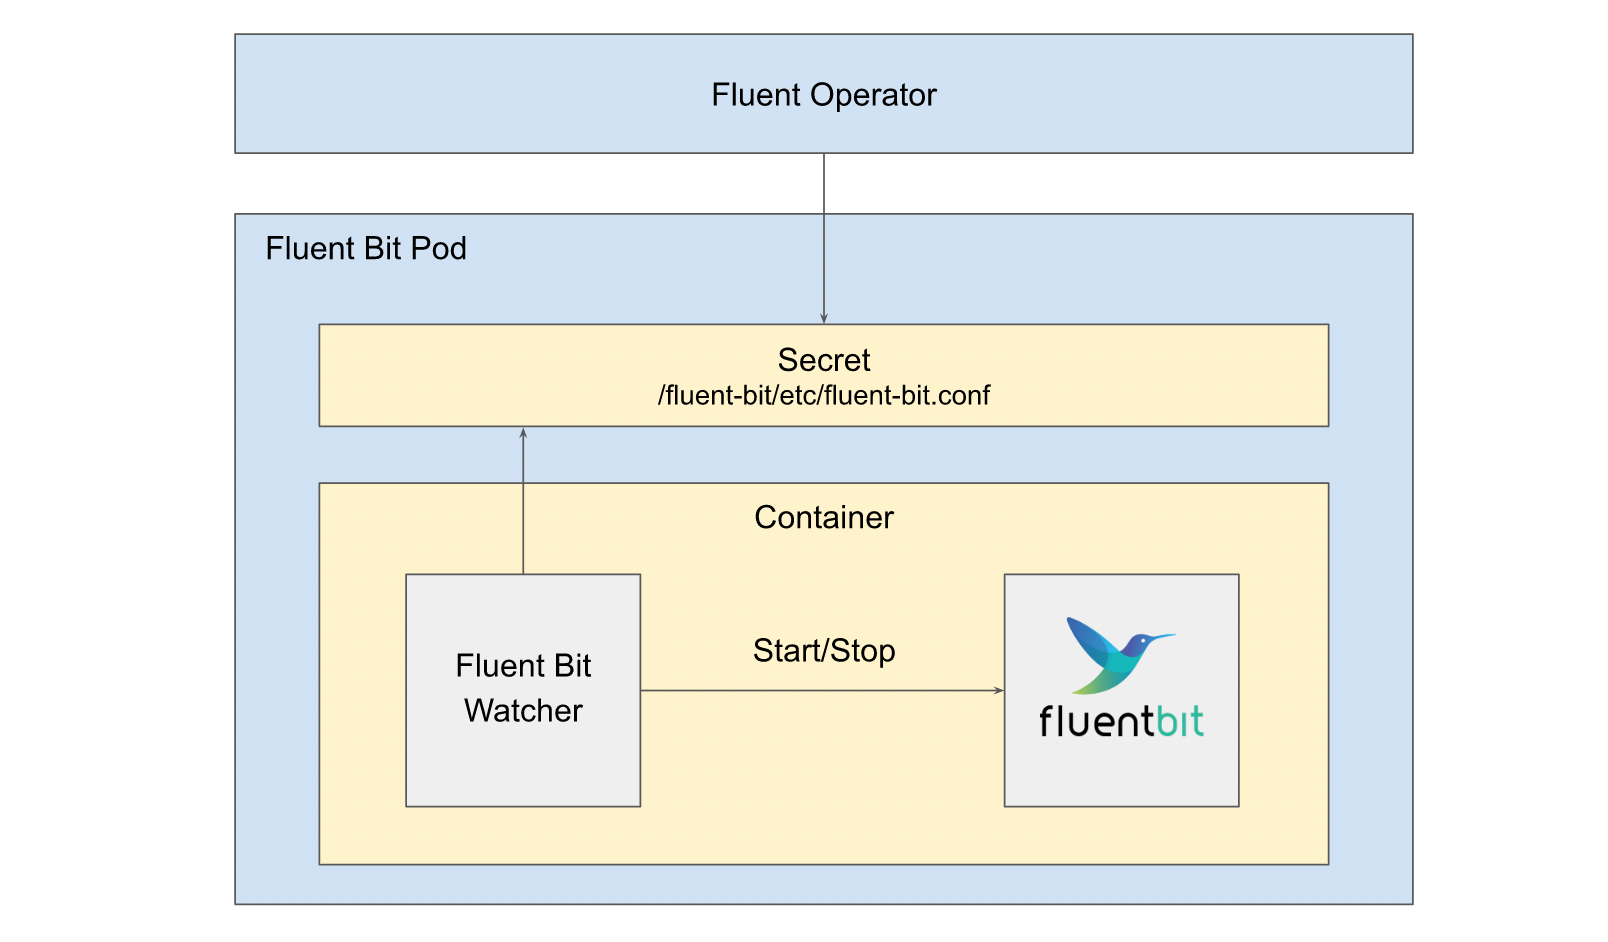
As you can see, FluentBit is the deployment mode of DaemonSet, so its config is cluster-specific.
The following CRDs are included in Fluentd:
• Fluentd: Defines the Fluentd Statefulset and its configs.
• FluentdConfig: Selects namespace-level ClusterInput, ClusterParser, ClusterFilter, and ClusterOutput and generates the config into a Secret Config.
• ClusterFluentdConfig: Selects namespace-level ClusterInput, ClusterParser, ClusterFilter, and ClusterOutput from the Cluster drop-down list and generates the config into a Secret Config.
• Filter: Defines namespace-level filter config sections.
• ClusterFilter: Defines cluster-level filter config sections.
• Output: Defines namespace-level output config sections.
• ClusterOutput: Defines cluster-level output config sections.
ClusterFluentdConfig is a plug-in at a cluster level that has a watchedNamespaces field. It listens to the namespace if you set the parameter and listens to the global situation if you do not. FluentdConfig is a namespace-level plug-in that only listens to the CR of the namespace where it is located. You can use ClusterFluentdConfig and FluentdConfig to isolate logs of multiple tenants at the namespace level.
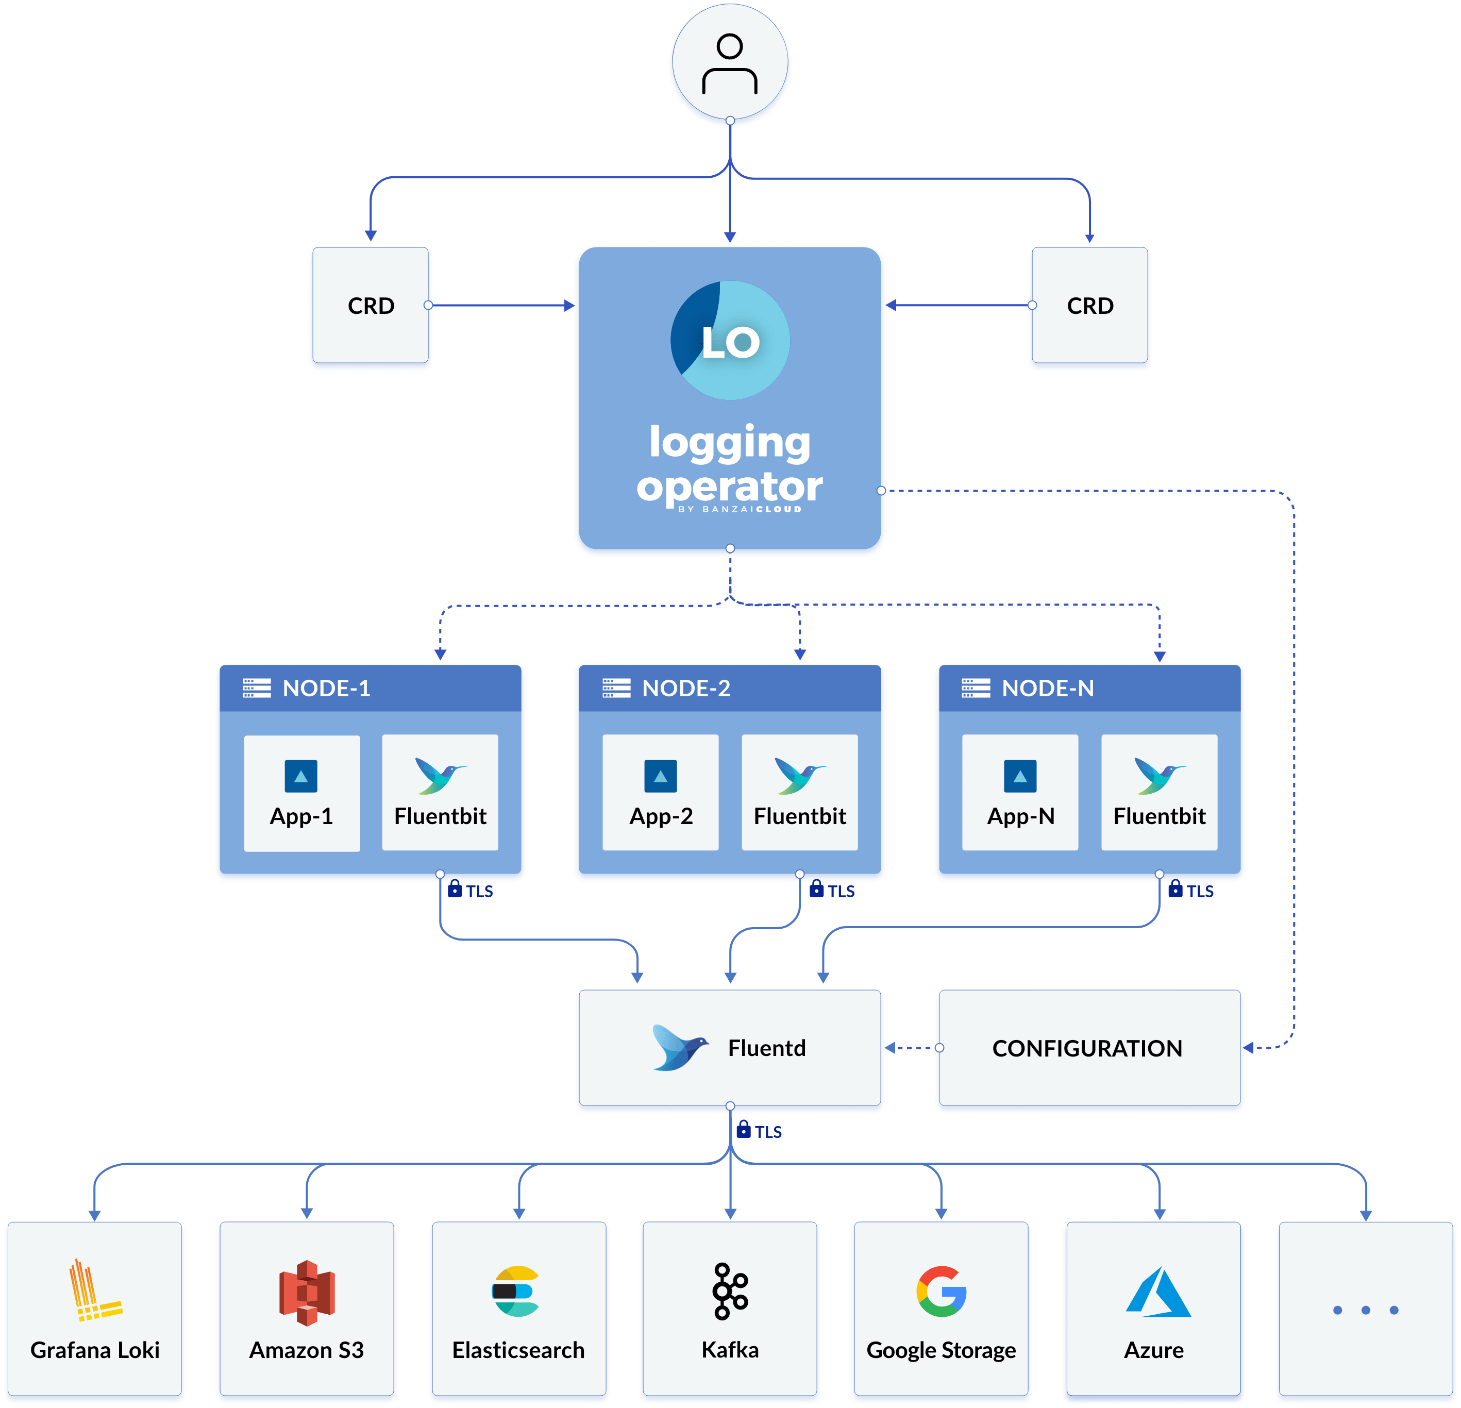
Logging Operator is an open-source cloud-native log collector provided by BanzaiCloud. It integrates FluentBit and Fluentd, two open-source log collectors of the Fluent community, to automate the configuration of the Kubernetes log collection pipeline in an operator manner.
• Logging: Defines the basic configuration of FleuntBit and Fleuntd. You can specify controlNamespace and watchNamespaces.
The following is a CRD sample of a simple logging. controlNamespace is bound to the logging namespace of Fluentd and Fluentbit. watchNamespaces specifies that logs are collected only in the prod and test namespaces. You can see that the logging provides considerable flexibility in isolation at the namespace level.
apiVersion: logging.banzaicloud.io/v1beta1
kind: Logging
metadata:
  name: default-logging-namespaced
  namespace: logging
spec:
  fluentd: {}
  fluentbit: {}
  controlNamespace: logging
  watchNamespaces: ["prod", "test"]
• Output: Defines the log output configuration at the namespace level. Only the flow in the same namespace can access it.
• Flow: Defines the log filter flow and output flow at the namespaces level.
• Clusteroutput: Defines the log output configuration at the cluster level. Compared with output, enabledNamespaces fields are added to control the configuration in different namespaces.
• Clusterflow: Defines the log filter flow and output flow at the cluster level.
Here, output, flow, clusterouput, and clusterflow are all configurations for Fleuntd. One thing to note about the collocation relationship among these is that flow can be connected to output and clusteroutput, but clusterflow can only be connected to clusteroutput.
OpenTelemetry Collector is committed to building a unified observable data collector that is independent of manufacturers to receive, process, and output observable data. The eye-catching feature of OpenTelemetry Collector is that it unifies traces, metrics and logs through One Agent, which saves you from the deployment of multiple observability collectors. OpenTelemetry Collector allows you to connect to various types of open-source observable data, such as Jaeger, Prometheus, and Fluent Bits, and send them to backend services in a unified manner.
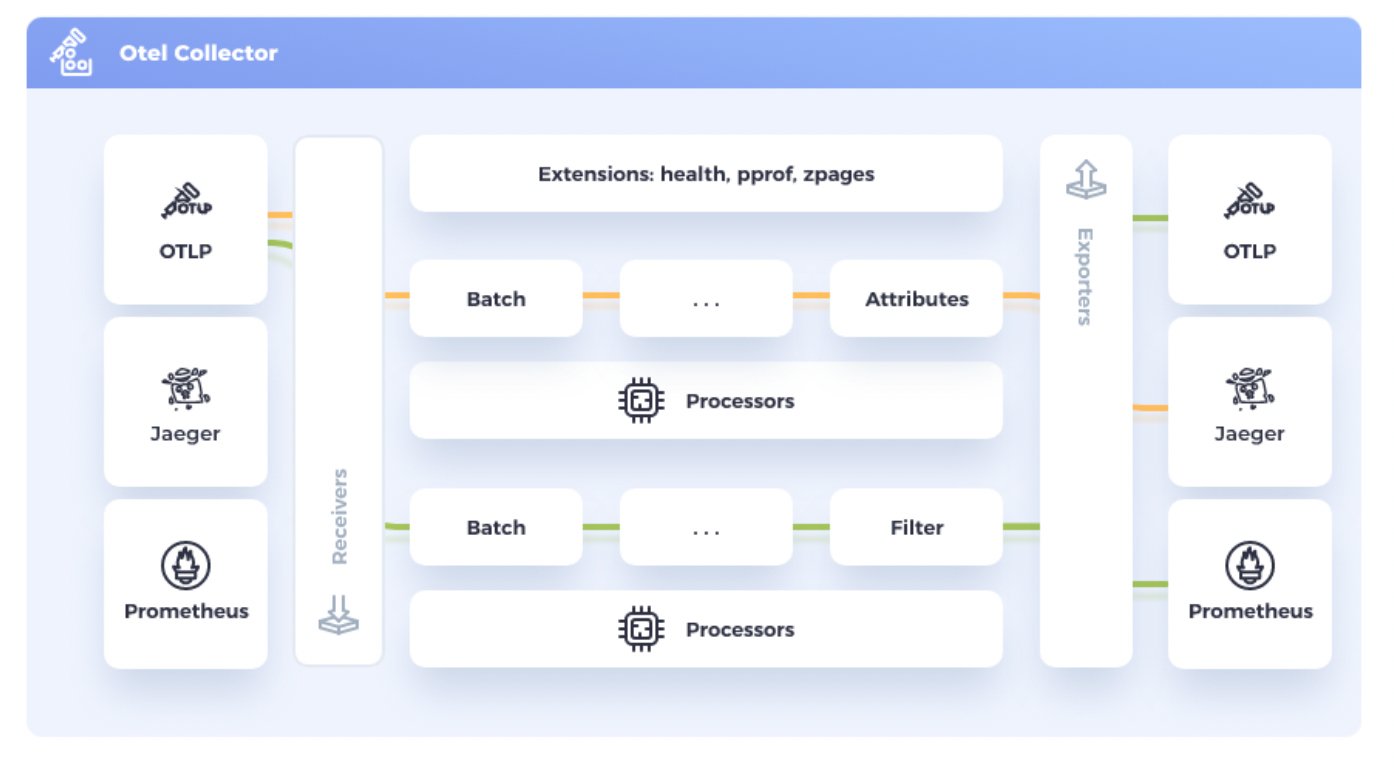
Data is received, processed, and exported in the form of a pipeline.
A pipeline consists of three parts. Receivers receive data; Processors process data; Exporters send data and define a complete data flow. A pipeline handles 3 types of data: traces, metrics, and logs.

A pipeline may have multiple receivers. Data received by each receiver is sent to the first processor and processed by subsequent processors in sequence. The processors support data processing and filtering. The last processor distributes data to multiple exporters by using fanoutconsumer, and the exporters send data to external services.
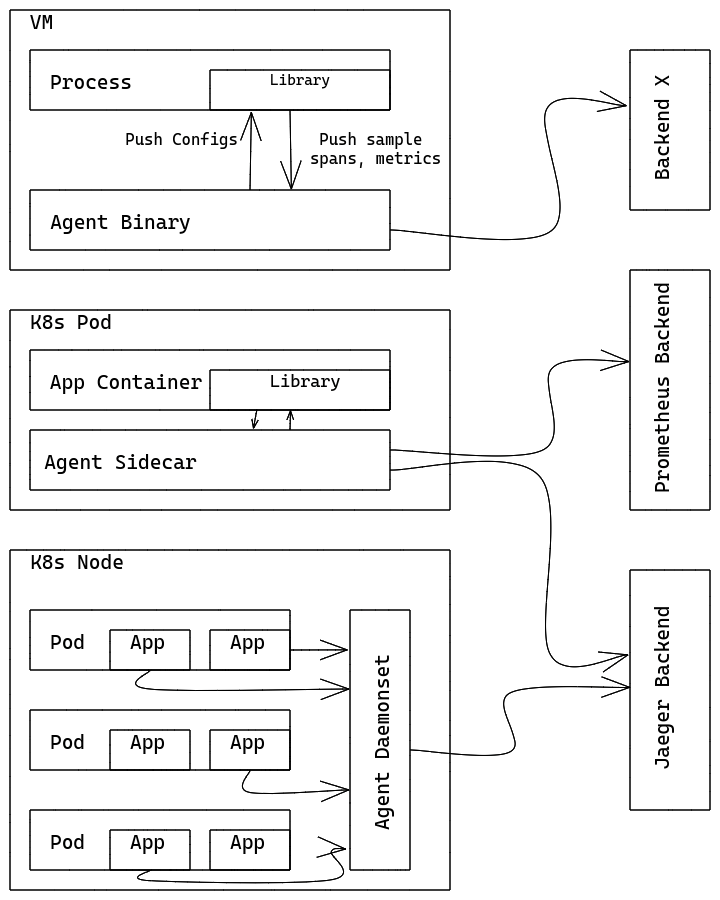
• Agent mode: OpenTelemetry Collector runs as a local agent to receive observable data from business processes, process the observable data, and then send the observable data to the backend service. Host scenarios are deployed as daemon processes, and Kubernetes are deployed as Daemonsets or Sidecars.
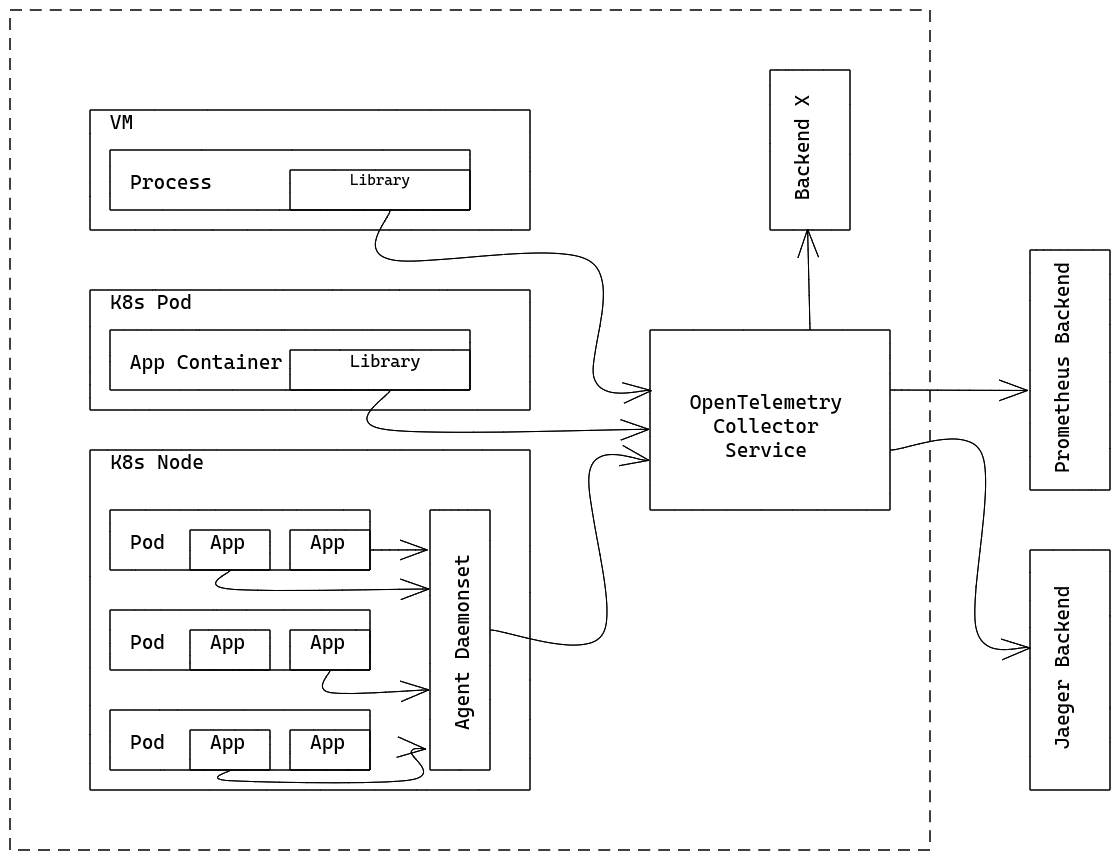
• Gateway mode: OpenTelemetry Collector runs as a gateway instance. It can be deployed with multiple replicas and supports scaling. It receives observable data from Collector in the agent mode or directly generated by the library, or data sent by a third party if the protocol is supported.
OpenTelemetry Operator is an implementation of the OpenTelemetry project that follows Kubernetes Operator. It mainly has two features:
For more information about CRD configuration, see API documentation. The following are two main types of configuration:
• Instrumentation: The configuration of the probe of the Opentelmetrics Collector, which can automatically inject and configure probes.
• OpenTelemetryCollector: Deploy the OpenTelmetrics Collector directly and configure the pipeline.
These two CRDs are also related to the preceding working mode of OpenTelmetrics.
In the following YAML example, an OpenTelemetry Collector instance named simplest is created. The instance contains a receiver, a processor, and an exporter.
kubectl apply -f - <<EOF
apiVersion: opentelemetry.io/v1alpha1
kind: OpenTelemetryCollector
metadata:
  name: otel
spec:
  config: |
    receivers:
      otlp:
        protocols:
          grpc:
          http:
    processors:
      memory_limiter:
        check_interval: 1s
        limit_percentage: 75
        spike_limit_percentage: 15
      batch:
        send_batch_size: 10000
        timeout: 10s
    exporters:
      logging:
    service:
      pipelines:
        traces:
          receivers: [otlp]
          processors: []
          exporters: [logging]
EOF
After deployment, you can see that some labels have been added to the Collector, among which the more effective one is: app.kubernetes.io/managed-by:opentelemetry-operator. This label will take effect in later upgrade control.

OpenTelemetry Operator automatically scans for collectors with the label "app.kubernetes.io/managed-by": "opentelemetry-operator". It updates the collectors to the latest version.
You can set the Spec.UpgradeStrategy parameter to control the upgrade of the collector of the current pod.
• Automatic: upgrade
• None: do not upgrade
You can set the Spec.Mode parameter to control the deployment mode of the collector. Collectors support three deployment modes: DaemonSet, Sidecar, or Deployment (default).
The deployment of DaemonSet and Deployment is relatively simple. You only need to start a pod.
The Sidecar mode is a bit special. The following example shows how to deploy an application in sidecar mode:
kubectl apply -f - <<EOF
apiVersion: opentelemetry.io/v1alpha1
kind: OpenTelemetryCollector
metadata:
  name: sidecar-for-my-app
spec:
  mode: sidecar
  config: |
    receivers:
      jaeger:
        protocols:
          thrift_compact:
    processors:
    exporters:
      logging:
    service:
      pipelines:
        traces:
          receivers: [jaeger]
          processors: []
          exporters: [logging]
EOF
kubectl apply -f - <<EOF
apiVersion: v1
kind: Pod
metadata:
  name: myapp
  annotations:
    sidecar.opentelemetry.io/inject: "true"
spec:
  containers:
  - name: myapp
    image: jaegertracing/vertx-create-span:operator-e2e-tests
    ports:
      - containerPort: 8080
        protocol: TCP
EOF
If you want to deploy a collector in Sidecar mode for an application, you need to
When the annotation value is true, the Operator automatically finds the corresponding OpenTelemetryCollector object and starts the collector in SideCar mode based on this configuration as a service pod.
Probes are used in the proxy mode of OpenTelemetry Collector. Collectors act as agents for receiving and forwarding data, while probes act as agents for generating and sending data.
The following is a sample instrumentation configuration. The exporter defines the address of the collector to which probe data is sent.
kubectl apply -f - <<EOF
apiVersion: opentelemetry.io/v1alpha1
kind: Instrumentation
metadata:
  name: my-java-instrumentation
spec:
  exporter:
    endpoint: http://otel-collector:4317
  propagators:
    - tracecontext
    - baggage
    - b3
  java:
    image: ghcr.io/open-telemetry/opentelemetry-operator/autoinstrumentation-java:latest
  nodejs:
    image: ghcr.io/open-telemetry/opentelemetry-operator/autoinstrumentation-nodejs:latest
  python:
    image: ghcr.io/open-telemetry/opentelemetry-operator/autoinstrumentation-python:latest
  dotnet:
    image: ghcr.io/open-telemetry/opentelemetry-operator/autoinstrumentation-dotnet:latest
  env:
    - name: OTEL_RESOURCE_ATTRIBUTES
      value: service.name=your_service,service.namespace=your_service_namespace
EOF
After you create an instrumentation, you need to add annotations to the pods. OpenTelemetry Operator automatically scans the pods that contain the specified annotations, and then automatically injects probes and the corresponding configurations. You can add annotations to the namespace or to the pod.
The following are annotations for different languages:
Java:
instrumentation.opentelemetry.io/inject-java: "true"NodeJS:
instrumentation.opentelemetry.io/inject-nodejs: "true"Python:
instrumentation.opentelemetry.io/inject-python: "true"DotNet:
instrumentation.opentelemetry.io/inject-dotnet: "true"SDK:
instrumentation.opentelemetry.io/inject-sdk: "true"The annotation value could be:
• "true": If the probe instrumentation is loaded in the namespace, you can inject this instrumentation by setting the annotation value to true in the pod.
• "false": Do not inject.
• "my-instrumentation": The probe configuration in the current namespace.
• "my-other-namespace/my-instrumentation": The probe configuration in other namespaces.
Take a Java application as an example:
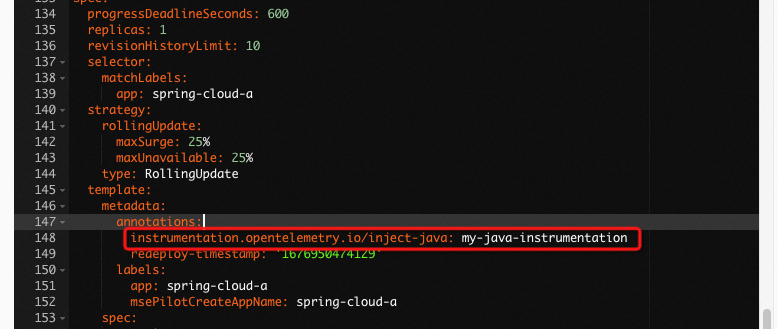
View the Deployment of the business container after you add an annotation, you can see that OpenTelemetry Operator mainly does the following things:
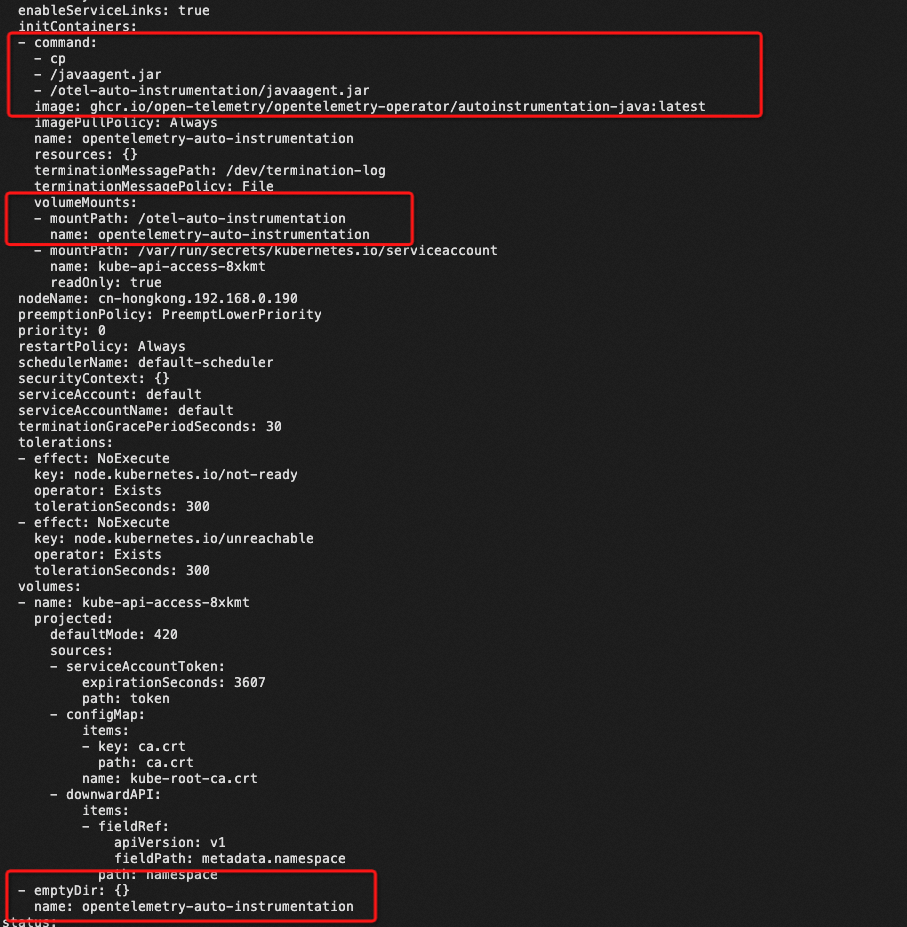
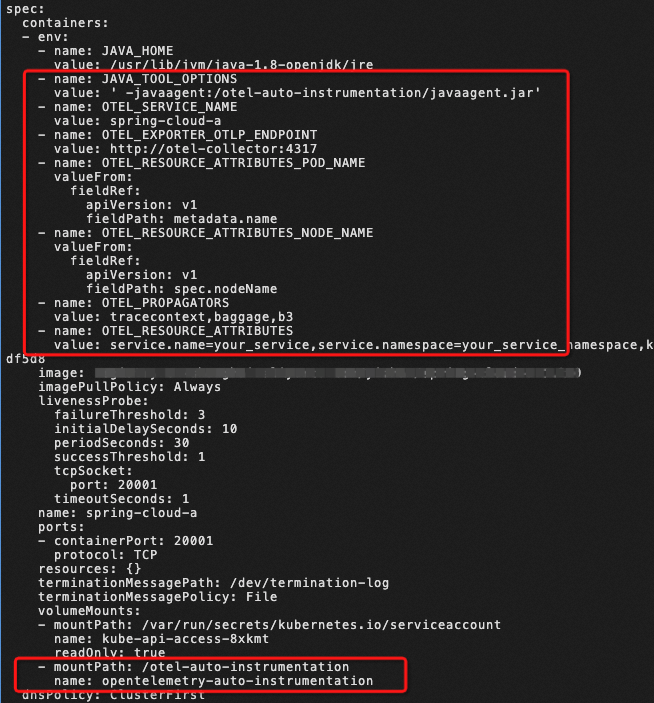
Thereby, after the business container is restarted, the Java agent of OpenTelemetry is automatically added to the business process to generate and send monitoring data.
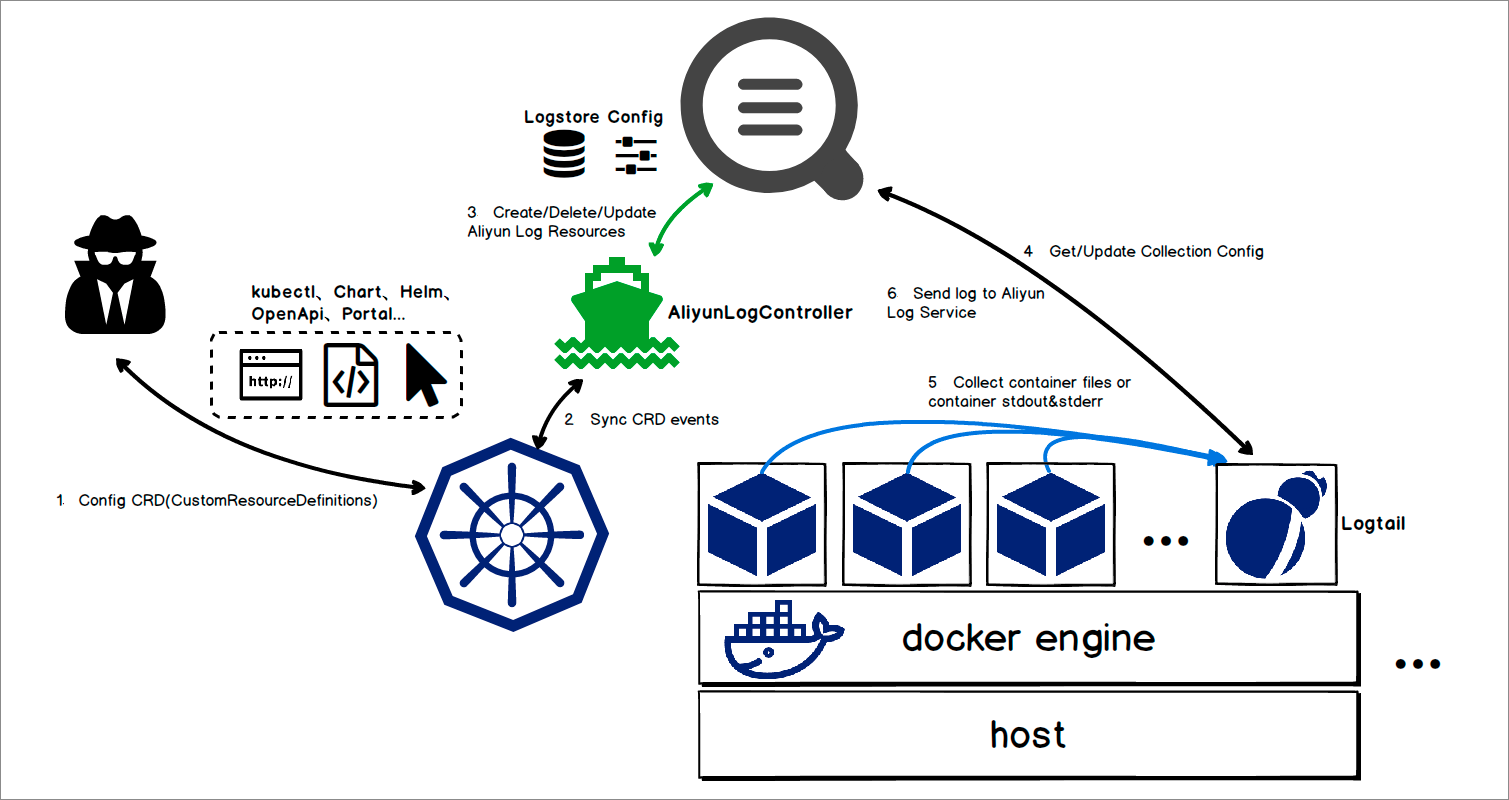
AliyunLogController is the implementation of Kubernetes Operator in Logtail. The main features are as follows:
• Support creating Logtail configurations and collecting stdout logs and text logs by using CRDs.
• Support Log Service management and creating projects, logstores, and machine group resources.
Compared with Fluent Operator and Opentelemetry Operator, AliyunLogController can be improved in the following areas:
• Configuration isolation at the namespace level
AliyunLogController currently only supports a single CRD at the cluster level. In a scenario where multiple teams are utilizing the same cluster with different namespaces, cluster-level CRDs may not be suitable.
• Verification of CRD data fields
Introducing a webhook mechanism to validate the fields of user-defined CRDs, enabling timely user feedback in case of any issues.
• Control of Logtail installation and deployment, especially optimization of installation and deployment in Sidecar mode
Currently, manual creation and application of deployment templates are required to set up Logtail in Sidecar mode. Users can refer to the implementation of Opentelemetry Operator for automatic injection.
• Control of third-party components and probes
Logtail is integrating with third-party components and various open-source probes or SDKs such as OpenTelemetry and Pyroscope. Employing Operator is a viable solution for unified control.
Use the aggregator_context Plug-in to Enable Contextual Query and LiveTail

675 posts | 56 followers
FollowAlibaba Developer - June 30, 2020
DavidZhang - January 15, 2021
Alibaba Cloud Native Community - August 14, 2024
Alibaba Developer - April 22, 2021
Alibaba Cloud Community - April 17, 2024
Alibaba Cloud Community - August 2, 2022

675 posts | 56 followers
Follow Simple Log Service
An all-in-one service for log-type data
Learn More Log Management for AIOps Solution
Log into an artificial intelligence for IT operations (AIOps) environment with an intelligent, all-in-one, and out-of-the-box log management solution
Learn More Cloud-Native Applications Management Solution
Accelerate and secure the development, deployment, and management of containerized applications cost-effectively.
Learn More Container Service for Kubernetes
Alibaba Cloud Container Service for Kubernetes is a fully managed cloud container management service that supports native Kubernetes and integrates with other Alibaba Cloud products.
Learn MoreMore Posts by Alibaba Cloud Native Community