By Dumin
This article introduces how to use the aggregator_context plug-in to maintain the context of logs and how to query the context in the console.
When troubleshooting, users often need to view business log files to locate faults. However, when using Simple Log Service to collect business logs, different logs (such as files in different directories on the same host, or different container files or stdout on the same Kubernetes cluster node) stored in the same logstore may prevent users from obtaining the full context of a log file by clicking the Query/Analysis button on the console.
To address this issue, Log Service provides the Contextual Query and LiveTail features, allowing users to quickly and intuitively view the content in the same log file:
• Contextual Query: Users can directly query the context of a log after specifying it in a logstore.
• Livetail: The latest log of the file where the specified log is located is displayed in real time, which is similar to running the tail –f command on the file..
However, before Logtail 1.2.1, the preceding two features were only applicable to scenarios where the fixed parsing mode is used to parse logs, such as simple mode and full regex mode. If you use an additional Logtail plug-in to improve log parsing capabilities or collect the container stdout, the preceding two features no longer take effect. After Logtail 1.2.1, you can configure an aggregator_context plug-in to use the preceding two features when you use a Logtail plug-in to process logs or collect the container stdout.
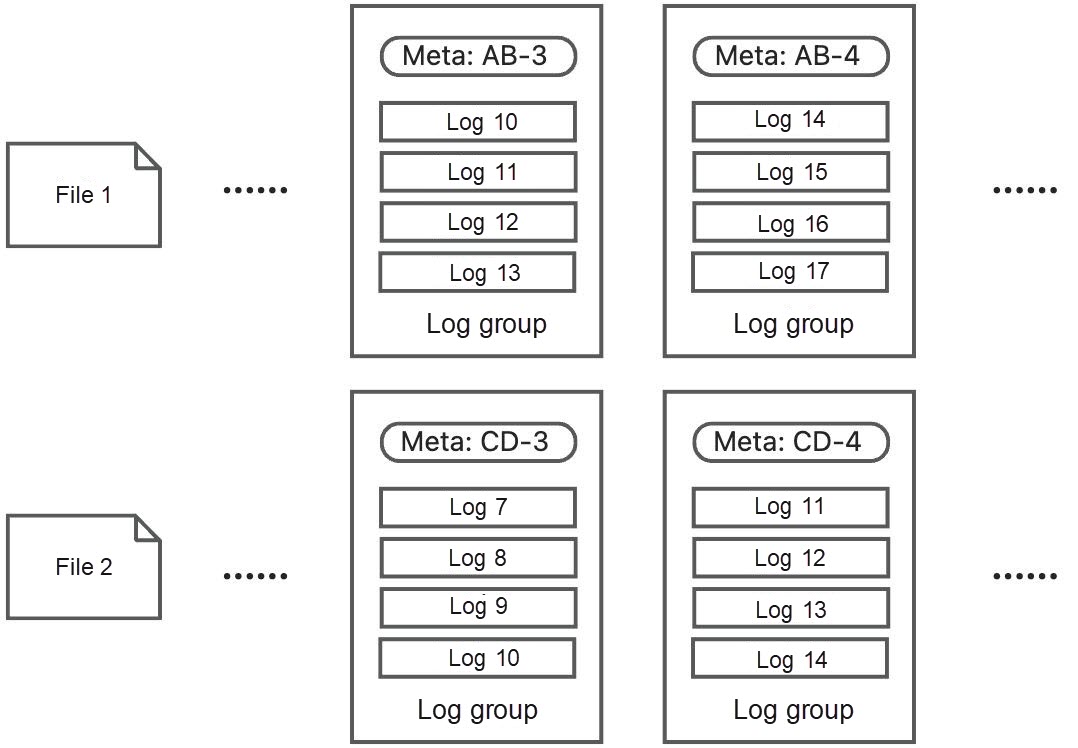
Logtail delivers log data in batch mode. That means multiple logs are packaged in the same log group for delivery. In this mode, Logtail uses the following policies when packaging log data to efficiently obtain the context of a log or use Livetail to view the log:
• Only logs from the same source are stored in the same log group, and the unique identifier and serial number representing the log source are recorded in the metadata of the log group. The logs in the group are arranged in chronological order.
• For log groups that store logs from the same source, the sequence numbers of the log groups increase in chronological order.
In this mode, each log is uniquely identified by a binary combination of log group identifier and serial number. The Log Server accordingly indexes the binary combination, which allows you to quickly search for the log context.

However, limited by the design of the Logtail plug-in system, Logtail before version 1.2.1 cannot implement the preceding policies when users use the plug-in system to process data or collect the container stdout. Specifically, because the input module of the plug-in system transmits information to subsequent modules in the form of logs, the source information of logs is missing after leaving the input module. As a result, logs from the same source cannot be put into the same log group in the log packaging stage (that is, the aggregation module), which eventually leads to the failure of Contextual Query and Livetail.

To resolve this issue, Logtail adds log source information to the data interaction between existing modules. It also adds an aggregator_context plug-in. In this way, the source information of logs is retained, so the plug-in can package logs according to the preceding log packaging policy, thus realizing Contextual Query and LiveTail.
The following describes how to set the collection configuration to use the Contextual Query and LiveTail features when using Logtail plug-ins to process logs or collect the container stdout.
If you use a Logtail plug-in to parse text logs when collecting text logs, you must additionally configure an aggregator_context plug-in:
{
  "global": {...},
  "processors": [...],
  "aggregators": [
    {
      "type": "aggregator_context",
      "detail": {}
    }
  ]
}
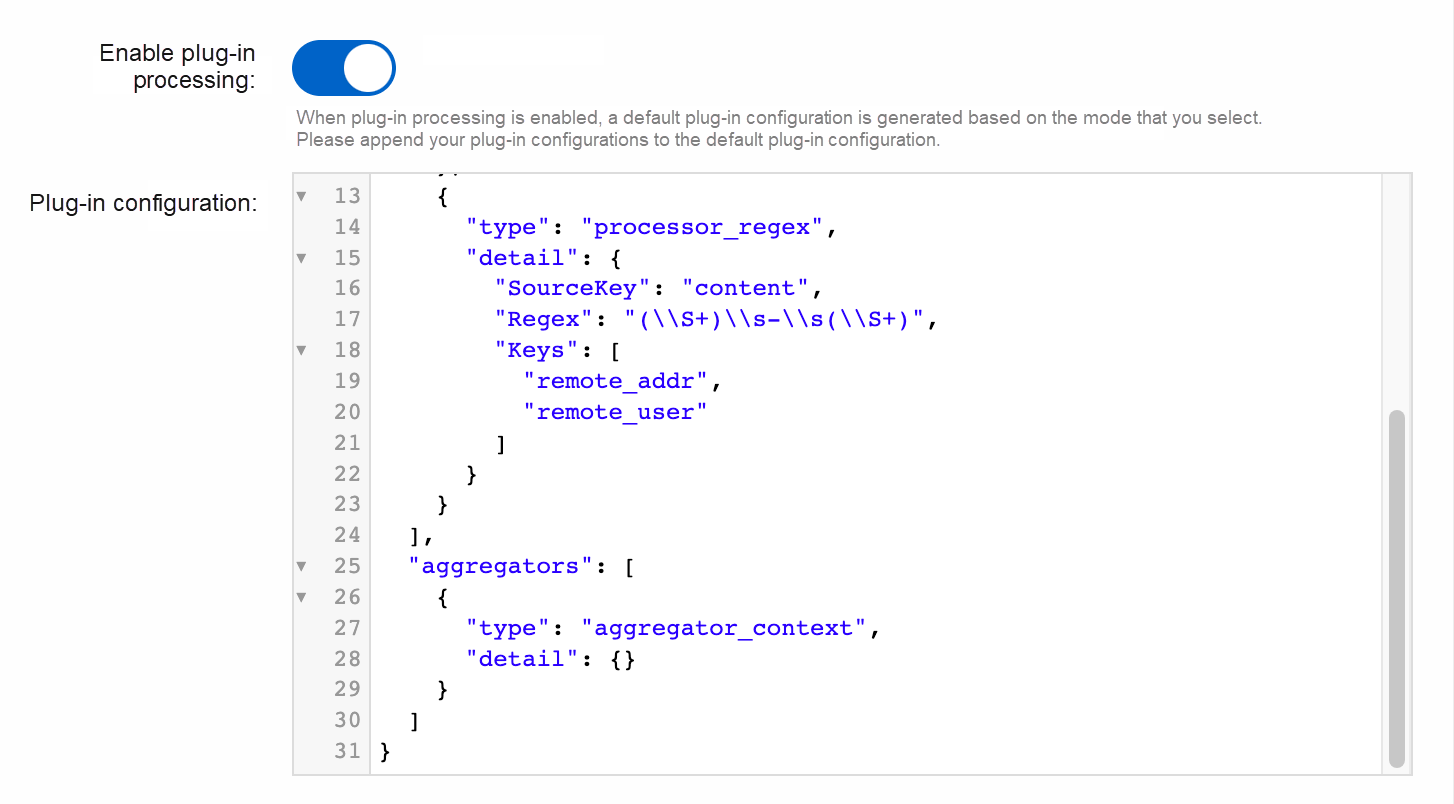
• Example: If you use a Logtail plug-in to parse a single-line regex log, enter the following code in the plug-in configuration box in the console:
{
  "global": {
    "DefaultLogQueueSize": 10
  },
  "processors": [
    {
      "type": "processor_split_log_string",
      "detail": {
        "SplitKey": "content",
        "PreserveOthers": true
      }
    },
    {
      "type": "processor_regex",
      "detail": {
        "SourceKey": "content",
        "Regex": "(\\S+)\\s-\\s(\\S+)",
        "Keys": [
          "remote_addr",
          "remote_user"
        ]
      }
    }
  ],
  "aggregators": [
    {
      "type": "aggregator_context",
      "detail": {}
    }
  ]
}
When you collect the container stdout, you also need to additionally configure an aggregator_context plug-in:
{
  "inputs": [
    {
      "detail": {
        "Stdout": true,
        "Stderr": true
      },
      "type": "service_docker_stdout"
    }
  ],
  "aggregators": [
    {
      "type": "aggregator_context",
      "detail": {}
    }
  ]
}Select a log that you want to manage and click the  icon in the upper-left corner to go to the Context Query page.


You can scroll up and down on the current page to view the context of the specified log. The following are the features of the buttons on the page:
• To scroll up, click Earlier.
• To scroll down, click New.
• To highlight strings, enter the strings in the Highlight field. Then, the strings are highlighted in red.
• To filter logs by string, enter strings in the Filter by text box. Then, the Context View section displays only the logs that contain the specified strings.
• To filter logs by field, select a field from the Filter by Field drop-down list.
Select a log that you want to manage and click the  icon in the upper-left corner to go to the LiveTail page.


The latest log data of the log file is displayed at the bottom of the page in real time. The following are the features of the buttons on the page:
• To highlight strings, enter the strings in the Highlight field. Then, the strings are highlighted in red.
• To filter logs by string, enter strings in the Filter by text box. Then, the Context View section displays only the logs that contain the specified strings.
• To filter logs by field, select a field from the Filter by Field drop-down list.
Alibaba Group's Practice of Accelerating Large Model Training Based on Fluid

703 posts | 57 followers
FollowAlibaba Cloud Storage - June 19, 2019
Alibaba Cloud Native Community - August 11, 2025
Alibaba Cloud Native Community - July 15, 2025
ApsaraDB - June 16, 2023
Data Geek - February 21, 2025
5927941263728530 - May 15, 2025

703 posts | 57 followers
Follow Simple Log Service
An all-in-one service for log-type data
Learn More Storage Capacity Unit
Plan and optimize your storage budget with flexible storage services
Learn More Cloud-Native Applications Management Solution
Accelerate and secure the development, deployment, and management of containerized applications cost-effectively.
Learn More Container Service for Kubernetes
Alibaba Cloud Container Service for Kubernetes is a fully managed cloud container management service that supports native Kubernetes and integrates with other Alibaba Cloud products.
Learn MoreMore Posts by Alibaba Cloud Native Community