Released by ELK Geek
By Liu Xiaoguo, an Evangelist of the Elasticsearch Community in China, and edited by Lettie and Dayu
Redis is widely used as it is easy to use. However, the Redis server and cluster management could be challenging. For example, disk failures or insufficient memory may lead to crashes. Such scenarios require Redis logs collection, analysis, and monitoring for managing Redis servers effectively.
Redis is a very fast NoSQL data storage. Although mainly used for caching, Redis is also applied in a wide range of scenarios, including graphical representation and search. A client library for Redis is available in all major programming languages and is offered as a managed service by top cloud service providers. Over the past few years, Redis has been rated as the most popular database by the Stack Overflow developers.
This article describes how to collect Redis server logs by using the Beats plug-in provided by Alibaba Cloud and implement visualized monitoring through the Kibana service of Alibaba Cloud Elasticsearch. This will give you a better understanding of how Redis operates.
The Remi repository provides the latest version of Redis. Therefore, install the latest version of Redis through YUM of the Remi repository.
Note: The default port of the Redis server is 6379. Before using it, enable the security group on the ECS instance.
#####Install the Remi source by using the EPEL source#####
# yum -y install epel-release
# yum -y install http://rpms.remirepo.net/enterprise/remi-release-7.rpm
#####Install the Redis server by specifying --enablerepo
# yum --enablerepo=remi install -y redis

#####View the Redis server version########
# redis-cli --version
redis-cli 5.0.9

####Start the Redis server #######
# systemctl start redis
####Enable auto start upon system startup######
# systemctl enable redis
# systemctl status redis

####Perform a ping test###
# redis-cli ping
PONG
####View the Redis process####
# ps -ef | grep redis
redis    20777     1  0 11:18 ?        00:00:00 /usr/bin/redis-server 127.0.0.1:6379
root 20805 20430 0 11:23 pts/0 00:00:00 grep --color=auto redisThe default path of the configuration file is /etc/redis.conf if Redis is installed through YUM. Run the following command to define the file name of Redis logs:
bind 127.0.0.1
logfile /var/log/redis/redis-server.log
Notes:
bind: the listening IP address of Redis.
logfile: the name of the Redis log file. Set it to redis-server.log.
Run the following command to restart Redis:
systemctl restart redisRun the following commands to test Redis:
# redis-cli
127.0.0.1:6379> set name dayu
OK
127.0.0.1:6379> get name
"dayu"
127.0.0.1:6379> del  name
(integer) 1
Run the preceding commands to set the value of the key named "dayu" to 1, retrieve the value, and then delete it. Press Ctrl+C to exit the redis-cli.
The Redis module of Filebeat delivers Redis logs to Elasticsearch and visualize them in Kibana. It sets the default configuration for Filebeat (including the log file path and the Redis server endpoint), sets the extraction pipeline to automatically resolve the Redis logs into Elasticsearch fields, and deploys visualization capabilities and dashboards to facilitate log analysis in Kibana.
Access the Kibana console and click the Kibana icon in the upper-left corner.
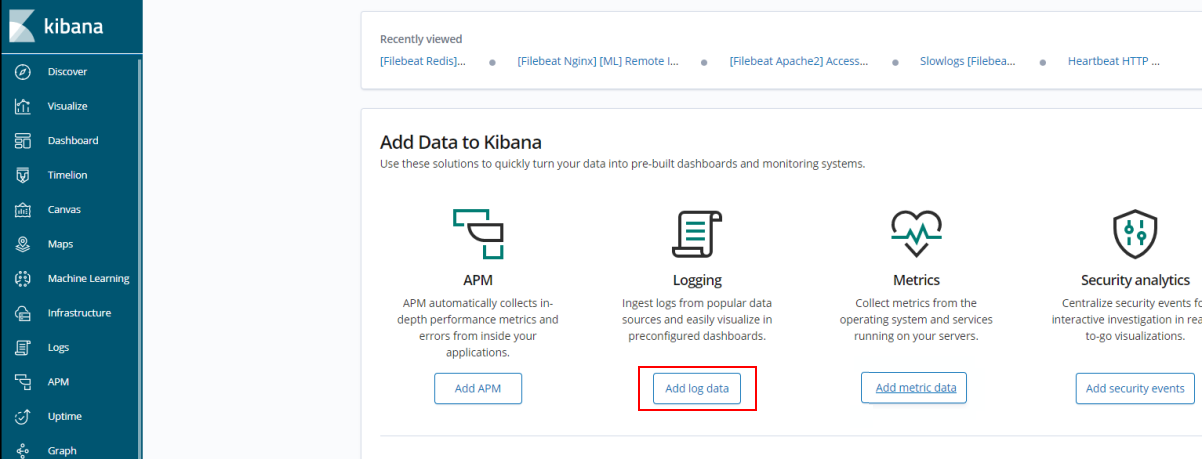
Click "Add log data".
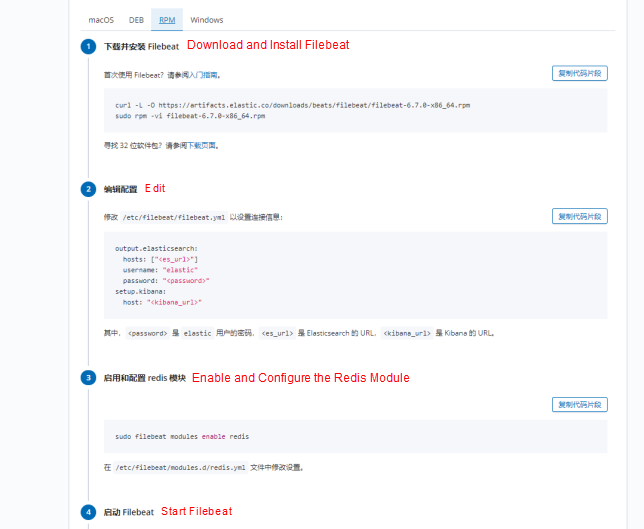
The installation process starts. Run the commands shown in the figure to install Filebeat.
 curl -L -O https://artifacts.elastic.co/downloads/beats/filebeat/filebeat-6.7.0-x86_64.rpm
# sudo rpm -vi filebeat-6.7.0-x86_64.rpm
Configure the filebeat.yml file.
setup.kibana:

  # Kibana Host
  # Scheme and port can be left out and will be set to the default (http and 5601)
  # In case you specify and additional path, the scheme is required: http://localhost:5601/path
  # IPv6 addresses should always be defined as: https://[2001:db8::1]:5601
  host: "https://es-cn-0pp19tb17****jc8p.kibana.elasticsearch.aliyuncs.com:5601"

output.elasticsearch:
  # Array of hosts to connect to.
  hosts: ["es-cn-0pp19tb17****jc8p.elasticsearch.aliyuncs.com:9200"]

  # Enabled ilm (beta) to use index lifecycle management instead daily indices.
  #ilm.enabled: false

  # Optional protocol and basic auth credentials.
  #protocol: "https"
  username: "elastic"
  password: "Elastic@432"
Complete Redis monitoring without any configuration work. If you need to customize the settings, run the following command to enable and configure the Redis module:
# sudo filebeat modules enable redis
Enabled redis
On Alibaba Cloud, run the following commands to start Filebeat.
Note: When installing or upgrading Filebeat or after enabling a new module, run the setup command.
# sudo filebeat setup
# sudo service filebeat start
Starting filebeat (via systemctl):                         [  OK  ]
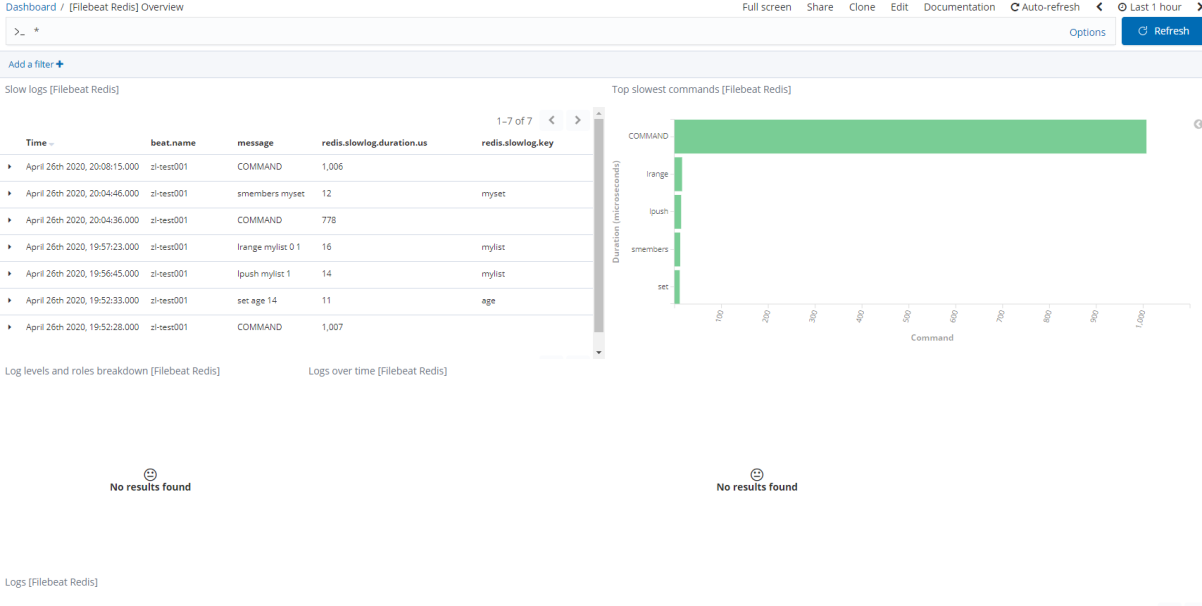
View the Redis logs on Kibana's dashboard.
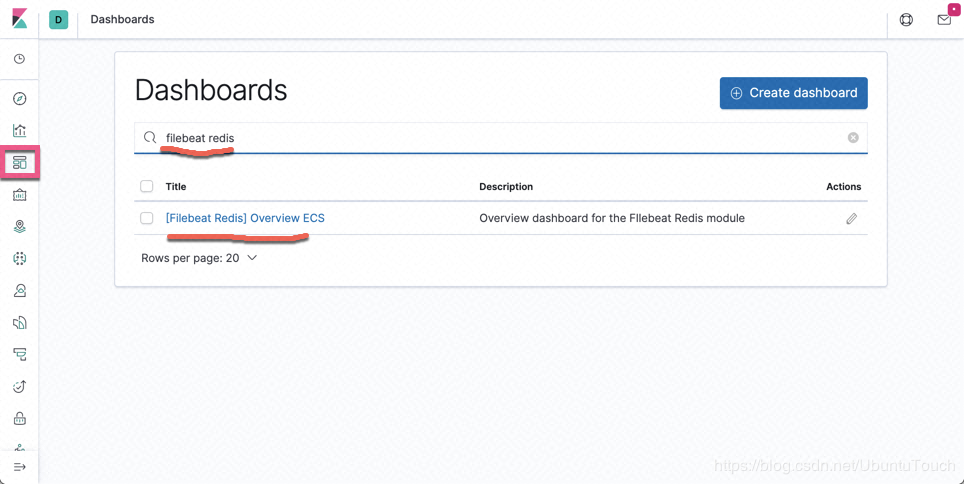
The following figure shows the overview interface of Redis.
Use the Redis module of Metricbeat to collect data periodically from the Redis server.
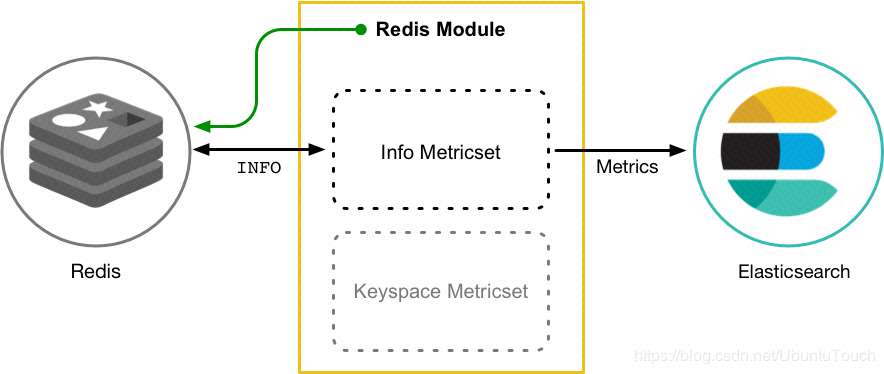
Metricbeat consists of modules and metricsets. Metricbeat modules define the basic logic for collecting data from specific services, such as Redis and MySQL. The Redis module specifies service details, such as service connection, metrics collection frequency, and metrics to be collected.
Each module has one or more metricsets that it uses to acquire and construct data. Instead of collecting each metric as a separate event, a metricset retrieves a list of multiple related metrics in a single request it makes to a remote system. For example, the Redis module provides an information metricset that collects information and statistics from Redis by running the INFO command and parsing the output.
Install Metricbeat. First, start Kibana.
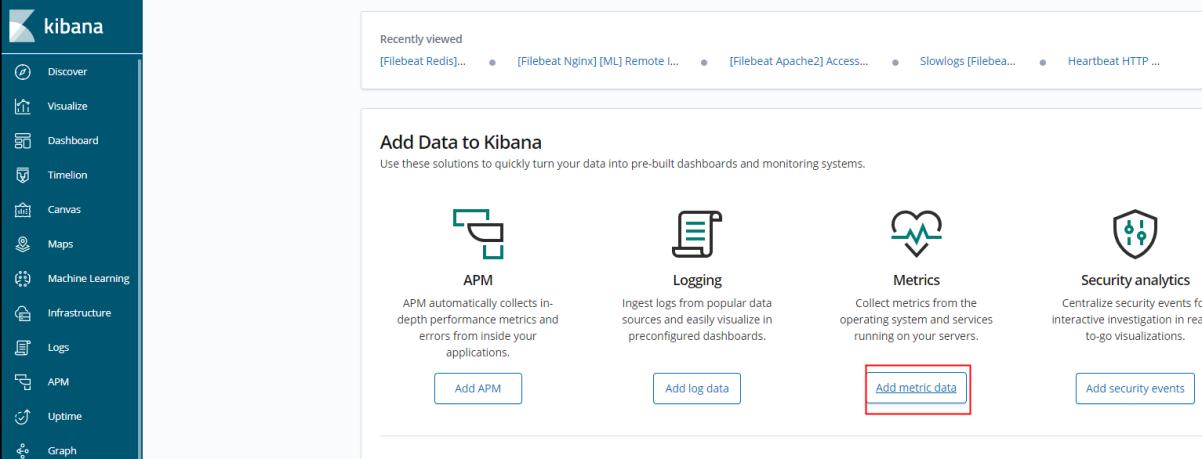
Click Add metric data and perform operations as prompted in the following figure.
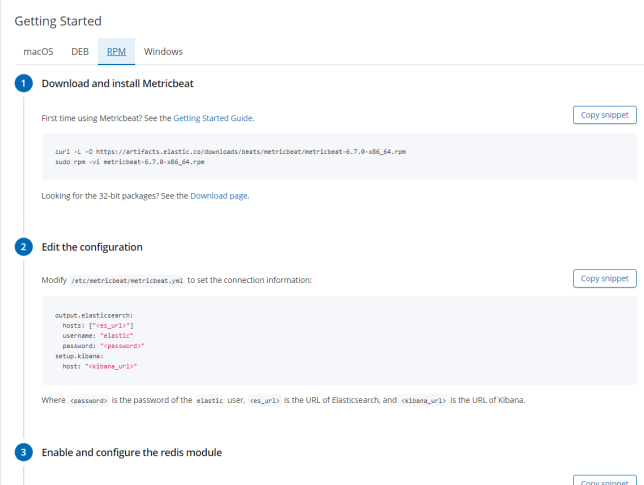
Run the following commands to install Metricbeat:
# curl -L -O https://artifacts.elastic.co/downloads/beats/metricbeat/metricbeat-6.7.0-x86_64.rpm
# sudo rpm -vi metricbeat-6.7.0-x86_64.rpm
If necessary, run the following commands to configure the Redis module of Metricbeat:
# vim /etc/metricbeat/metricbeat.yml
setup.kibana:

   host: "https://es-cn-4591jumei****1zp5.kibana.elasticsearch.aliyuncs.com:5601"
output.elasticsearch:
  # Array of hosts to connect to.
  hosts: ["es-cn-4591jumei****1zp5.elasticsearch.aliyuncs.com:9200"]

  # Enabled ilm (beta) to use index lifecycle management instead daily indices.
  #ilm.enabled: false
  #protocol: "https"
  username: "elastic"
  password: "Elastic@432"
Start the Redis module.
# sudo metricbeat modules enable redis
Enabled redis

#####Start the Metricbeat service########
# sudo metricbeat setup
# sudo service metricbeat start
Go to the Kibana dashboard to view the Redis metrics.
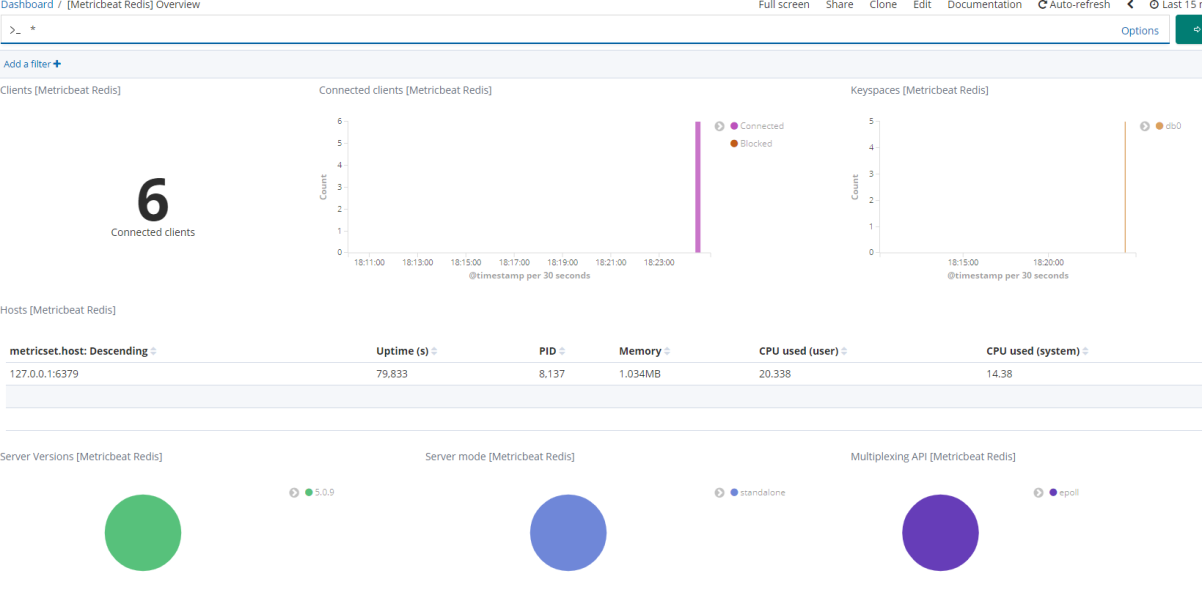
Redis is an important part of many enterprise systems. DevOps engineers must ensure that it runs properly. Metric analysis information obtained from Redis logs improves troubleshooting capabilities, for example, by resolving alerts through configurations. More importantly, these metrics help employees easily understand the key issues that affect application stability.
When a key issue affects application stability, logs are transmitted to the Alibaba Cloud Elastic Stack for rapid analysis. This allows quick troubleshooting and restores the system with minimal application interruption.
Statement: This article is an authorized revision of the article "Beats: Use Elastic Stack to Monitor Redis" based on the Alibaba Cloud service environment.
Source: (in Chinese) https://elasticstack.blog.csdn.net/
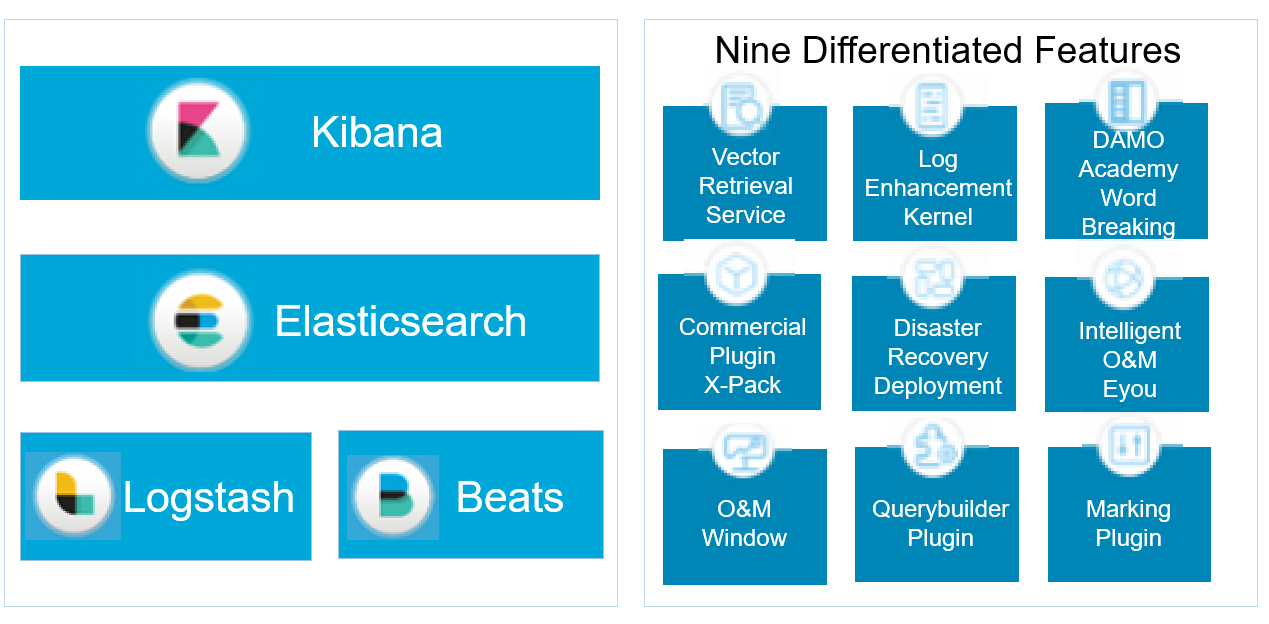
Alibaba Cloud Elastic Stack is completely compatible with open-source Elasticsearch and has nine unique capabilities.

2,593 posts | 794 followers
FollowAlibaba Clouder - December 29, 2020
Alibaba Cloud Native Community - December 6, 2022
Data Geek - April 8, 2024
Alibaba Clouder - December 29, 2020
Data Geek - May 14, 2024
Data Geek - February 27, 2025

2,593 posts | 794 followers
Follow ApsaraDB for HBase
ApsaraDB for HBase is a NoSQL database engine that is highly optimized and 100% compatible with the community edition of HBase.
Learn More Big Data Consulting for Data Technology Solution
Alibaba Cloud provides big data consulting services to help enterprises leverage advanced data technology.
Learn More Big Data Consulting Services for Retail Solution
Alibaba Cloud experts provide retailers with a lightweight and customized big data consulting service to help you assess your big data maturity and plan your big data journey.
Learn More Simple Log Service
An all-in-one service for log-type data
Learn MoreMore Posts by Alibaba Clouder