By Liu Xiaoguo, an Elastic Community Evangelist in China
Released by ELK Geek
Elasticsearch is a distributed, open-source search and analytics engine that supports all types of data, including text, numbers, geospatial data, structured data, and unstructured data. Elasticsearch was built based on Apache Lucene and was first released by Elasticsearch N.V. (now known as Elastic) in 2010.
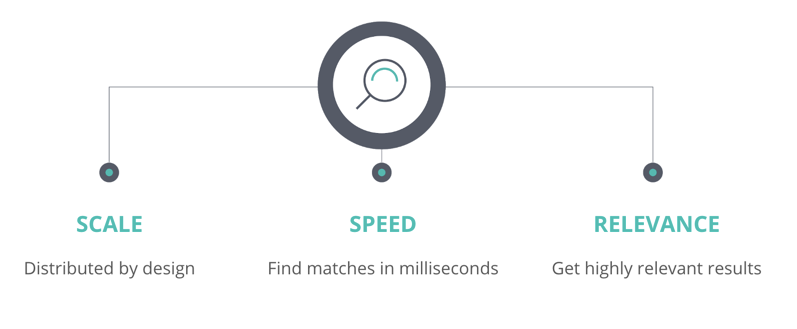
Elasticsearch is famous for its simple RESTful APIs, distributed nature, speed, and scalability. It also provides a search experience with scale, speed, and relevance. These three properties differentiate Elasticsearch from other products, making Elasticsearch very popular.
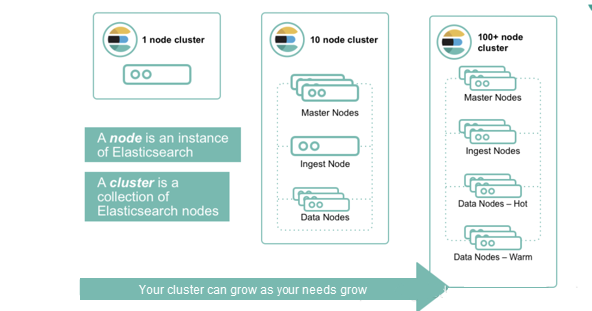
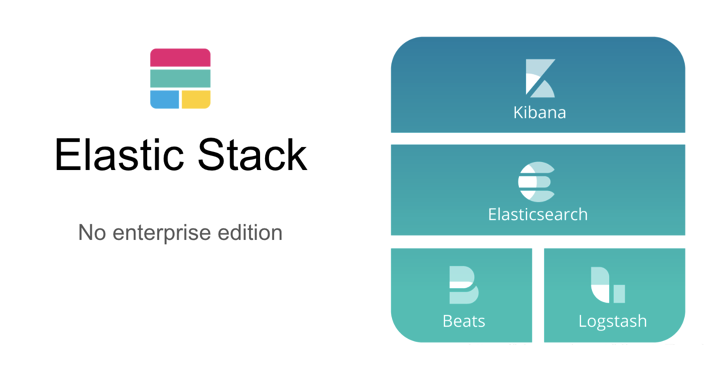
"ELK" is the abbreviation of three open-source projects: Elasticsearch, Logstash, and Kibana. Elasticsearch is a search and analytics engine and also a core component of the Elastic Stack. Logstash is a server-side data processing pipeline that ingests data from a multitude of sources, transforms it, and then sends it to a "storage" similar to Elasticsearch. Beats is a collection of lightweight data collectors that sends data directly to Elasticsearch or to Logstash for further processing before the data goes to Elasticsearch. Kibana allows using charts to visualize data in Elasticsearch.
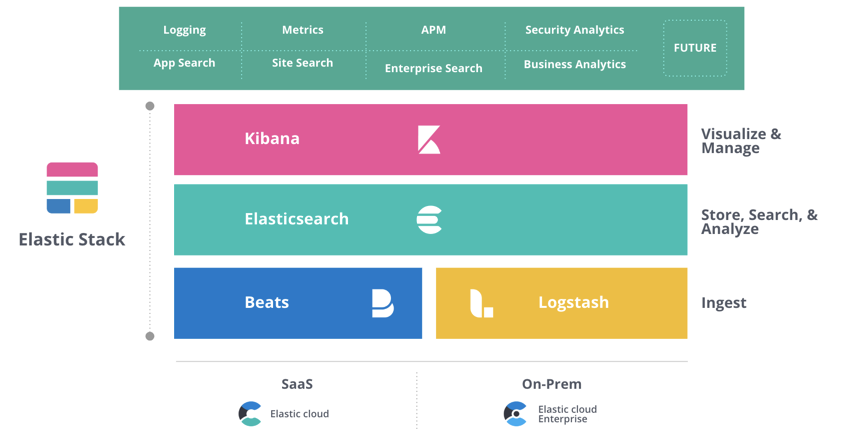
Elastic has provided many out-of-the-box solutions for the Elastic Stack. A lot of search or database companies have good products. However, to implement a solution, they need to expend a lot of effort to combine their products with products provided by other companies. So, Elastic has released the 3+1 Elastic Stack.
Elastic's three major solutions are as follows:
These three solutions are based on the same Elastic Stack: Elasticsearch, Logstash, and Kibana.
In centralized log entries, a data processing pipeline involves three main phases: aggregation, processing, and storage. In the previous ELK Stack, Logstash was responsible for the first two phases. Certain costs are incurred when implementing these phases. Logstash frequently encounters internal problems due to its design as well as performance issues. In complex pipelines, Logstash needs to process a large amount of data. Therefore, it would be helpful to outsource some of Logstash's responsibilities, especially transferring data extraction tasks to other tools. This idea was first reflected in Lumberjack and then in the Logstash transponder. After several development cycles, a new and improved protocol was introduced, which has become the backbone of the "Beats" family.
Beats are a collection of lightweight (resource-efficient, non-dependent, and small) log shippers with open source code. These log shippers function as proxies installed on different servers in the basic structure, where they collect logs or metrics. The collected data can be log files (Filebeat), network data (Packetbeat), server metrics (Metricbeat), or data of other types, which can be collected by the increasing number of Beats developed by Elastic and the community. Beats send collected data to Elasticsearch or Logstash for processing. Beats are built on a Go framework called libbeat, which is used for data forwarding. The community has constantly developed and contributed new Beats.
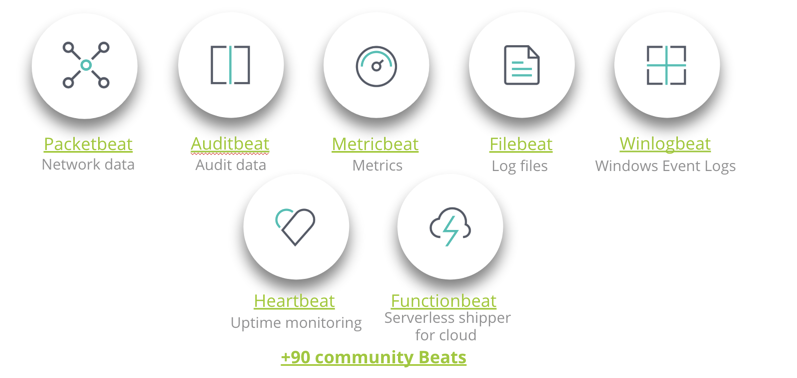
Filebeat is the most commonly used Beat for collecting and transferring log files. A reason why Filebeat is so efficient is the way it handles backpressure. If Logstash is busy, Filebeat will temporarily slow down its read speed.
Filebeat can be installed on almost any operating system. It may also be installed as a Docker container or used for internal modules, including default configurations and Kibaba objects of certain platforms, such as Apache, MySQL, and Docker.
I have presented several examples of how to use Filebeat in my previous articles:
Packetbeat, a network data packet analyzer, was the first Beat introduced. Packetbeat captures network traffic between servers to monitor application programs and performance.
Packetbeat can be installed on monitored servers or a dedicated server. Packetbeat tracks network traffic, decodes protocols, and records data for each transaction. Packetbeat supports DNS, HTTP, ICMP, Redis, MySQL, MongoDB, Cassandra, and other protocols.
Metricbeat is a popular Beat that collects and reports system-level metrics of various systems and platforms. It also supports internal modules that collect statistics from specific platforms. You may use these modules and metricsets to configure how often Metricbeat collects metrics and which specific metrics to collect.
Heartbeat is used for uptime monitoring. Essentially, It has a feature that detects whether services are accessible. For example, it verifies whether the uptime of service meets specific SLA requirements. Just provide a list of URLs and uptime metrics to Heartbeat. It will send the list directly to Elasticsearch or Logstash in order to send it to the stack before indexing.
Auditbeat is used to audit user and process activities on a Linux server. Similar to other traditional system auditing tools, such as systemd and auditd, Auditbeat identifies security vulnerabilities, such as file changes, configuration changes, and malicious behaviors.
Winlogbeat is specifically designed to collect Windows event logs. It analyzes security events and installed updates.
Functionbeat is defined as a "serverless" shipper that is deployed for collecting data and sending the data to the ELK Stack. Functionbeat is designed to monitor cloud environments. It has been tailored for Amazon and can be deployed as an Amazon Lambda function to collect data from Amazon CloudWatch, Kinesis, and SQS.
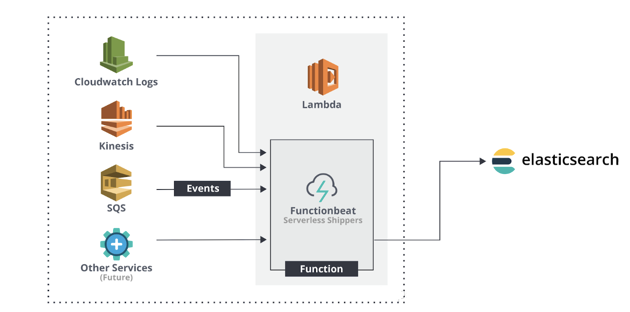
Currently, three methods are used to import data of interest into Elasticsearch.
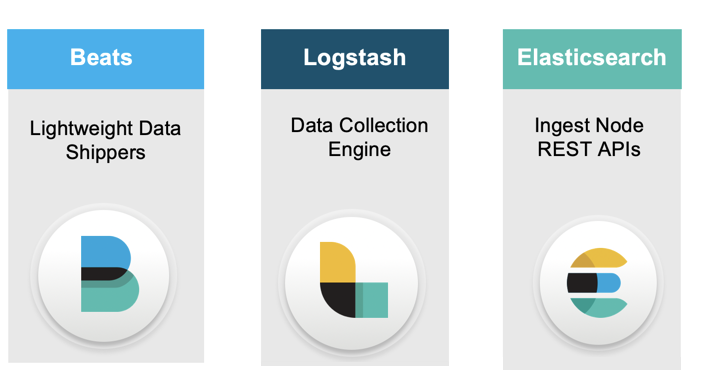
As shown in the preceding figure, these methods are as follows:
1) Beats: Use Beats to import data into Elasticsearch.
2) Logstash: Use Logstash to import data into Elasticsearch. The Logstash data source can also be Beats.
3) RESTful APIs: Import data into Elasticsearch using APIs provided by Elastic, such as Java, Python, Go, and Node.js APIs.
Next, let's see how Beats work with other Elastic Stack components. The following block diagram shows the interworking between different Elastic Stack components.
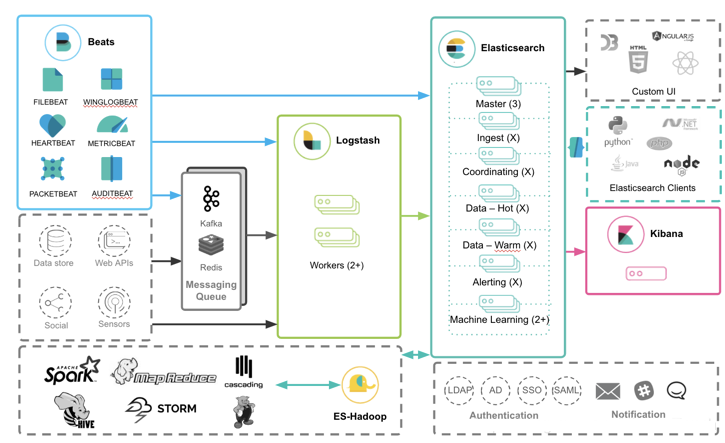
As shown in the preceding figure, Beats data can be imported into Elasticsearch using any one of the following three methods:
Among Elasticsearch nodes, there are some ingest nodes (article in Chinese). Ingest pipelines run on ingest nodes and preprocess documents as follows before indexing.

As shown in the above figure, use the ingest nodes in the Elasticsearch cluster to run defined processors. For more information about these processors, see Processors on the official Elastic website.
Libbeat is a database used for data forwarding. Beats are built on a Go framework called libbeat. Libbeat is open-source software. To view its source code, visit https://github.com/elastic/beats/tree/master/libbeat. Libbeat easily customizes a Beat for any type of data that you want to send to Elasticsearch.
To build your own beat, see the following articles:
Also, refer to my article "How to Customize an Elastic Beat."
A Beat consists of two parts: data collector, and data processor and publisher. Libbeat provides the data processor and publisher.

For more information about the preceding processors, see "Define processors." Some processor examples are as follows.
- add_cloud_metadata
- add_locale
- decode_json_fields
- add_fields
- drop_event
- drop_fields
- include_fields
- add_kubernetes_metadata
- add_docker_metadataFilebeat is a lightweight shipper for forwarding and centralizing log data. As an agent installed on a server, Filebeat monitors the log files or specified locations, collects log events, and forwards them to Elasticsearch or Logstash for indexing. Filebeat features include:
When Filebeat is started, it will start one or more inputs that are found in the location specified for the log data. Filebeat starts a harvester for each log that it finds. Each harvester reads a log to obtain new content and sends the new log data to libbeat. Libbeat summarizes events and sends the summarized data to the output configured for Filebeat.
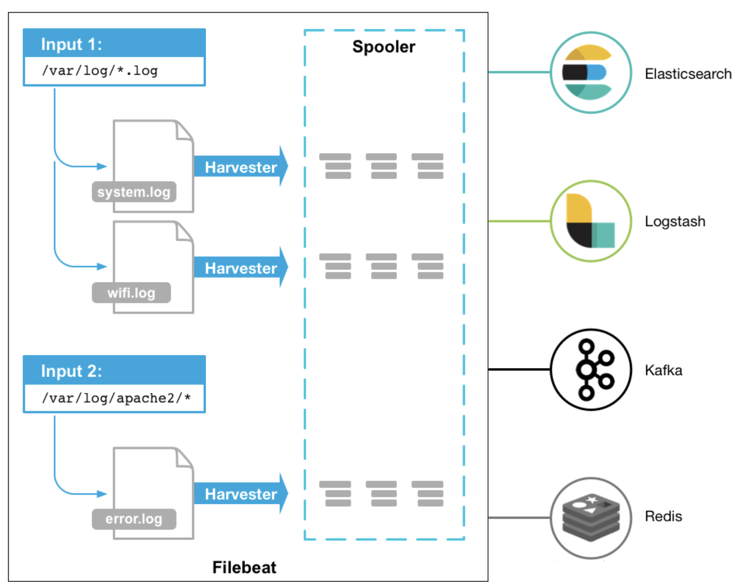
As shown in the above figure, the spooler has cached some data that can be re-sent to ensure event consumption at least once. This mechanism is also used in backpressure-sensitive scenarios. When Filebeat generates events faster than Elasticsearch can handle them, some events are cached.
Metricbeat is a lightweight shipper that can be installed on a server to collect metrics periodically from the operating system and services running on the server. Metricbeat collects the metrics and statistics that services collect and ships them to a specified output, such as Elasticsearch or Logstash.
Metricbeat helps to monitor the server by collecting metrics from systems and services running on the server, including:
Metricbeat features the following:
Metricbeat consists of modules and metricsets. Metricbeat modules define the basic logic for collecting data from specific services, such as Redis and MySQL. They also specify details about services, such as service connection, metrics collection frequency, and metrics to be collected.
Each module has one or more metricsets that acquire and construct data. A metricset does not collect each metric as a separate event but retrieves a list of relevant metrics by a single request to a remote system. For example, the Redis module provides an information metricset that collects information and statistics from Redis by running the INFO command and parsing the output.
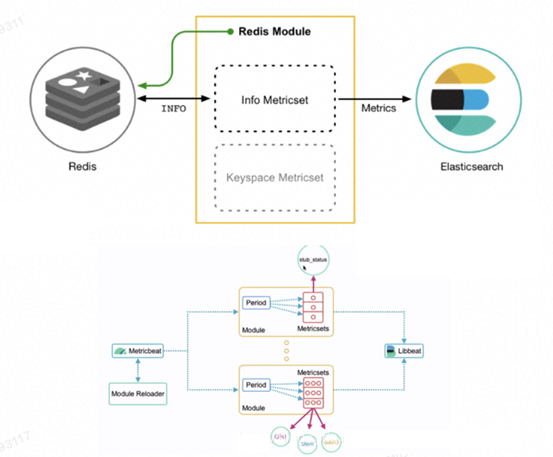
The MySQL module also provides a status metricset that collects data from MySQL by running SHOW GLOBAL STATUS SQL queries. Relevant metricsets are combined in a single request returned by a remote server. If there are no user-enabled metricsets, most modules have default metricsets.
Metricbeat retrieves metrics periodically from the host system based on the cycle specified while configuring a module. Metricbeat reuses connections as much as possible because multiple metricsets send requests to the same service. If Metricbeat fails to connect to the host system within the specified time during timeout configuration, it will return an error. Metricbeat sends events asynchronously, so event retrieval is not acknowledged. If the configured output is unavailable, events may be lost.
The following figure shows the components of a Filebeat module.
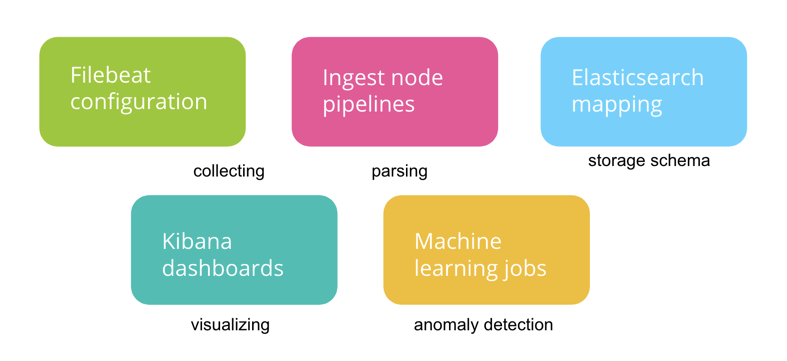
A Filebeat module simplifies the collection, parsing, and visualization of logs in common formats
A typical Filebeat module consists of one or more filesets, such as the access and error filesets for Nginx logs. A fileset contains the following content:
Filebeat automatically adjusts these configurations based on the user environment and loads them into the corresponding Elastic Stack components.
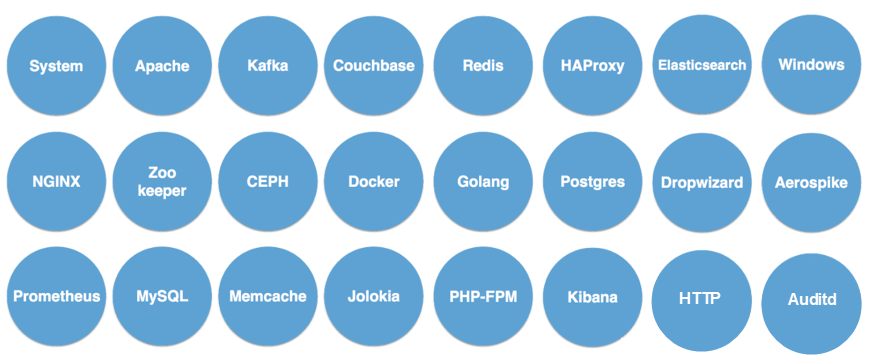
Other Beats modules are basically the same as the Filebeat module. At present, many modules are provided for Elasticsearch.
This article was authorized for publication by the official blog of the CSDN-Elastic China community.
Source title: Beats: Getting Started with Beats (1)
Source link: (Page in Chinese) https://elasticstack.blog.csdn.net/article/details/104432643
The Alibaba Cloud fully-managed Beats collection center offers batch management of Filebeat, Metricbeat, and Heartbeat collection clients.
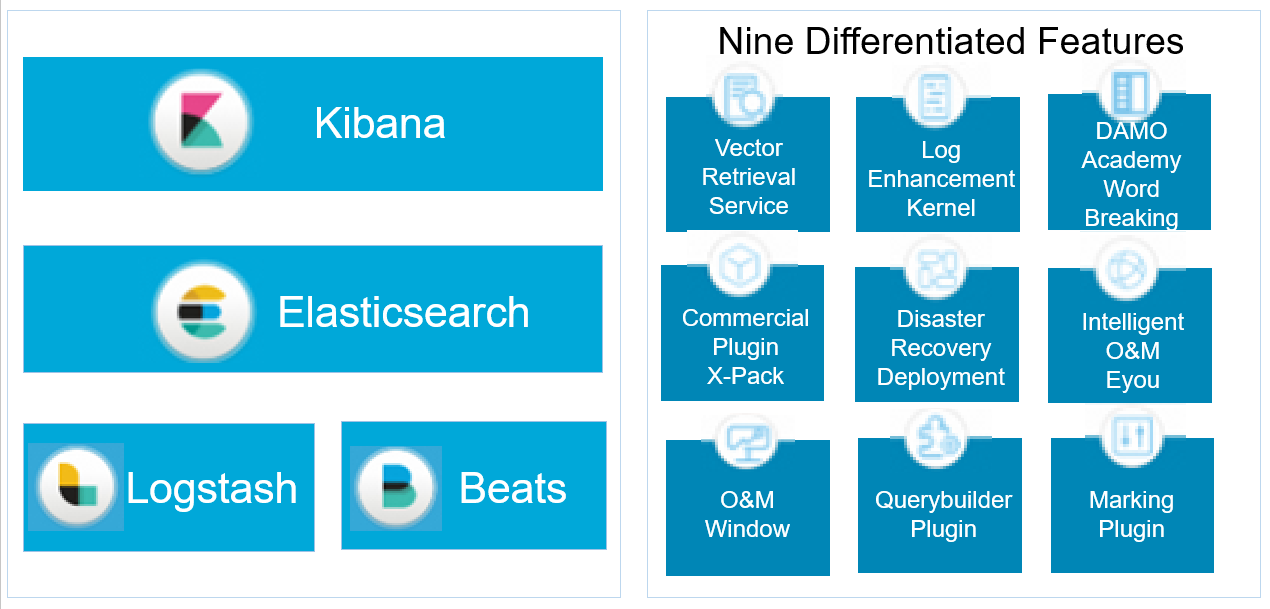
The Alibaba Cloud Elastic Stack is completely compatible with open-source Elasticsearch and has nine unique capabilities.
How Beats Import RabbitMQ Logs to the Alibaba Cloud Elastic Stack for Visual Analysis

2,593 posts | 794 followers
FollowAlibaba Cloud Community - July 15, 2022
Alibaba Clouder - December 29, 2020
Alibaba Clouder - July 25, 2018
Alibaba Cloud Native Community - December 6, 2022
Data Geek - April 11, 2024
Data Geek - July 18, 2023

2,593 posts | 794 followers
Follow Big Data Consulting for Data Technology Solution
Alibaba Cloud provides big data consulting services to help enterprises leverage advanced data technology.
Learn More Big Data Consulting Services for Retail Solution
Alibaba Cloud experts provide retailers with a lightweight and customized big data consulting service to help you assess your big data maturity and plan your big data journey.
Learn More Alibaba Cloud Elasticsearch
Alibaba Cloud Elasticsearch helps users easy to build AI-powered search applications seamlessly integrated with large language models, and featuring for the enterprise: robust access control, security monitoring, and automatic updates.
Learn More Apsara Stack
Apsara Stack is a full-stack cloud solution created by Alibaba Cloud for medium- and large-size enterprise-class customers.
Learn MoreMore Posts by Alibaba Clouder