As frontend user experience (UX) optimization becomes increasingly sophisticated, the challenge for developers has evolved from merely "detecting errors" to truly "understanding user behavior." Traditional, metrics-only monitoring often falls short when tackling "black-box" challenges—such as UI lag without diagnostic logs, or dropping conversion rates with no obvious cause.
As a unified observability platform, Alibaba Cloud's CloudMonitor Service (CMS) 2.0 has been continuously deepening its capabilities in Real User Monitoring (RUM). To help developers pierce through client-side blind spots, the CMS team has introduced Session Replay and 3D Heatmap capabilities.
Powered by incremental DOM recording and multidimensional behavioral analysis, CMS captures and reconstructs the exact visual context of user interactions. Combined with a robust four-tier privacy protection mechanism, it enables developers to seamlessly transition from reproducing individual edge cases to gaining aggregate behavioral insights in a fully compliant manner—completing the UX optimization loop by truly "seeing every user step."
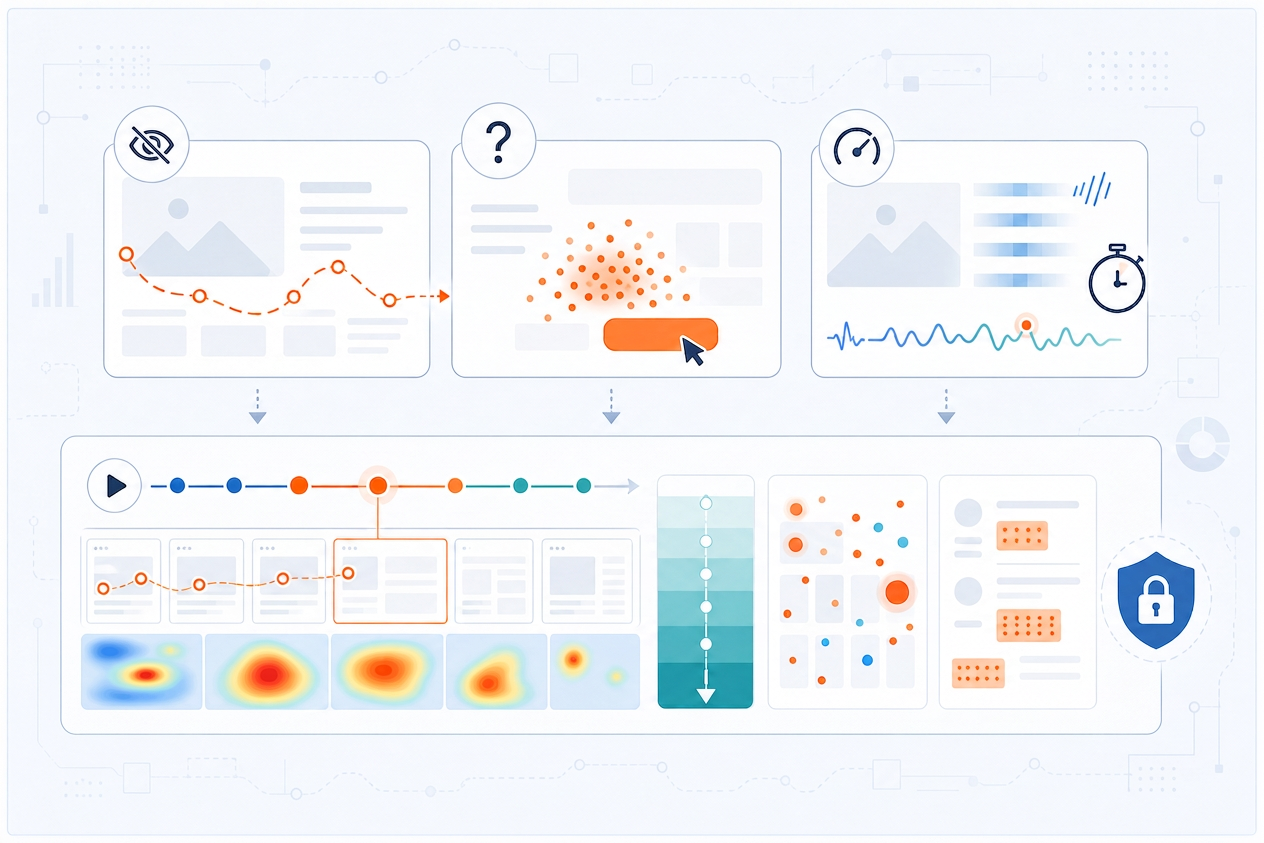
A user reports, "The page seems to have frozen," but you comb through the logs and find no errors. A product manager worries about the conversion funnel but has no idea which button made users hesitate. A customer service ticket reads, "I can't click anything," yet the page works perfectly when you open it. These frontend experience mysteries unfold in countless teams every day. Session Replay and Heatmaps are the ultimate weapons to end this guesswork—one lets you return to the "scene of the incident," and the other reveals "group behavior patterns."
Backend observability already boasts mature tracing, logging, and metrics monitoring systems. However, when issues occur in the browser—the place closest to the user but farthest from the developer—we often hit a blind spot.
A user writes in a ticket, "I clicked the order button, but nothing happened." You check the code, and the logic is fine; the API logs show no invocation records, and the monitoring dashboard looks normal. Was the button obstructed? Did a JavaScript error occur? Was there a network timeout? Or did the user simply miss the click? You cannot reproduce the issue because you never "saw" the page exactly as the user did.
The conversion rate dropped by 3% after a product revamp, but A/B testing only tells you that it is "worse," not "where it is worse." Are users struggling to understand the new navigation layout? Is the price tag not prominent enough? Or is the CTA button placed unintuitively? Without behavioral data, optimization strategies are left to guesswork.
Performance monitoring tells you the LCP is 2.3 seconds, but the "slowness" perceived by the user could stem from a blank first screen, flickering during image loads, or janky scrolling. A single metric cannot capture the complete picture of the user experience.
Session Replay and Heatmaps are the two purpose-built tools designed specifically to eliminate these three blind spots. The former recreates the scene of each individual incident, while the latter reveals group patterns. Together, they deliver the full capability to "see every user step."
The core idea of Session Replay is simple: since you cannot ask the user to reproduce the issue for you, "record" the user's operation process so developers can review it themselves.
Recording here does not mean actual screen recording. The browser SDK reconstructs the user's operation process based on DOM snapshot capture and incremental mutation tracking mechanisms. It records a series of structured DOM event sequences rather than massive video files. This approach not only reduces data volume by an order of magnitude but also achieves pixel-perfect reproduction of page structures and interaction details during playback. It also supports advanced debugging features like arbitrary timeline jumps and local magnification, greatly improving troubleshooting efficiency.
Standard Session Replay view: The left panel lists user events like click and navigation chronologically, accurate to the timestamp. The central area provides a 1:1 reproduction of the page exactly as the user saw it. The bottom timeline supports video-like fast-forward and rewind. The right pane can pinpoint DOM structure changes at any moment. A single replay reveals the full picture of the issue.
Simply put, everything the user sees and does on the page:
Uploading recorded data in real time would place unnecessary stress on the network and battery. Real User Monitoring (RUM) uses segmented upload: The SDK first buffers data locally in segments and performs a flush every 200 events or every 5 seconds (whichever comes first). When the page becomes hidden, frozen, or unloads, the SDK immediately flushes to ensure no data is lost. A single session records for a maximum of 1 hour before automatically segmenting.
The pre-upload compression process is a prime example of the engineering effort behind this system. We adopted a three-tier fallback strategy to strike a balance between performance, compatibility, and reliability:
| Priority | Solution | Applicability | Advantage |
|---|---|---|---|
| ① First choice | Browser native CompressionStream API | Chrome 80+/Safari 16.4+/Firefox 113+ | Zero additional overhead, built into the browser |
| ② Fallback | Web Worker + pako deflate (inlined at build time) | All mainstream browsers | Does not block the main thread; falls back again after a 30-second timeout |
| ③ Last resort | Raw data upload | Constrained environments | Ensures data integrity, even at the cost of speed |
The essence of this mechanism is that a failure at any tier gracefully falls back to the next—enjoying the high efficiency of new APIs without abandoning any legacy users.
What about performance impact? Empirical tests show that Session Replay incurs a CPU overhead of 1–3%and a memory overhead of 2–5MB on standard pages (depending on page complexity). The sampling rate configuration allows you to precisely control the recording scope—10–20% is recommended for production environments, while you can set it to 100% for testing environments.
Recording user operations inevitably involves privacy. The RUM SDK provides a four-tier privacy protection configuration, ranging from the strictest to the most lenient:
| Privacy Level | Description | Applicable Scenarios |
|---|---|---|
| mask (Default) | Masks all text content and input boxes | General scenarios, the most secure choice |
| user-input | Masks only user input content (passwords, input boxes, etc.) | Scenarios where page text information needs to be retained |
| allowlisted | Records only elements specified in the allowlist, and masks other content | Fine-grained control where only specific areas need to be recorded |
| allow | No masking is performed; the complete page is recorded | Internal systems, pages without sensitive information |
In addition, it supports granular control via CSS class names: elements marked with rum-block are completely masked (black blocks), elements marked with rum-ignore are not recorded, and text marked with rum-mask is masked. Compliance and observability can go hand in hand.
Scenario 1: Bug Reproduction. A user reports an intermittent UI anomaly. Previously, you would have to ask the user to "try again and send me a screen recording." Now, you can directly find the corresponding Session Replay in the backend and fast-forward to the exact moment of their operation—DOM structures, style changes, and interaction sequences are crystal clear.
Scenario 2:Conversion Funnel Analysis. An e-commerce checkout flow has 5 steps, and 40% of users drop off at step 3. By replaying the Sessions of these churned users, you discover that a mandatory field in the address form at step 3 is obscured by the keyboard on small-screen devices—an insight impossible to glean from logs and metrics alone.
Scenario 3:Customer Support. A user calls to say, "I spent ages filling out the form, but I can't submit it." Customer service uses the Session ID to find the replay and observes the user repeatedly clicking the date picker to no avail—it turns out the date format prompt was not obvious enough. Pinpoint the issue in 30 seconds, eliminating back-and-forth communication.
While Session Replay helps you see "the story of one person," a Heatmap helps you see "the pattern of a group." When hundreds or thousands of users leave behavioral traces on the same page, the Heatmap aggregates and overlays this data, intuitively displaying the focus of user attention and the distribution of behavior using color intensity.
RUM offers three dimensions: Click Heatmap, Area Heatmap, and Scroll Heatmap. These answer questions from different angles: "Where are users clicking? What are they paying attention to? How much are they seeing?"
The most classic and intuitive Heatmap type. During the capture phase, the SDK listens for page click events, collecting the document coordinates (x, y), relative coordinates within the element (ex, ey), selector path, and viewport size for each click. After the SDK reports the data, the backend overlays all click coordinates onto the page snapshot, using color intensity to indicate click density—red areas are where users love to click the most, while blue areas are neglected "cold zones."
A Click Heatmap of a real e-commerce homepage: The "Interaction Statistics" in the upper right corner shows 1,817 total clicks and 987 page views—averaging nearly 2 clicks per visitor. The "Element Clicks" on the left automatically categorizes elements: input 244 times (13.43%), img 156 times (8.59%), and button 144 times (7.93%), telling you which element types users touch most frequently. The blue-to-red color blocks and numeric rankings on the central page clearly mark the popularity of each clicked area.
RUM's click collection goes beyond "recording coordinates" and performs two tasks rarely seen elsewhere:
target.reaction): Tags such as button, a, input, select, option, textarea, details, summary, audio, and video, or elements with onclick/role=button/tabindex/cursor:pointer attributes, are marked as "interactive." If a non-interactive element receives a large number of clicks, it means users think it should be clickable—this highlights a UI design issue.
target.trust): Multi-dimensional evaluation based on event source (isTrusted), element size (less than 20px is considered untrustworthy), and visibility (display:none/visibility:hidden/opacity:0). Filtering out automated scripts and accidental touch noise ensures the Heatmap genuinely reflects user behavior.Invalid Click Analysis—An underestimated capability.When numerous clicks occur where reaction=0 (non-interactive elements), it means users are clicking on elements that don't respond—this typically exposes UI design issues: elements that look like buttons but aren't, or images that appear clickable but aren't. Through Invalid Click Analysis, product teams can precisely identify and fix these "interaction illusions," turning invisible friction into a smoother, more intuitive experience.
If the Click Heatmap answers "where users clicked," the Area Heatmap answers "what users are paying attention to." Building on click data, it incorporates element sizes and positions to map user attention to various business areas on the page.
The essence of the Area Heatmap lies in its business readability: blue dashed boxes outline key business modules like product cards, navigation menus, and campaign entries, with each area displaying click counts, percentages, and business user numbers. Operating teams no longer need to count pixels; they can directly see "which Banner drove 30% of clicks" or "which product card was largely ignored"—shifting the basis for decisions from "feeling" to "numbers."
For large banners, image walls, or content lists, the Area Heatmap tells you which areas "catch the eye" and which are "virtually useless." It serves as a "yardstick" for A/B testing before and after revamps and for evaluating the value of homepage placement slots.
This is a deceptively simple but critical question—and the Scroll Heatmap is what finally gives you the answer.
Scroll depth distribution at a glance: 100% of users (31 people) saw the first screen, but by the 54.8% scroll depth mark, only 17 people were still scrolling—meaning nearly half of the visitors never made it past the midpoint of the page. The color band on the right, ranging from red (high reach rate) to green (low reach rate), visualizes the "drop-off point" for each percentile. If your core CTA button unfortunately lands in the green zone, it is virtually hidden from half of your users.
Instead of treating scrolling as discrete Action events (which would generate a massive volume of events), the RUM SDK continuously tracks scroll depth throughout the lifecycle of each View, reporting the final statistical summary when the View ends:
| Field | Meaning |
|---|---|
scroll.max_depth |
Maximum scroll depth reached by the user (percentage) |
scroll.max_depth_scroll_top |
Scroll position when the maximum depth is reached (pixels) |
scroll.max_scroll_height |
Maximum scroll height of the page |
scroll.max_scroll_height_time |
Time when the maximum height is reached |
Core calculation formula: scrollDepth = (scrollTop + clientHeight)/scrollHeight.
To prevent performance issues caused by high-frequency scroll events, the SDK throttles using throttle (leading + trailing mode), sampling at most once every 100ms. Concurrently, it uses ResizeObserver to listen for document.body height changes, covering dynamic scenarios like lazy-loaded images, infinite list prefetching, and accordion panel expansions to prevent underestimating max_scroll_height. When the View ends, the SDK actively cancels tail calls to eliminate cross-View data leakage.
For content operation teams, this Heatmap is a "content visibility map"—if you place your most important CTA button outside the red zone, it is almost equivalent to hiding it.
Session Replay and Heatmaps are not new concepts; vendors like Datadog and Sentry both offer them. However, their focuses and maturity levels differ significantly. The following table compares these two core capabilities:
| Capability Dimension | Datadog | Sentry | Alibaba Cloud RUM |
|---|---|---|---|
| Session Replay | ✅ | ✅ | ✅ |
| Click Heatmap | ✅ | ❌ Explicitly not supported | ✅ |
| Area Heatmap | ❌ | ❌ | ✅ |
| Scroll Heatmap | ✅ | ❌ | ✅ |
| Privacy Protection | Data masking | Text masking | Four-level configuration |
| Data Compression | Not detailed | Not detailed | Three-tier fallback strategy (Native -> Worker -> Last resort) |
| SPA Support | ✅ | ✅ | ✅ History + Hash |
| Invalid Click Detection | ✅ Rage click | ❌ | ✅ Reaction + Trust |
| Web Vitals | ✅ | ✅ | ✅ LCP/CLS/FID/INP |
First, comprehensive coverage of three Heatmap types. Very few vendors simultaneously offer Click, Area, and Scroll page-level Heatmaps. RUM's three-in-one toolkit paints a full picture of user behavior across three dimensions:"click locations," "attention areas," and "browsing depth."
Second, granular click quality analysis. Through cross-analysis of reaction(interactivity) andtrust(trustworthiness) dimensions, RUM not only tells you "where users clicked," but also "whether these clicks were valid" and "whether they came from real users."
Third, four-tier privacy protection configuration. Ranging from default mask, through granular allowlisted, to fully open allow, this covers the complete spectrum from the strictest compliance needs to the most permissive debugging needs.
Fourth, a three-tier compression fallback strategy that balances compatibility, performance, and reliability. It prioritizes the native CompressionStream API, falls back to a Web Worker running pako, and guarantees delivery via raw data as a last resort. This meticulous engineering consideration delivers clear advantages in large-scale production deployments—fast execution on new browsers, reliable execution on older browsers, and zero data loss in extreme conditions.
Is integration complicated? Not at all. If you are already using the Cloud Monitor Browser SDK, you only need to add a few lines to your initialization configuration:
import armsRum from '@arms/rum-browser';
armsRum.init({
  endpoint: 'https://your-endpoint.com/rum/web/v2',
  // Session Replay configuration
  replay: {
    enable: true,
    sampling: 20,            // 20% of sessions will be recorded
    privacy: {
      level: 'user-input',   // Mask only user inputs
    },
  },
  // Heatmap configuration
  collectors: {
    click: {
      enable: true,
      trackUserInteractions: true,  // Enable Heatmap data collection
    },
  },
});
It is that simple. The Replay sampling rate takes effect at the session level—once a session is selected for recording, it will continue recording throughout the entire session. Heatmap collection is controlled independently; you can enable 100% click collection to obtain complete Heatmap data.
Recommendations for sampling rates: We recommend setting the Replay sampling rate to 10–20% in production environments to control storage costs while ensuring adequate issue coverage. For Heatmaps, we recommend keeping trackUserInteractions at 100% sampling, because Heatmap's value comes from aggregate analysis—the more data you have, the more accurate the results. These two sampling rates are configured independently and don't need to be kept in sync.
The core challenge of frontend experience optimization has never been "not knowing what to optimize", but rather "not knowing where to start".
This combination covers the complete process from individual case diagnosis to group insights. You no longer need to ask users to "try again and send me a screenshot", and you no longer need to argue endlessly in meetings over whether "users actually like this redesign".
When your observability system covers the complete process from backend to frontend, and from metrics to behaviors, those experience issues once hidden in user browsers will have nowhere to hide.
Bring Ops Capabilities into Qoder: Pinpoint Root Causes in One Sentence
Say Goodbye to Complex Onboarding: AI Agent Skills Drive Cloud Monitor's Observability Integration

774 posts | 60 followers
FollowAlibaba Cloud Native Community - August 14, 2026
Alibaba Cloud Community - August 3, 2026
Alibaba Cloud Native Community - June 16, 2025
Alibaba Cloud Native Community - January 19, 2026
Alibaba Clouder - June 10, 2020
Alibaba Cloud Native Community - May 21, 2026
774 posts | 60 followers
Follow CloudMonitor
Automate performance monitoring of all your web resources and applications in real-time
Learn More Cloud Migration Solution
Secure and easy solutions for moving you workloads to the cloud
Learn More ZOLOZ Real ID
A Digital and Remote Online Solution for eKYC
Learn More Customer Engagement Enabler for Telcos Solution
Enable a seamless and omnichannel customer experience from marketing and sales to customer service, and digitalize your entire business.
Learn MoreMore Posts by Alibaba Cloud Native Community

