Go was the last mainstream language without zero-code observability. In July 2026, the OpenTelemetry Go Compile-Time Instrumentation project shipped its stable v1 release. Launched jointly by Alibaba and Datadog and developed through a year and a half of community collaboration, it lets Go developers add distributed tracing and metrics collection to an application with a single command, without touching any business code.
This article walks through how this milestone works, how to use it, and when to choose it.
Java has -javaagent, Python has sitecustomize, Node.js has --require.NET has CLR Profiler. AI Agents in these languages inject agents dynamically at runtime, so developers get traces and metrics without changing a line of code.
Go can't do that, and the reason is fundamental: Go compiles to a static binary — no VM, no bytecode, no class-loading hooks. Once go build finishes, you have a self-contained machine-code file with nowhere to "attach" an agent at runtime.
That has long left Go developers with two options:
span.Start() / span.End() explicitly in every HTTP handler and around every DB call — intrusive, and easy to miss spotsA wide gap separates the two. For a platform engineering team running hundreds of Go microservices, "add tracing by hand to every service" isn't realistic. eBPF covers a lot of ground but can't reach inside the code — if you want to know which SQL query was slowest in a request, eBPF can only tell you "this TCP connection took 200 ms"; it gives you nothing at the database/SQL level.
Compile-time instrumentation fills exactly that gap: probes are injected during go build, and the resulting binary carries observability with it. No code changes, no external AI Agent.
The Go toolchain has a little-known but very powerful extension point: -toolexec.
When you run go build, the go command is really orchestrating lower-level tools such as compile and link. -toolexec lets you name a wrapper program, and the Go toolchain routes every invocation of compile/link through that wrapper first — much the way Unix strace or time wraps a command.
OpenTelemetry Go Compile-Time Instrumentation builds on this mechanism. Its core tool, otelc, acts as a wrapper around -toolexec. As the compiler processes each package's source, otelc does the following:
ListenAndServe in net/http")compile for normal compilationThe binary you end up with has the agent code built in. At runtime there is no extra agent process, no sidecar, and no eBPF program to load.
How this fundamentally differs from a Java agent: Java injects logic at runtime by rewriting bytecode, which incurs runtime overhead (every class load passes through a transformer). Go compile-time instrumentation does all the rewriting during the build, so there is no additional runtime overhead — what you get is an ordinary Go binary that happens to contain tracing code.
This is also what makes the approach so CI/CD-friendly: in your build pipeline you replace go build with otelc go build. No changes to your deployment architecture, no Pod spec edits, no DaemonSet.
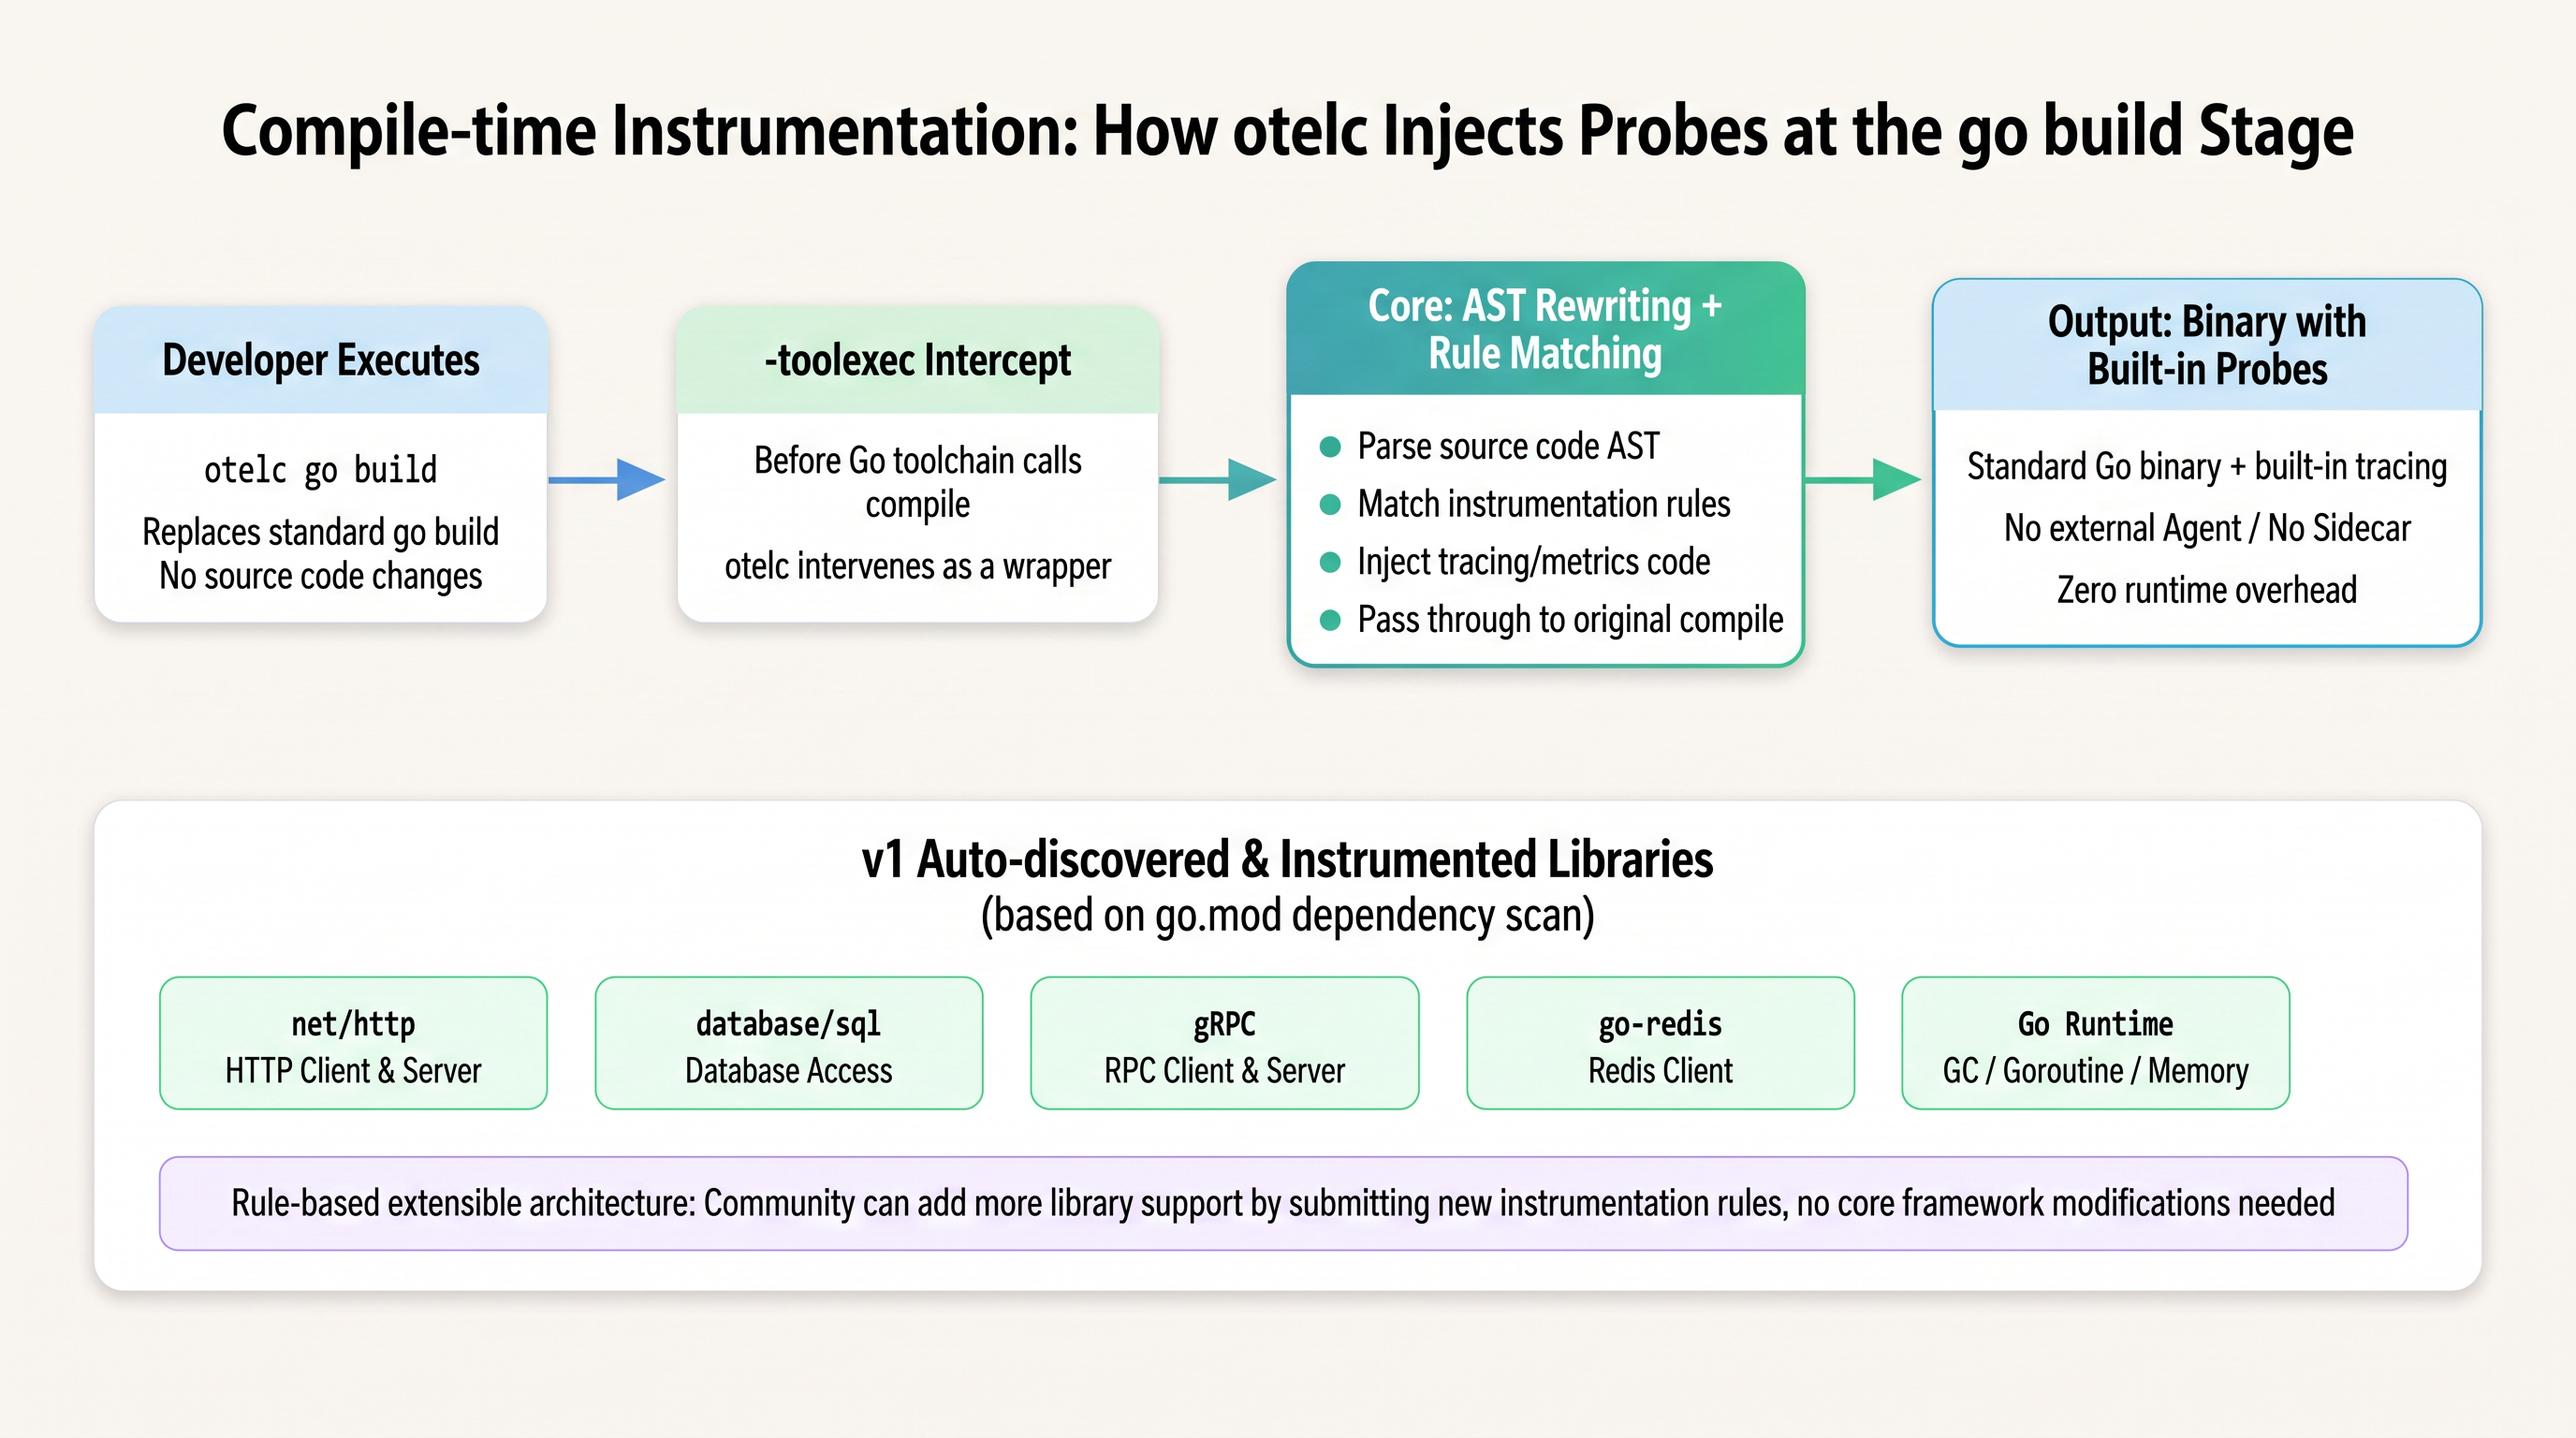
As the first stable release, v1 focuses on the most heavily used library categories in the Go ecosystem:
| Library | Type | Signals produced |
|---|---|---|
| net/http | HTTP client/server | Trace spans + HTTP semantic attributes (method, status_code, route) |
| Database/SQL | Database access | DB spans + statement summary + connection information |
| google.golang.org/grpc | RPC framework | Client/Server spans + gRPC semantic attributes |
| github.com/redis/go-redis | Redis client | Redis command spans |
| Go runtime | Runtime metrics | GC, goroutine, memory metrics |
A few key design decisions:
Rule-based architecture. The instrumentation logic for each library is defined as a rule, and a rule describes the package paths and function signatures to match plus the code template to inject. This means the community can contribute new rules independently, without touching the core framework. After v1, supporting a new library essentially means submitting a new rule.
Semantic Conventions compliance. Every span and metric produced follows the OpenTelemetry Semantic Conventions — attribute names, span names, and metric units are fully standardized. Whatever backend you use (Jaeger, Tempo, Simple Log Service, ARMS), the data means the same thing.
Automatic discovery. By default, otelc scans your go.mod dependency tree and automatically finds and enables every library covered by a registered rule. You don't have to declare "instrument net/http" — if you use it, it gets instrumented.
v1 deliberately prioritized a focused, high-quality core over breadth. Every supported library has been through full correctness tests and performance benchmarks. Later releases will keep expanding coverage.
Install otelc:
go install go.opentelemetry.io/otelc/tool/cmd/otelc@latestOption 1: replace the build command directly
otelc go build -o myapp .That's it. The resulting myapp already has tracing code built in. Set OTEL_EXPORTER_OTLP_ENDPOINT at startup and trace data will flow to your Collector automatically.
Option 2: leave the build command unchanged (CI/CD friendly)
otelc setup
export GOFLAGS="${GOFLAGS} '-toolexec=otelc toolexec'"
go build -o myapp .
This fits better when you already have a complex Makefile or CI pipeline — you add two lines of setup to the build environment and leave the existing go build command alone.
Dockerfile integration example:
FROM golang:1.23 AS builder
RUN go install go.opentelemetry.io/otelc/tool/cmd/otelc@latest
WORKDIR /app
COPY . .
RUN otelc go build -o /myapp .
FROM gcr.io/distroless/base
COPY --from=builder /myapp /myapp
ENTRYPOINT ["/myapp"]
Image size is unaffected: otelc is only used during the build, and the final image contains only the compiled output.
Go observability now has three complementary paths, not competing ones:
| Dimension | Compile-time instrumentation | OpenTelemetry eBPF Instrumentation (OBI) | Manual instrumentation (Go API) |
|---|---|---|---|
| Prerequisites | Able to recompile the source | Linux kernel ≥ 4.x, privileges | Able to modify the source |
| Code intrusion | None | None | High |
| Runtime overhead | Very low (code is inlined) | Low (collected in kernel space) | Depends on the implementation |
| Depth of coverage | Function level (including third-party dependencies) | Protocol level (HTTP/gRPC/SQL) | Any granularity |
| Multi-language support | Go only | Go/Java/Python/Node.js, etc. | Go only |
| Deployment changes | Change the build command | Deploy a DaemonSet | Change code + redeploy |
| Best fit | Platform engineering teams rolling out observability uniformly | Existing services, multi-language clusters | Business logic that needs custom spans |
How to decide:
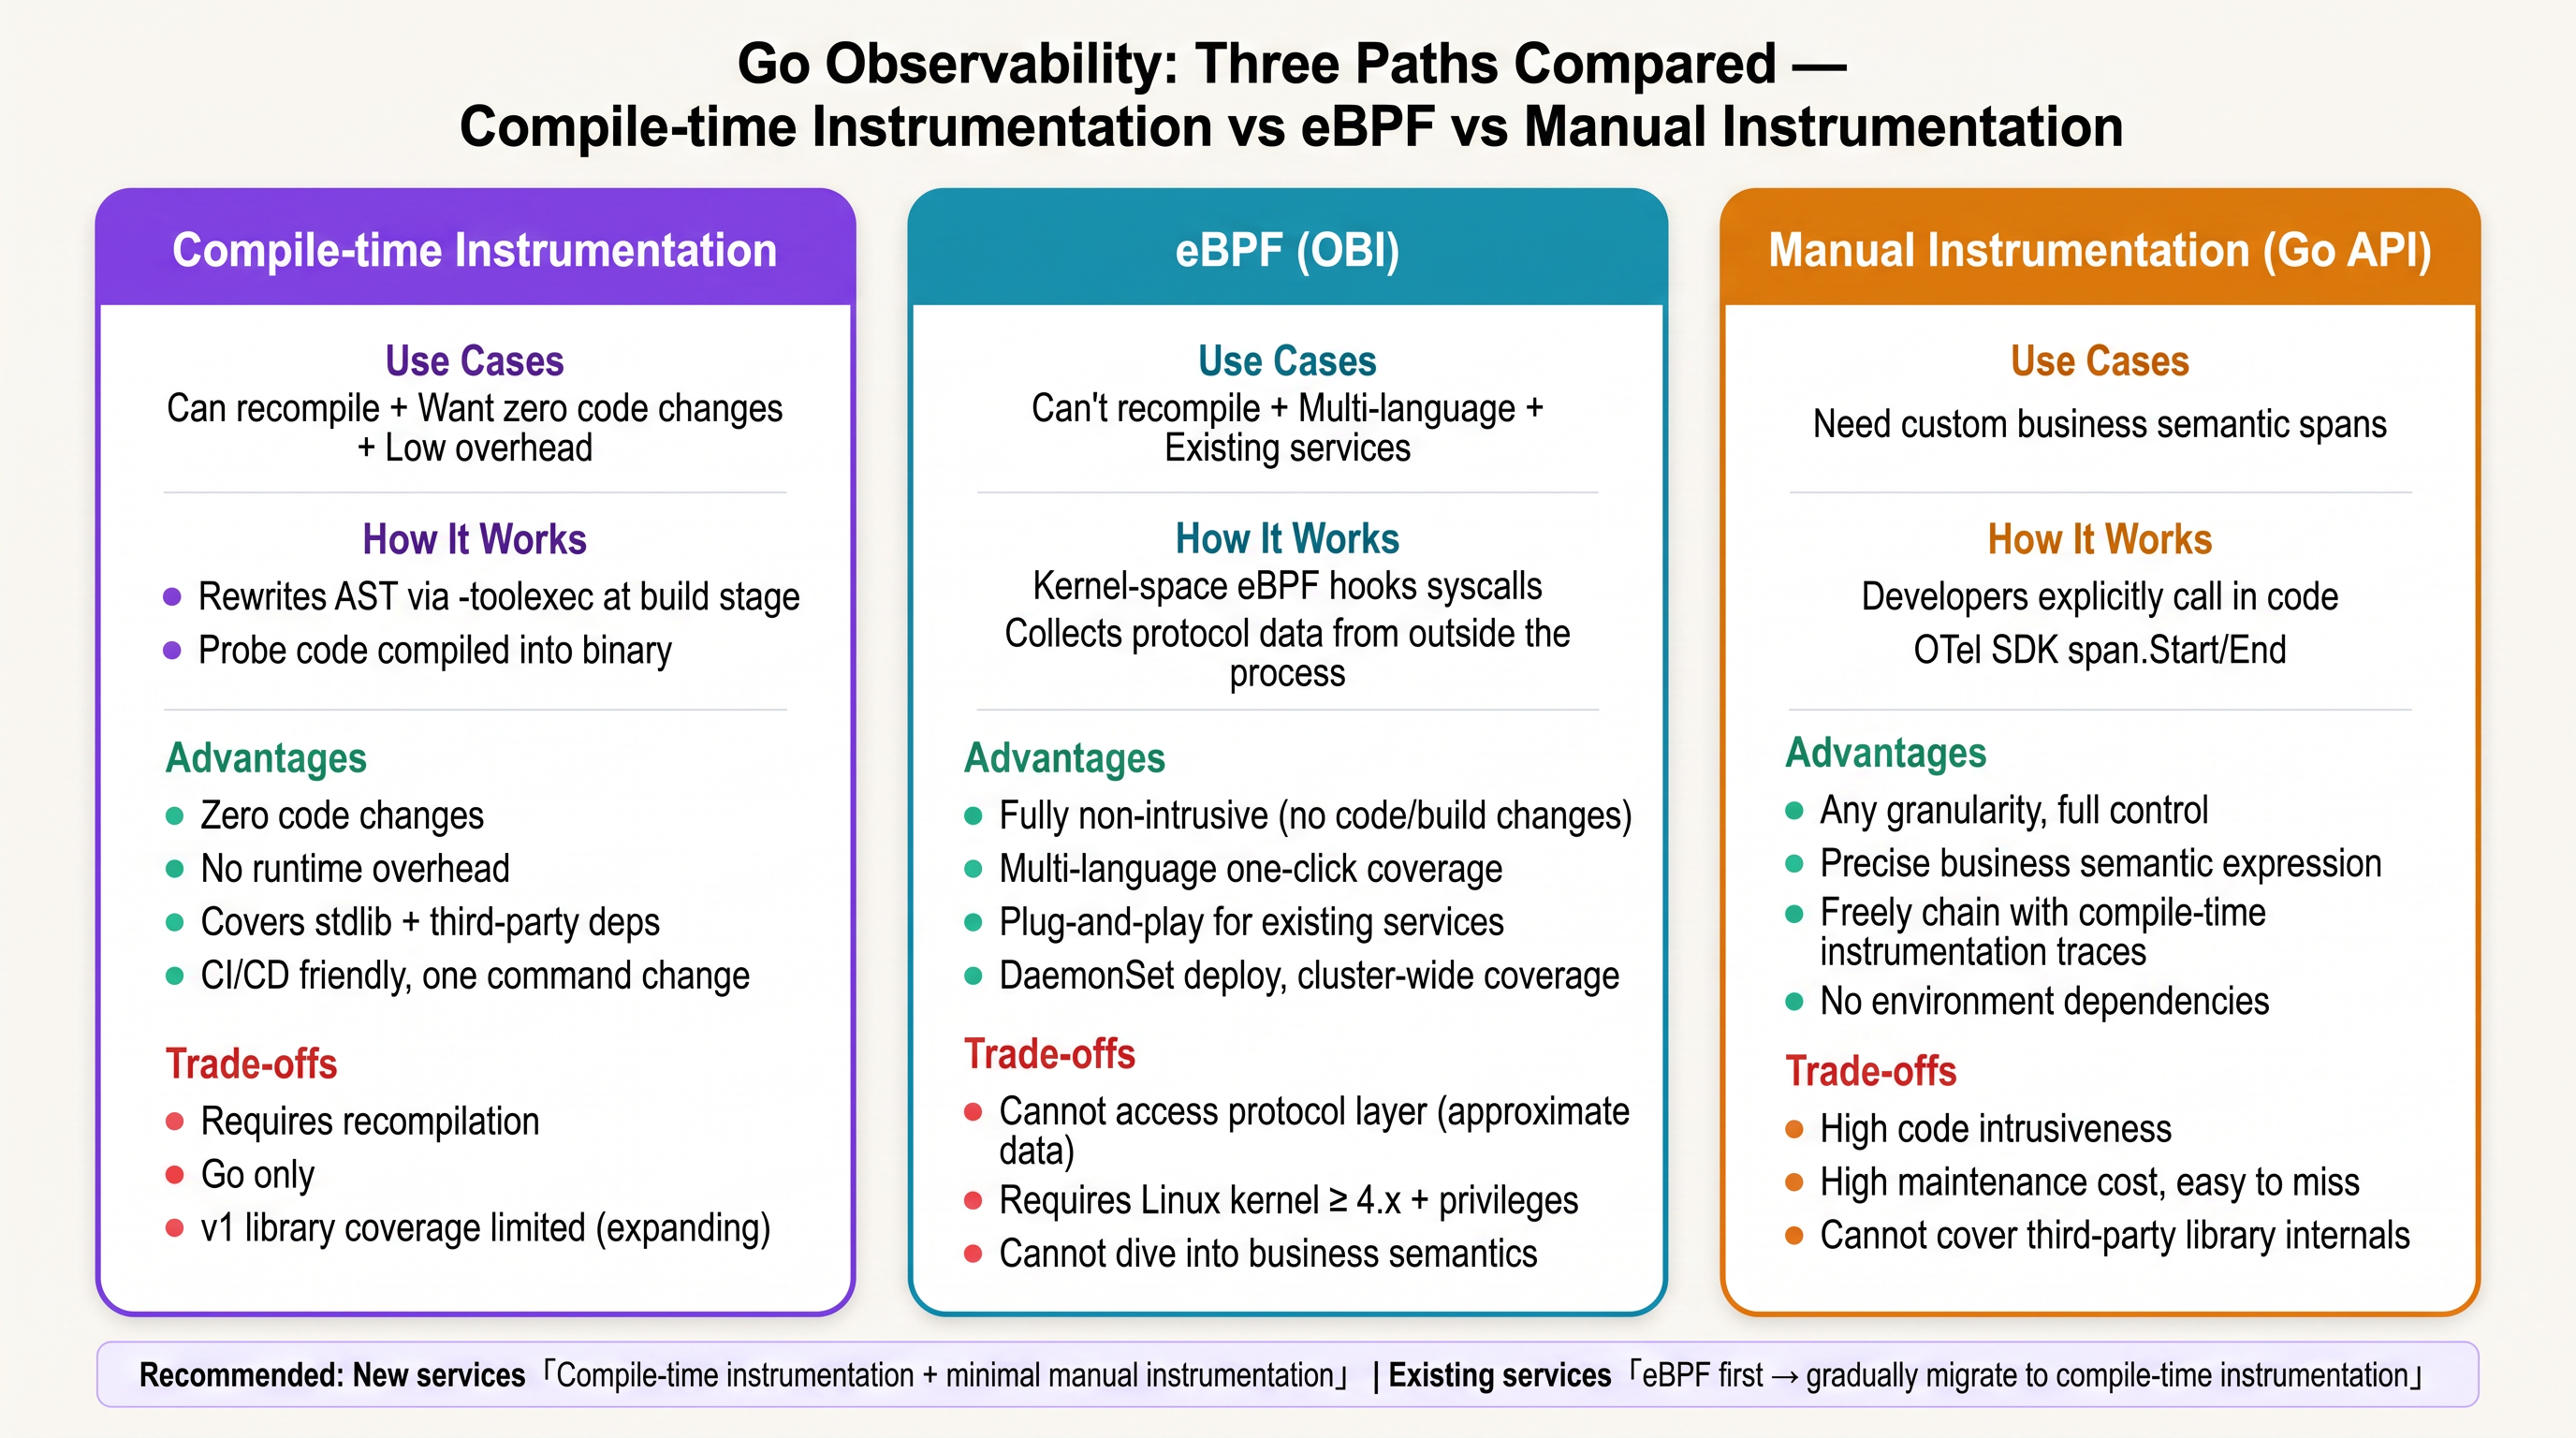
You can combine all three. Compile-time instrumentation covers the generic spans from the standard library and third-party dependencies, manual instrumentation adds business-semantic spans, and the two sets of spans stitch into one trace automatically. eBPF then serves as the fallback for older services you can't recompile yet.
In practice, for a typical Go microservice cluster the most pragmatic strategy is this: use compile-time instrumentation plus a little manual instrumentation for new services; cover existing services with eBPF first, then move them to compile-time instrumentation in CI over time.
How this project came about is itself an interesting case of open-source collaboration.
In early 2025, Alibaba and Datadog were each exploring Go compile-time instrumentation internally and discovered each other's work. Rather than build separately and then fight over the standard in the community, the two companies merged their efforts into the OpenTelemetry community and created a dedicated Special Interest Group (SIG) under CNCF to drive the work in a vendor-neutral way.
Over a year and a half, the project went all the way from PoC to stable. Key milestones:
SIG formed (2025 Q1): technical direction and governance structure settled
Core framework landed (2025 H1): rule engine, AST rewriting, test infra
Community growth (2025 H2): new contributors joined through CNCF LFX Mentorship — among them Azhar Momin, who went from mentee to approver
v1 released (2026 Q3): first stable version, covering 5 core library categories
What's on the roadmap next:
otelc's impact on compile timeGo's observability gap is finally closed.
If you're a platform engineer running observability infrastructure for dozens or hundreds of Go services, otelc go build may be the highest-ROI change you can make: one command, full coverage, nothing intrusive.
If you maintain a library or are simply interested in OpenTelemetry, we'd welcome your rule contributions. Writing an instrumentation rule for a library is far easier than implementing an SDK wrapper from scratch — a rule is essentially a declarative description of what code to inject, in which function, at which position.
Resources:
#otel-go-compile-instrumentation
Plaintext Stays Put, Logs Stay Useful: Sensitive Data Protection with Alibaba Cloud Observability

786 posts | 60 followers
FollowAlibaba Cloud Native - June 14, 2023
Alibaba Cloud Native Community - March 11, 2026
Alibaba Cloud Native Community - April 18, 2025
OpenAnolis - July 14, 2026
Alibaba Cloud Native Community - August 7, 2026
Alibaba Cloud Community - December 21, 2021
786 posts | 60 followers
Follow DevOps Solution
Accelerate software development and delivery by integrating DevOps with the cloud
Learn More PolarDB for Xscale
Alibaba Cloud PolarDB for Xscale (PolarDB-X) is a cloud-native high-performance distributed database service independently developed by Alibaba Cloud.
Learn More ApsaraMQ for RocketMQ
ApsaraMQ for RocketMQ is a distributed message queue service that supports reliable message-based asynchronous communication among microservices, distributed systems, and serverless applications.
Learn More ACK One
Provides a control plane to allow users to manage Kubernetes clusters that run based on different infrastructure resources
Learn MoreMore Posts by Alibaba Cloud Native Community

