Online stability has its blind spots.
Half an hour after a release, no alerts have fired, and the error rate hasn't crossed the threshold. Still, the checkout conversion rate has dipped slightly, the mobile page is taking a bit longer to render on first load, rage clicks on buttons have ticked up, and the P95 latency on one API has crept up just a bit. Looked at individually, each metric seems like a small enough blip to shrug off for now.
The problem is, users don't experience a product as a set of metrics. What they encounter is a page that won't load, a button that goes silent when clicked, a submission that seems to hang forever. Some bounce. Some retry. Some end up filing a complaint with customer support.
This is exactly the gray zone Real User Monitoring (RUM) Inspection is built to handle. Running on a fixed cadence, it cross-analyzes page performance, API latency, user behavior, crashes, conversions, and version changes against the same target entity — helping you tell, as early as possible, whether the user experience is genuinely degrading or just hitting a temporary hiccup.
RUM looks at what users actually experience under real-world conditions. Devices, networks, browsers, versions, pages, how quickly a page first renders, how responsive it feels after a click, API latency, resource failures, and any stuttering throughout the entire visit — all of it leaves a trace.
Here are a few common RUM metrics:
LCP) measures how long it takes for the core content to appear. When this metric worsens, users immediately perceive the page as slow.INP) measures interaction responsiveness. If a button doesn't respond to a click, or the page freezes after input, this is the metric to check.API P95 reveals your worst-case request latency. Even if the average looks fine, the slowest 5% of your traffic may already be struggling.While rich monitoring metrics preserve the scene of the incident, they do not automatically translate into a diagnosis. The more data you have, the heavier the subsequent workload becomes: you must continuously inspect everything, confirm whether changes point to a single issue or isolated fluctuations, and piece together metrics, samples, and behavioral evidence into actionable clues.
STAROps is a cross-domain AIOps platform from Alibaba Cloud, powered by LLMs and AI Agent technologies. It combines cross-domain observability data with LLM reasoning capabilities, overcoming the limitations of traditional Ops tools, such as steep learning curves and stubborn data silos. It lets users define objectives in natural language, while AI Agents autonomously handle the entire closed loop of dynamic planning, secure execution, and result validation. Using long-running tasks (Missions), digital employees (Agents) can automatically carry out operations like inspections, changes, and analyses—either on a schedule or triggered by events—escalating to Human-in-the-Loop (HIL) when needed.
RUM inspections, combined with STAROps missions, deliver two major capabilities: automated analysis triggered by alerts, and periodic reports informed by root cause analysis (RCA)—including inspection reports, issue summaries, and alert analysis summaries. This directly addresses the challenges outlined above.
Alerts are ideal for catching deterministic failures. If an API goes down, the error rate clearly crosses the threshold, or a core flow fails at scale, these events should trigger an immediate response—notification, escalation, and mitigation.
Dashboards answer the question, "What is the current status?"—covering traffic, latency, error rates, and version distribution. Users can check any metric at any time, with trends visible at a glance.
Inspections cover the gray zone further upstream in the pipeline: a single metric might not be severe enough to trigger an alert, but multiple signals are already trending downward on the same target. Compared to alerts and dashboards, inspections focus more on interpreting fused signals and compounding degradations: which signals are moving together, what target they're hitting, which users are affected, and who should take it from here.
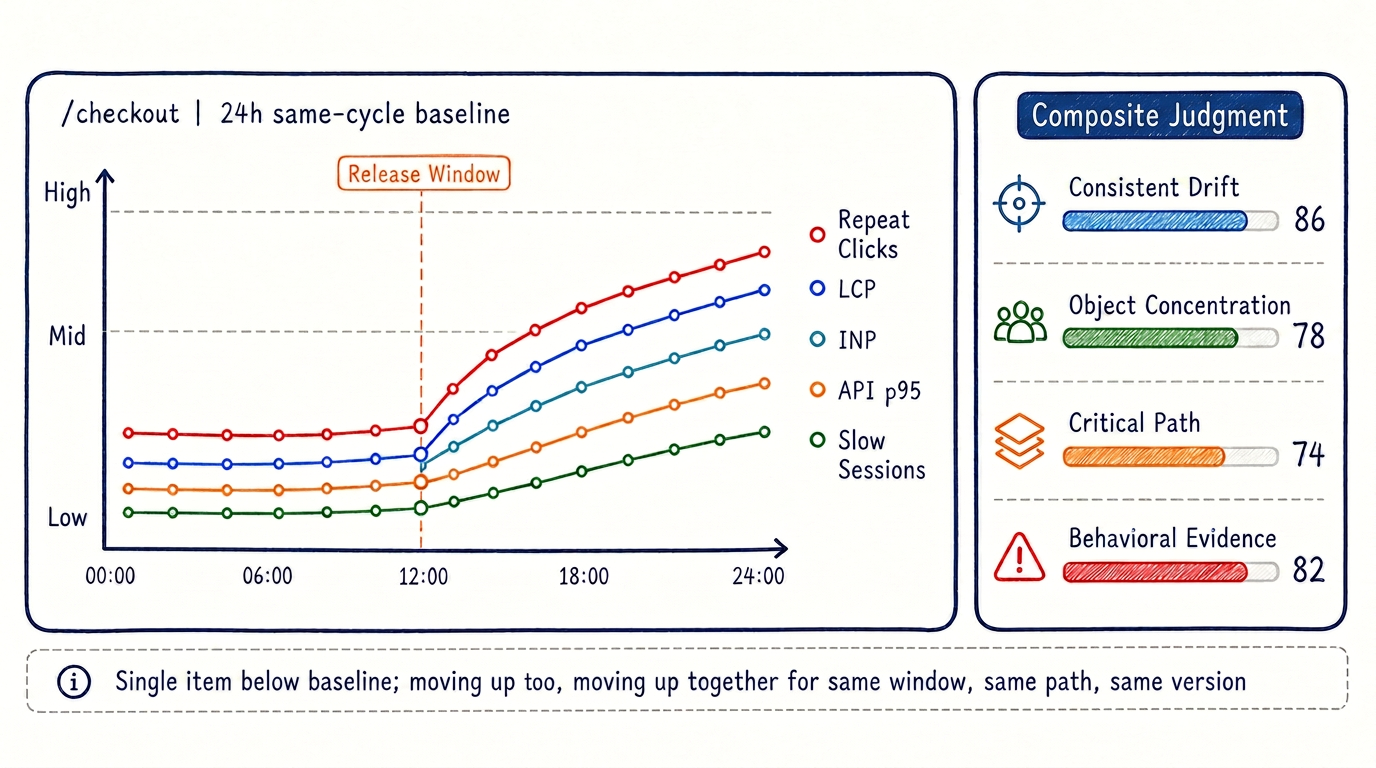
Take /checkout as an example. After a new release goes live, it doesn't go down entirely, and the error rate doesn't spike. However, mobile users see slower LCP, worse INP, elevated P95 on payment/create, more slow sessions, increased rage clicks, and a lower conversion rate. Isolate any one of these, and you could write it off as a mere fluctuation; put them all together, and it becomes very hard to ignore.
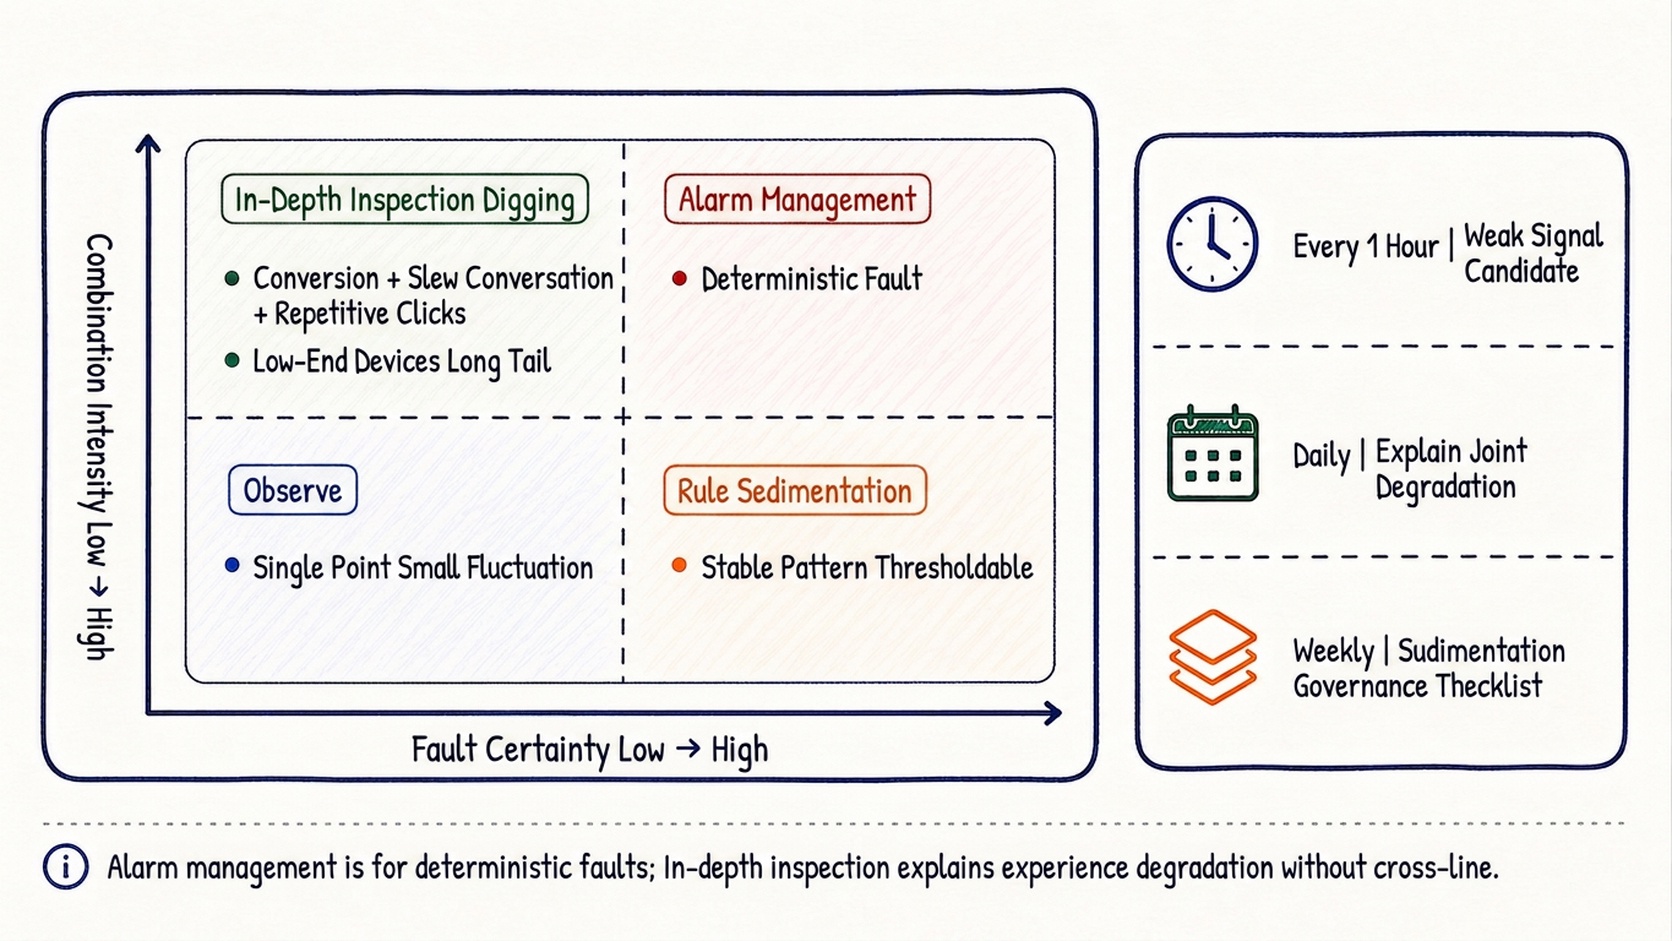
Inspections are periodic tasks, so you don't need a lengthy report every time. Run an hourly sweep to catch which objects are starting to drift from baseline; run a daily interpretation to piece together the chain of evidence behind combined degradations and suggest next steps; and run a weekly rollup that flags issues with tail latency or frequent recurrence, adding them to the remediation backlog.
Traditional metric-based analysis often fragments problems. You might see a slow page here, a sluggish API there, and an error signature somewhere else. Each looks alarming in isolation, but scattered like this, they're hard to prioritize—loud, but not necessarily urgent.
Inspections need to flip this approach: pin down the object first, then examine the metrics.
An object can be a page, a business path, a version, a device type, a region, a channel, or some combination of these. Only once the object is pinned down do the metrics have something to anchor to. Otherwise, "LCP increased by 8%" is just a data point; but "/checkout + v2.8.1 + mobile LCP, INP, API p95, slow sessions, rage clicks, and conversion rate all degrading at once" is clearly worth investigating.
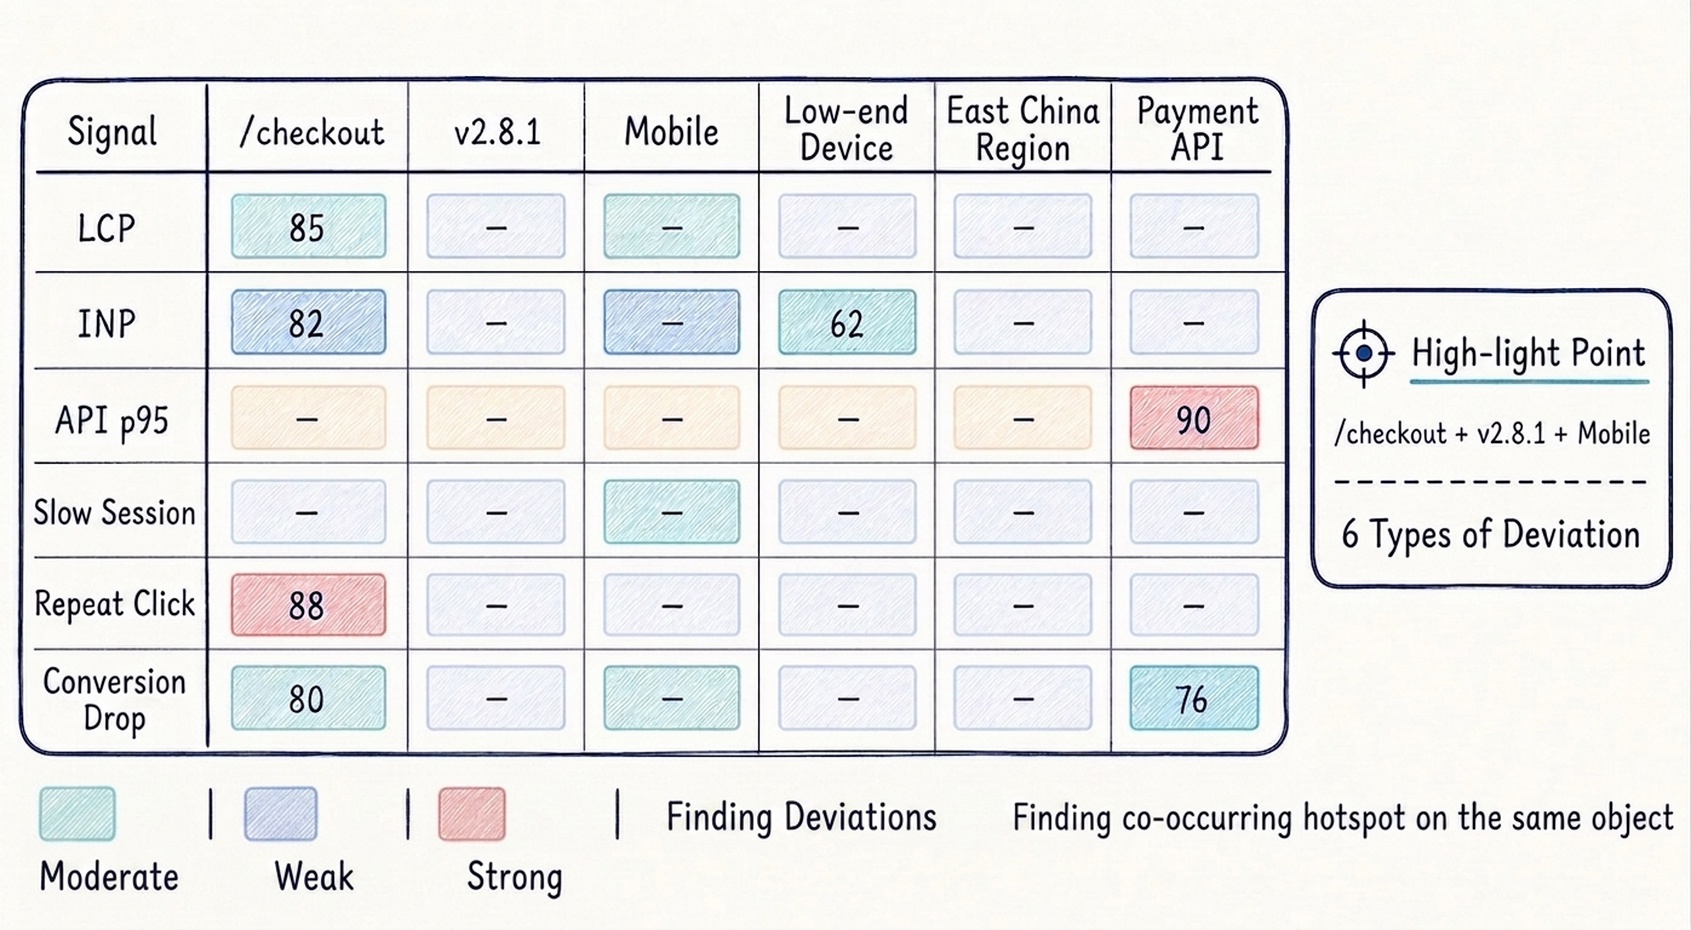
This step is a common source of misjudgment. A page with only a few dozen visit samples shouldn't be judged by the same standard as a core page with hundreds of thousands of daily visits. There's also the question of timing: a change at 14:00 today shouldn't just be compared to 13:00 today—you need to check it against the same time yesterday, the same time last week, and the windows before and after a release.
Dimensions must also map to specific troubleshooting actions. If mobile performance degrades, break it down by device model, OS, browser, region, and version. If the API P95 spikes, track down which slice of your slowest traffic ruined the experience. If conversions drop, dig back into how users behaved—how long they waited, where they rage-clicked, and where they dropped off.
Ultimately, the evidence has to come together. A single degrading metric only signals a fluctuation; but when business results, performance metrics, request latency, user behavior, and Session Replay all point to the same object, the conclusion holds up.
The first type is when "business metrics weaken before technical metrics blow up."
For example, the payment completion rate drops by 3%, but the error rate doesn't budge, and no alerts fire. If you only watch the error count in this scenario, the problem can slip right past you. The right approach is to lay out the entire payment path in a single view: entry page load time, submit button responsiveness, payment API P95, version distribution of slow sessions, and buttons with rage clicks.
If these signals show up together, and Session Replay shows users waiting longer and longer after submitting, clicking repeatedly, or going back to retry, then a report that simply says "conversion is fluctuating" falls short. It should state plainly: the issue is concentrated in the new mobile version of the payment flow, showing up mainly as tail latency and interaction delays. R&D engineers should prioritize the tail latency on the payment creation API, while also checking button feedback and anti-duplicate submission logic.
The second type is "persistent tail latency on low-end devices."
This kind of problem tends to stay quiet. Day by day, it's barely slower; week by week, the pattern holds. On low-end Android devices, long tasks pile up, INP stays poor, the share of slow sessions runs higher, the bounce rate ticks up, and the completion rate dips slightly. It's not worth waking anyone up at 3 a.m. for, but left alone long enough, it becomes an ongoing experience tax paid by a specific group of users.
Inspections are well suited to surface exactly these kinds of issues: how broad the impact is, how long it's been going on, where it ranks in the remediation backlog, and who ultimately owns the fix.
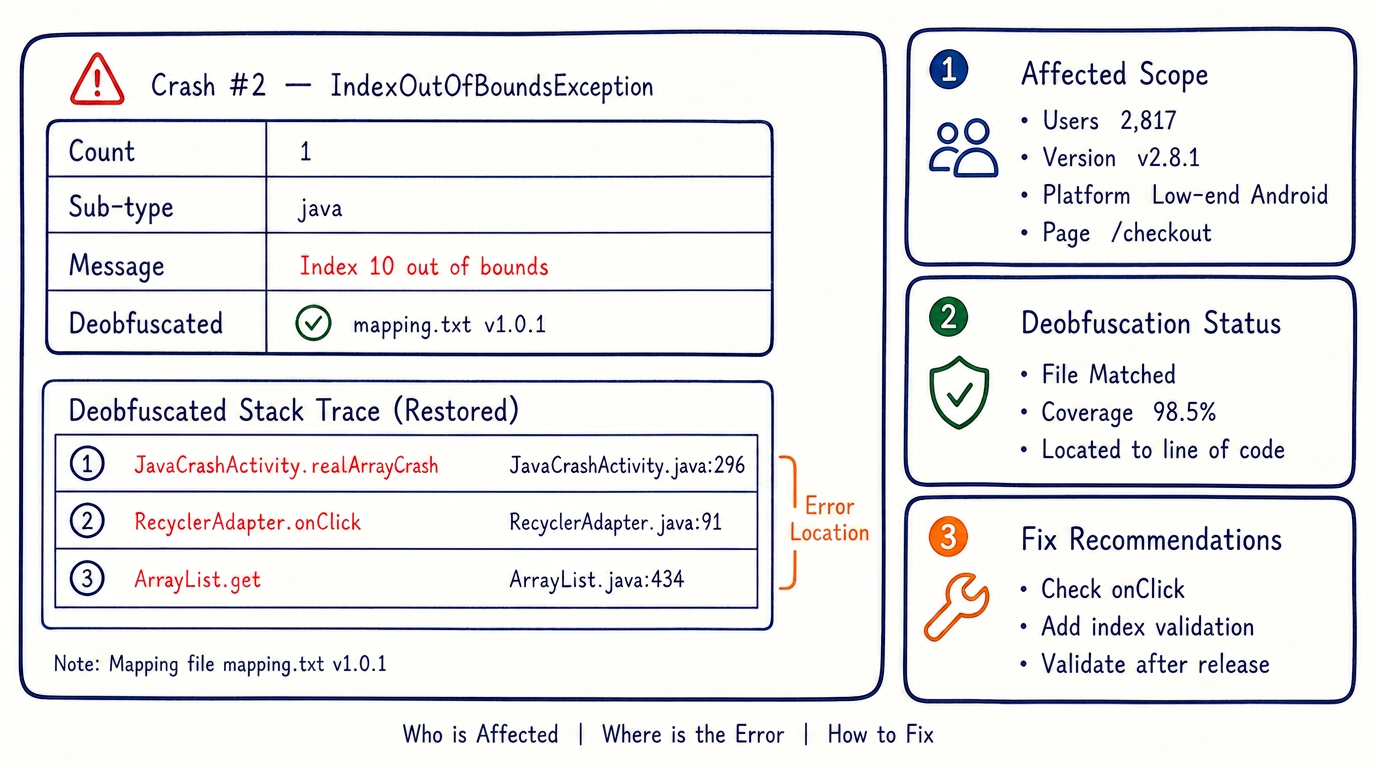
However, many crash tools just spit out a raw stack trace. You can tell an error occurred, but you have no idea which version, page, or piece of code to chase down. That's why, once crashes are fed into inspections, the system must first perform normalization and aggregation: clustering similar exceptions and stack traces, then rolling them up by page, version, platform, device, browser, WebView, and release window. The report should then prioritize highlighting high-frequency root causes and the scope of impact.
Automated parsing has a prerequisite: symbol files must accompany the release. For the frontend and web, upload source maps that match the build artifacts; for Android, upload the corresponding version's mapping.txt; for Native, retain the corresponding debug symbols. If a file is missing, the report will only show minified line and column numbers, or obfuscated class names. Only when symbols are matched can errors be traced back to source code files, methods, activities, adapters, or click callbacks. RUM supports uploading files like source maps or mapping.txt via CLIs. For details, refer to Upload RUM symbol table files by using CMS2 CLI.
Crash interpretations should also cut down on the guesswork. Take Android's IndexOutOfBoundsException, for instance. The report shouldn't just say "index out of bounds"; it needs to clarify that it happened after the user clicked a list item, accessing an index that exceeds list.size(). It should also include the affected versions, device distribution, sample count, user count, and suggested troubleshooting directions. For frontend errors caused by accessing undefined properties, the report should pin them down to specific components, API fields, or canary resource versions.
The symbol files themselves also need to be managed. Since source maps might contain source code information and mapping.txt may expose code structure, they're better kept in a controlled repository, tightly keyed to application, environment, version, build number, and resource hash. This way, the moment a crash occurs, the matching symbol file can be automatically located, and the report can reliably surface high-frequency root causes instead of just leaving a pile of raw, unreadable stack traces.
Inspection reports support multiple formats. By default, they cover four common types: hourly reports spot objects just starting to deviate from the baseline; daily diagnostic reports explain recurring degradations throughout the day; weekly reports roll up issues with tail latency that recur frequently and belong in the remediation backlog; and full RCA inspections perform a complete root cause analysis on a specific issue, stringing together the timeline, impact scope, evidence chain, root cause judgment, handling suggestions, and review criteria.
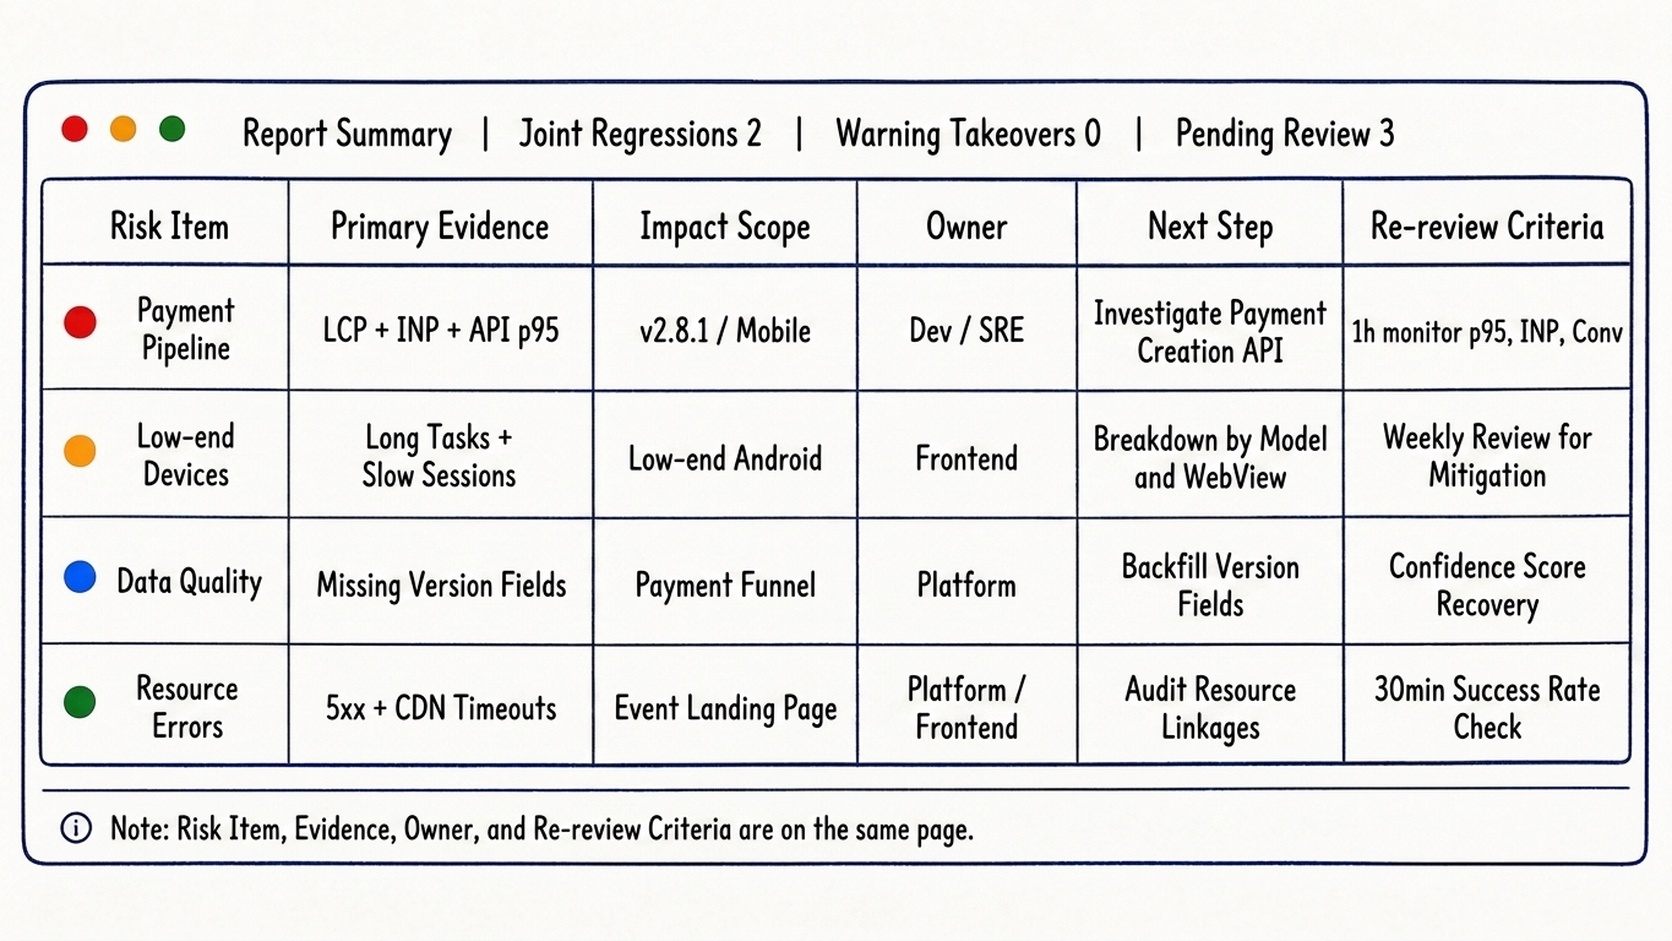
Regardless of the type, a report should consistently cover a few key components. First, provide the conclusion: which business path, version, device type, or user group was actually affected this time. Next, clearly define the impacted objects: page, API, version, platform, region, user scale, and business path—each one spelled out precisely. Then comes the combined evidence, explaining which signals degraded together and how they compare to the baseline. Granular evidence must follow—Session Replay, heatmaps, sample sessions, and error samples are there to support the conclusion, not just to pad the report with visuals. Finally, wrap up with handover suggestions: should R&D engineers check the API or the interaction first? How large an impact radius should SREs keep monitoring? Which conversion funnel should product managers track? And which metrics should they review, and how soon?
Users can also customize reports based on their own scenarios. Building on existing reports, clearly communicate a few requirements to the Agents: is the inspection target a page, an API, a version, or a business path? Is the time window hourly, daily, or pre/post-release? Do the key metrics focus on performance, exceptions, conversions, behavior, or crashes? Should the output lean toward a handover ticket, a post-mortem report, a remediation backlog, a daily risk report, or an RCA? The goal of customization isn't to write a few extra paragraphs, but to drive down the communication costs of the next steps. A truly usable report will nail down the troubleshooting targets, the basis for judgments, the owners, and the review criteria.
Prerequisite: Integrate RUM. Then, log on to the STAROps console. Alternatively, you can head straight to the interactive demo and click RUM inspection to try it out.
In the STAROps console, click Mission on the left, then click New mission. In the dialog box that appears, click the RUM inspection card. Wait for it to output the inspection plan, then just type your confirmation.
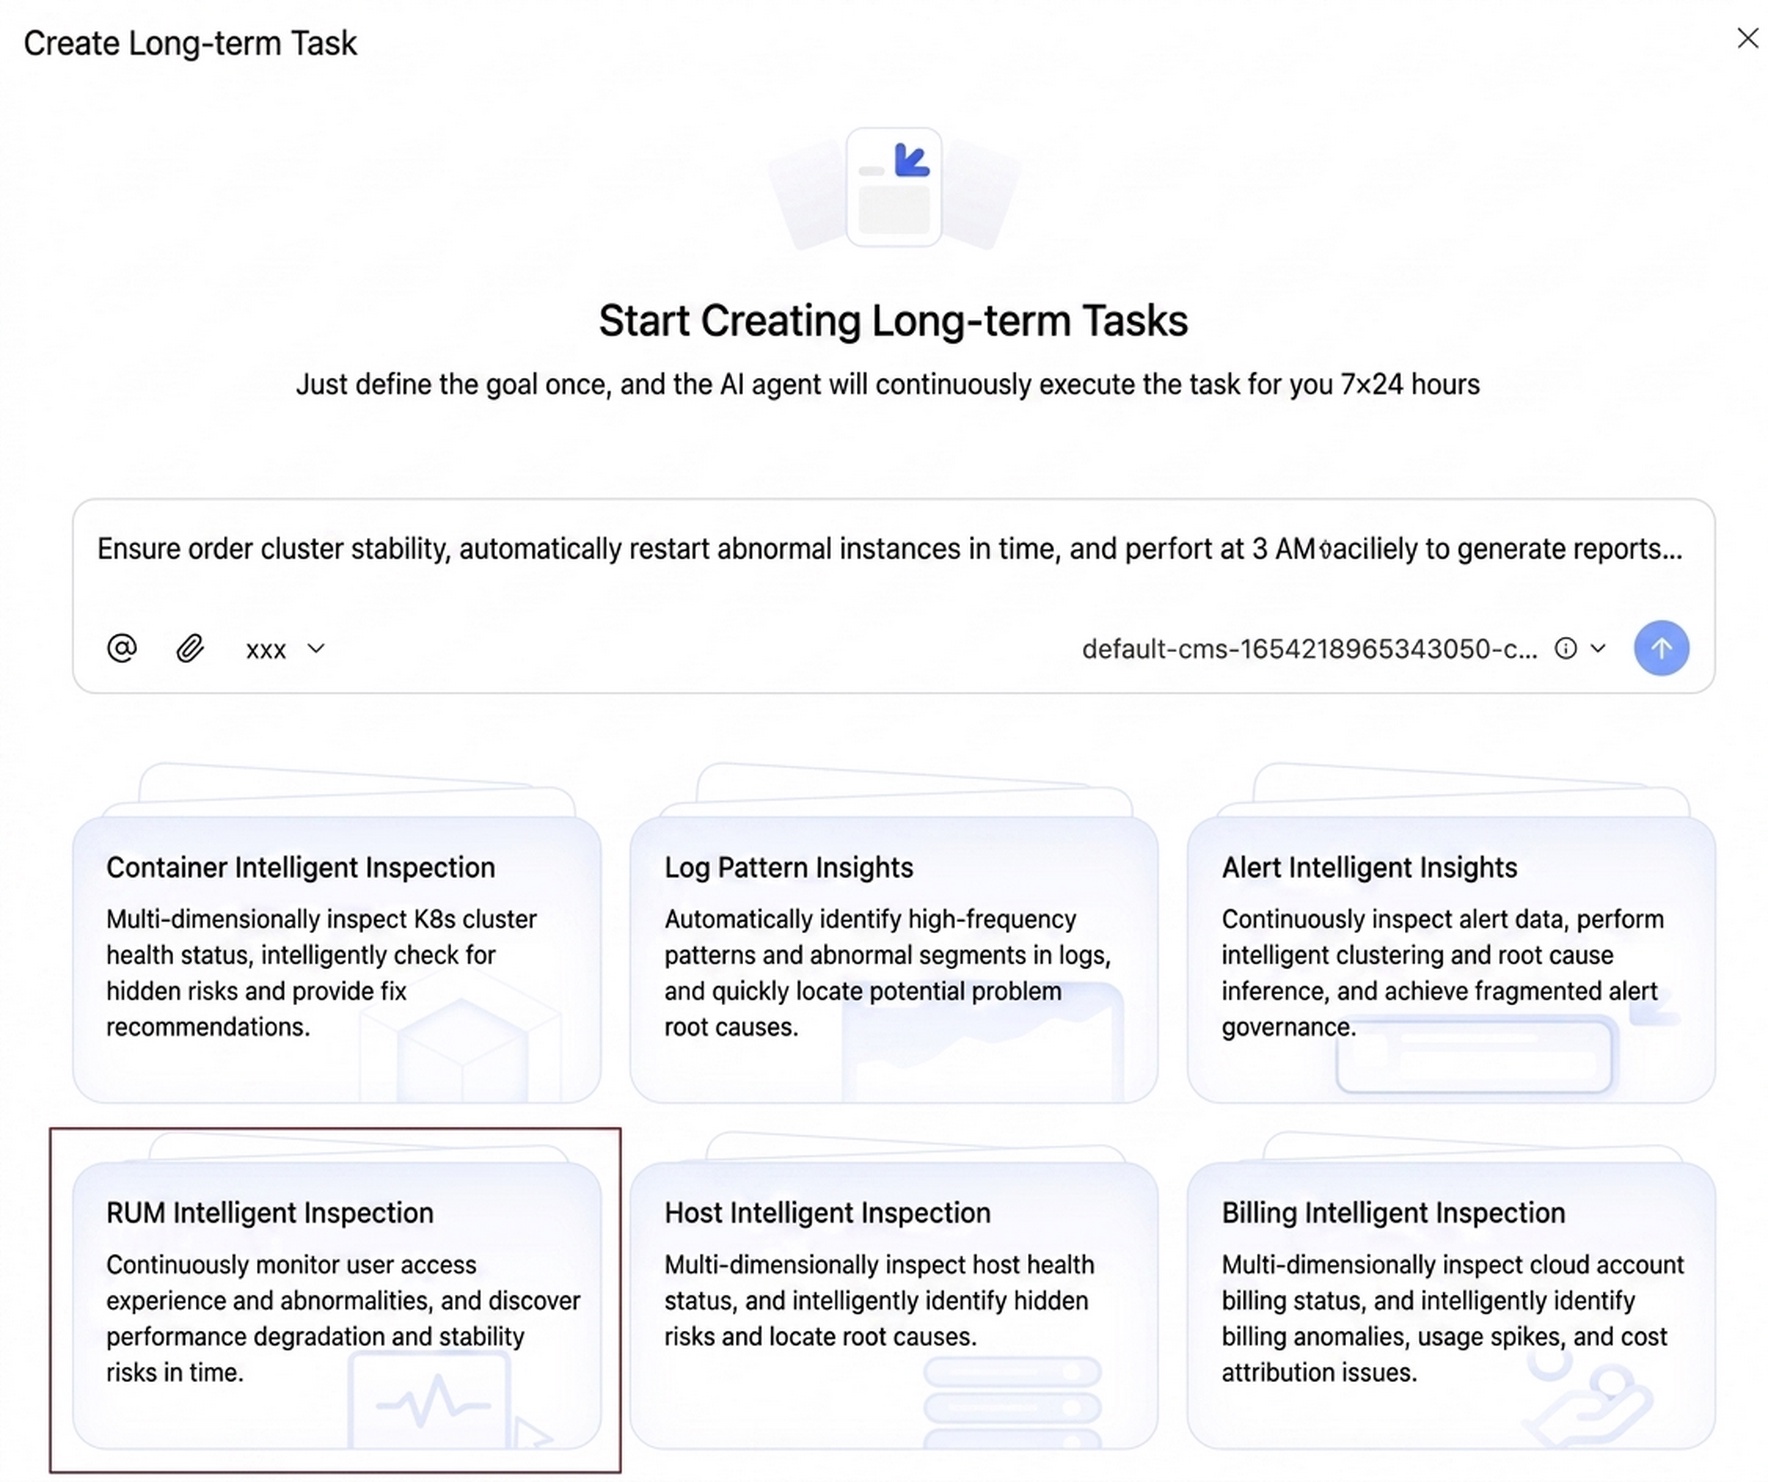
In the inspection dialog, you can modify the prompt at any time. Just make sure to clarify: the target objects, time windows, scenarios, and output formats.
For release inspections, you can write something more specific based on your needs:
Inspect the xxx app’s /checkout payment flow, run it once an hour, and compare it with the same period before the release. Focus on mobile LCP, INP, API P95, slow sessions, rage clicks, and conversion changes. Output the risk objects, evidence chain, and handover suggestions.
For campaign monitoring or user feedback scenarios, the prompt can be tailored to the specific situation:
Over the past hour, users have reported that tapping into the campaign page gets no response. Focus on mobile, low-end Android devices, primary regions, and the new version. Combine this with rage clicks, long tasks, API latency, and Session Replay samples to output the handover suggestions and next steps for troubleshooting.
Once the task is created, first verify whether the objects and time windows in the report are correct. If the scope is too broad, narrow down the page, version, platform, or region and run it again. The more your prompt reads like a real-world problem, the easier it is for the report to lead directly into troubleshooting, and the less likely it is to churn out a bloated, exhaustive list of metrics.
Different templates require different reading approaches, but always confirm three things first: what happened, what's the basis for this judgment, and who takes over next.
The hourly report is more like a handover ticket during an on-call shift; it answers the question, "Which objects started acting up in the last hour?" On the first screen, scan the health status, risk levels, and top risk objects, then scroll down to verify the metrics and samples supporting the conclusion.
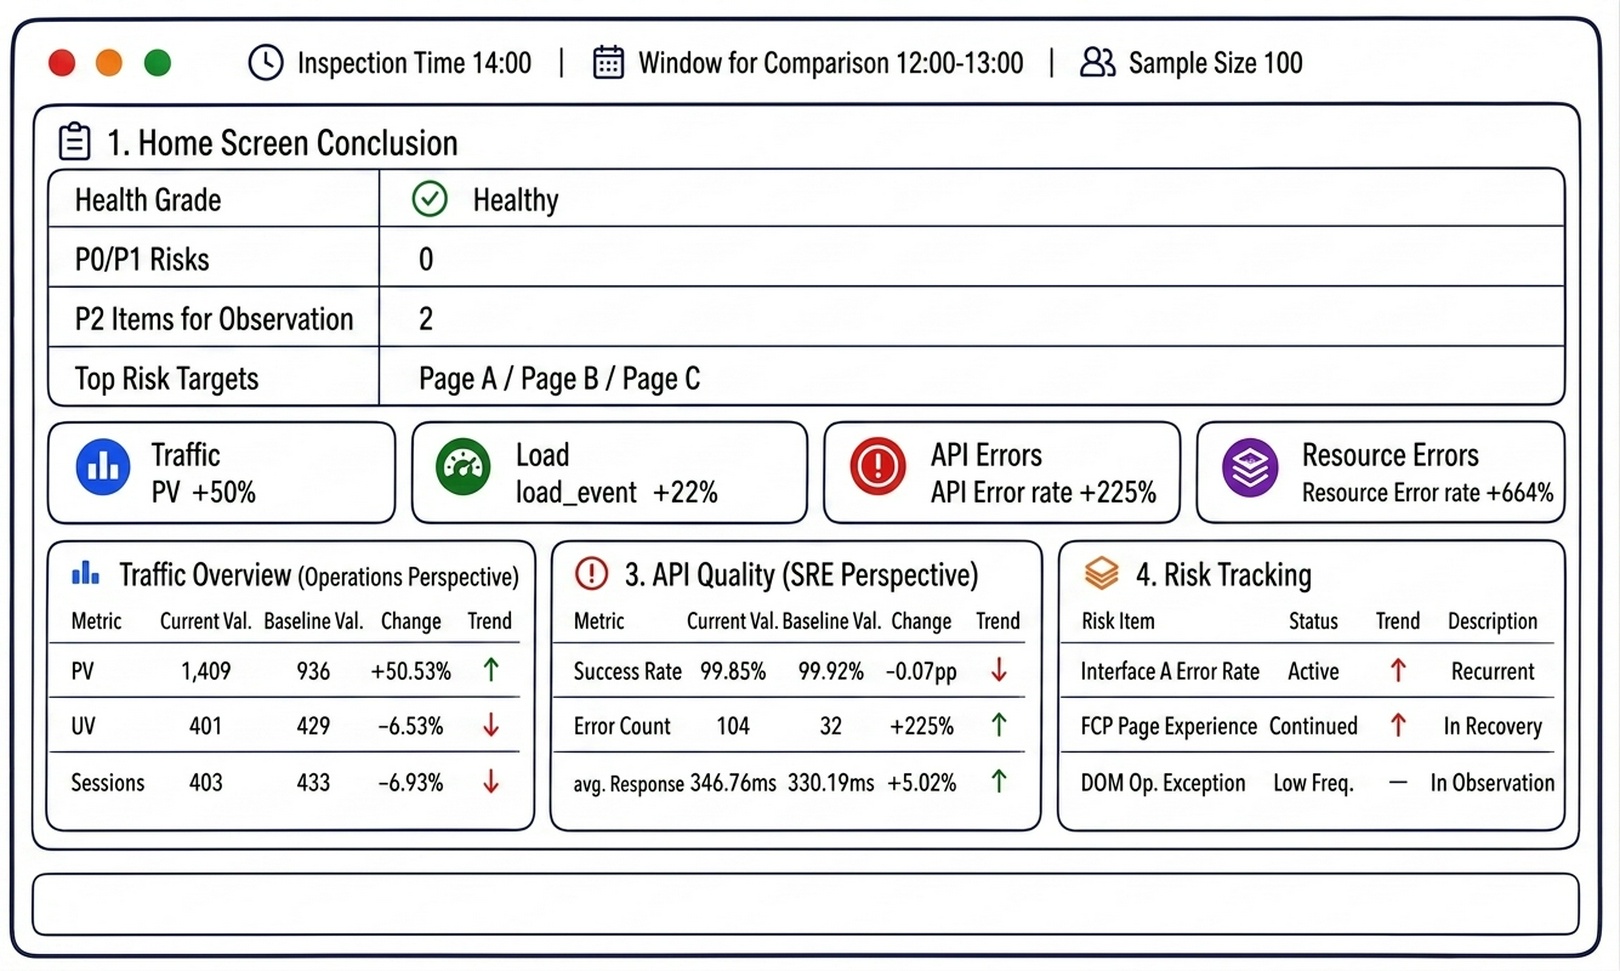
Structurally, the hourly report hits three layers: conclusions at the top, evidence in the middle, and risks at the bottom. After reading it, the on-call engineer should at least know whether to engage, which object to target, and what to monitor for the next hour.
The daily diagnostic report rounds up weak signals that recurred throughout the day, have a more stable impact radius, and are ripe for a post-mortem. While the hourly report leans toward "should I handle this right now?", the daily report is more about "which issues from today need to be discussed?"
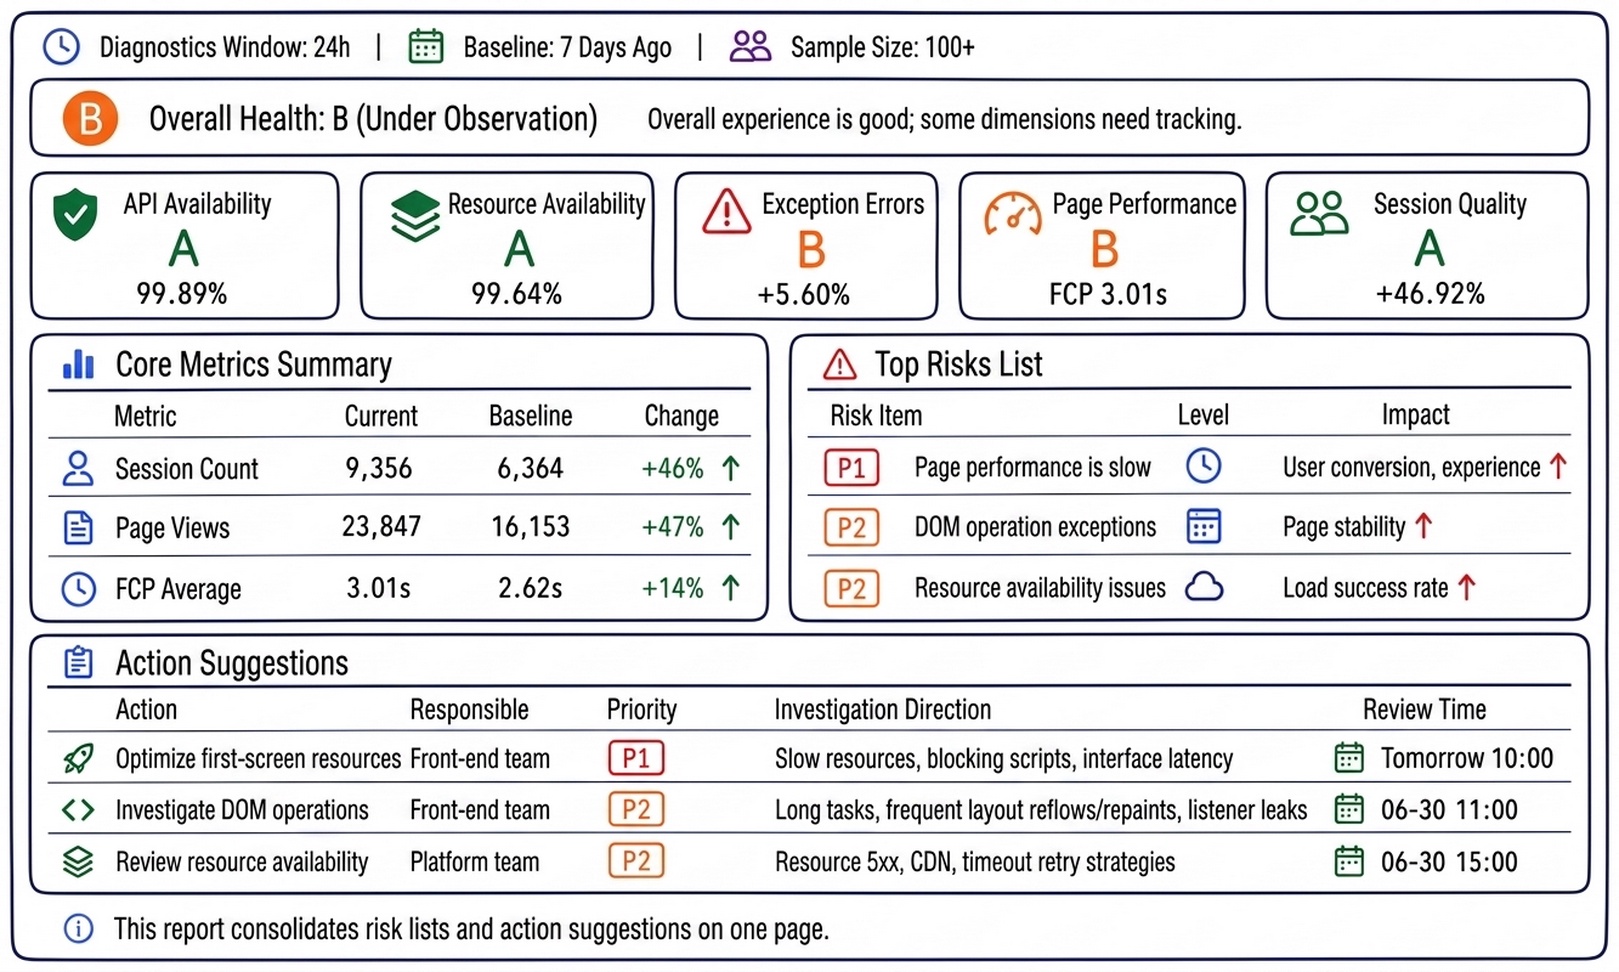
Our team's approach is quite simple: let alerts continue to catch issues that have clearly blown up, and use RUM Inspection for daily health checks. We run a full RCA inspection every day. When reviewing the report in the morning, we don't get lost in the weeds; instead, we first check if any new risk objects have surfaced.
In day-to-day operations, the most common scenario isn't actually "an alert fired," but rather issues that haven't yet hit the alert threshold—a page is noticeably slower than the same time last week, a specific version has a persistently high ratio of slow sessions, or a certain type of crash happens every day but in small daily volumes. Once these kinds of issues cluster on a critical path, they get pulled out for dedicated review.
When we confirm an issue needs handling, we directly create an issue ticket. We don't write generic descriptions like "page performance degraded." Instead, we clearly outline the objects and evidence: which page or flow, which versions and platforms are affected, which baseline it deviated from, what sample sessions, heatmaps, error samples, or crash aggregations support this, who should examine it first, and which metrics to check during the review.
Once a week, we review the weekly report. The weekly report doesn't rehash the daily diagnostic process; it only compares this week against last week: what new issues surfaced, which problems persisted, which ones recovered, and which high-frequency root causes kept resurfacing. By the end of the week, the team knows whether they're just chasing the same recurring bugs, or whether their remediation efforts are actually moving the needle.
The value of RUM Inspection doesn't lie in adding yet another set of reports. What it actually does is organize the weak signals from real user experiences into actionable insights. Alerts tell you where the line has already been crossed; inspections fill in the blind spot before that line is crossed: which objects are degrading, whether the evidence points to the same root cause, and who should take the baton next.
Once crash parsing, report generation, issue tracking, and weekly report comparisons are all linked together, experience issues are no longer scattered across dashboards, alerts, and user feedback. The team can spot degradations much earlier and confirm with certainty whether they've actually been fixed.
Try it out now: head over to Cloud Monitor 2.0 to create a RUM application—once you have your endpoint, you can start integrating RUM with your app. Visit the interactive demo to try creating a RUM inspection.
AgentLoop Audit: Fishing Out Real Risks from Massive 'Noise'

774 posts | 60 followers
FollowAlibaba Cloud Native Community - September 2, 2026
Alibaba Cloud Native Community - August 28, 2026
Alibaba Cloud Native Community - August 25, 2026
Alibaba Cloud Native Community - September 1, 2026
OpenAnolis - September 15, 2026
Alibaba Cloud Native Community - August 26, 2026
774 posts | 60 followers
Follow CloudMonitor
Automate performance monitoring of all your web resources and applications in real-time
Learn More Hybrid Cloud Solution
Highly reliable and secure deployment solutions for enterprises to fully experience the unique benefits of the hybrid cloud
Learn More FinTech on Cloud Solution
This solution enables FinTech companies to run workloads on the cloud, bringing greater customer satisfaction with lower latency and higher scalability.
Learn More Apsara Stack
Apsara Stack is a full-stack cloud solution created by Alibaba Cloud for medium- and large-size enterprise-class customers.
Learn MoreMore Posts by Alibaba Cloud Native Community

