You tweak the business logic of some service. Unit tests all pass, CI is green, the code review is approved—a smooth launch to production. Ten minutes later the monitoring alarms explode: the service's response time shoots straight up.
You go over the diff twice, and the logic looks flawless. But to pin down the root cause, you have to hop across at least five platforms: search logs in SLS, stitch together metrics in Grafana, check traces in APM, dig through the release system for changes, and ask the ops team for CMDB topology data. Every platform has its own query syntax, permissions block you halfway, and in the end you still have to @ an SRE in the group chat to pull data for you. After several rounds of back-and-forth cross-team coordination, half an hour is gone, and all you could do the whole time was stare at the chat window waiting for a reply.
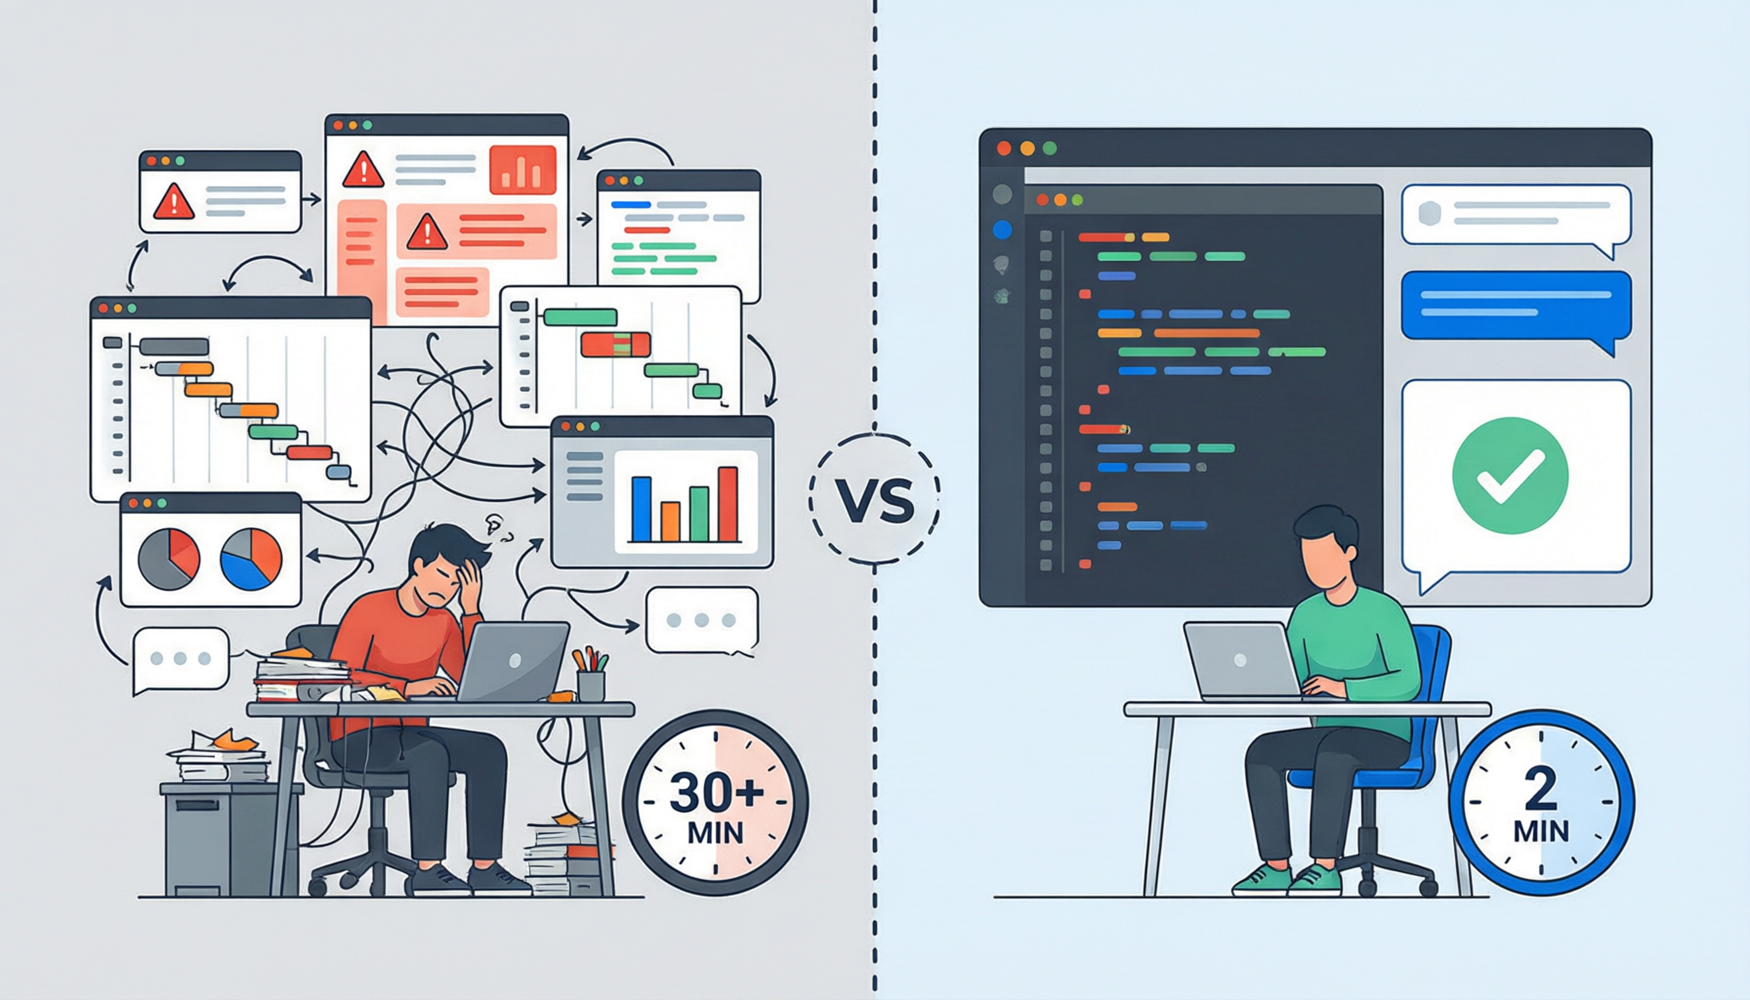
And this kind of scene probably plays out in your engineering team every single week.
The real problem was never a lack of tools. According to Gartner's 2025 DevOps toolchain report, mid-to-large enterprises deploy an average of 6–8 ops and monitoring tools, spanning monitoring, logging, tracing, change management, incident management, and more—nothing is missing. But these tools are built for SREs and ops teams. Their core design goals are “comprehensive, professional, and customizable,” which translates into complex query syntax, specialized concept systems, and long operational paths.
The heart of the contradiction is a mismatch between the tools and their target users. For developers, production troubleshooting is a low-frequency emergency scenario. Spending an hour learning PromQL or SLS query syntax just to handle one incident has a far worse return on investment than simply asking ops for help—which is exactly what creates cross-team communication overhead and traps ops teams in a flood of repetitive data-pulling chores, leaving them no time for the more essential work of building reliability. What developers want has never been to learn ops tools; it's to get actionable diagnostic conclusions directly. This isn't about replacing ops—it's about pushing standardized diagnostic capabilities down to the development side, so both sides can focus on their own core value.
What if there were a way to query production, view diagnostics, and ask about root causes—all without ever leaving your AI coding tool?
First, a one-sentence introduction to Alibaba Cloud STAROps, the full-domain intelligent ops platform: query metrics, analyze logs, trace calls, and diagnose alerts—all in natural language. Behind it is UModel, the unified ops data model Alibaba Cloud has refined over many years. Unlike a traditional CMDB that only records static asset relationships, UModel breaks down the data silos between different ops tools and builds a full-element semantic network of applications, services, resources, alerts, and changes, unifying entity relationships and data definitions. This is the core foundation that lets a large model perform accurate cross-domain root-cause reasoning, eliminating at the source the problems of misaligned data and wrong correlations across tools.
STAROps is already powerful on its own—ops teams handle their day-to-day diagnostics and inspections through its console or IM. Now this capability extends further, into developers' AI coding tools. Once you install the official STAROps plugin, you ask questions in natural language right inside Qoder's chat box, STAROps performs the cross-domain data queries and root-cause reasoning, and the structured conclusion appears directly in your Qoder. No switching windows. No waiting on ops colleagues. No learning any new query syntax. This means developers, for the first time, have visual diagnostic capability for the production environment—while you write code, you can glance at the real state of production anytime, and not by flipping through monitoring dashboards, but as naturally as chatting with a colleague.
The three scenarios below are arranged along the timeline of everyday development: how to investigate when something breaks, how to drill deeper after investigating, and how to check before you make a change.
Back to the example from the start. After the release, response times spiked, and now you just ask right inside Qoder:
I'm getting a high-latency alert on product-catalog ListProducts—P95 jumped from <60ms to 1875ms. Analyze the root cause.As soon as STAROps receives the request, it gets to work. It does a few things: first it checks the service's recent error logs, extracting exception stacks and error patterns; then it pulls APM metrics to look at trends in P95 latency, container replica count, and throughput; next it examines the topology to see whether the call chains of upstream and downstream services show anything abnormal; and finally it correlates change records—pulling up the list of recent release events and comparing each one's deployment time against the latency curve. The entire analysis streams back, so right in the Qoder chat box you can watch STAROps gather evidence and reason toward the root cause step by step. The final conclusion might look like this:
Root cause analysis: DB connection pool starvation (MaxOpenConns=1, MaxIdleConns=1). Triggering version: v2.2.0-buggy (commit d9420f7, ticket OPS-1024, operator David Zhang). Evidence chain: After v2.2.0-buggy was deployed at 14:06, P95 latency immediately surged from <60ms to 1875.8ms, and container ReadyReplicas jumped from 2 to 24 (auto-scaling triggered), a deviation exceeding ±4.1σ. Latency recovered immediately after the rollback to v2.1.0.Core mechanism: ListProducts needs to run multiple GetProduct calls concurrently → multiple SELECTs contend for a single database connection at once → large numbers of requests queue on the connection pool, and the actual time of a single SELECT is amplified by the queue wait to 300ms ~ 3400ms.Conclusion: The v2.2.0-buggy version lowered MaxOpenConns from a reasonable value to 1, so concurrent GetProduct calls queue on the database connection pool, driving ListProducts P95 latency from <60ms up to 1875.8ms. We recommend rolling back to v2.1.0 immediately and isolating the problem version behind a feature flag. Confidence: 80%.
In the traditional model, this kind of post-release troubleshooting requires crossing more than three platforms—container monitoring for replica counts and resource metrics, the APM platform for call chains and latency distribution, the release system for deployment records—coordinating two ops colleagues and taking more than 40 minutes on average. With Qoder + STAROps, going from question to conclusion might take just two or three minutes. And this conclusion isn't a “go dig through the logs yourself”—it has already cross-correlated container metrics, latency curves, the release timeline, and configuration differences for you. It's a reasoned diagnostic conclusion, and you can change your code based on it directly.
Real-world troubleshooting is rarely pinned down in a single round. You have the preliminary conclusion of “connection pool starvation,” but you still need to confirm more: did the latency spike start the very moment v2.2.0-buggy was deployed, or was there a gradual buildup? Was it caused by the single ListProducts endpoint, or was it system-wide? What exactly did v2.2.0-buggy change in its configuration? You need to drill down further to verify—and all of this, again, without leaving the IDE and without re-entering the context.
In Qoder, you just follow up:
Overlay and compare the release times with the latency curve, confirm the causality.
Compare the key configuration differences between v2.2.0-buggy and v2.1.0. Which endpoints are affected the most?
Is there any anomaly in connection release latency?
STAROps supports multi-turn conversation. The context is preserved throughout the same conversation thread—it knows you're still asking about the product-catalog service, it knows you care about the connection pool problem tied to ticket OPS-1024, and it won't rescan all the data on every round. Just like chatting with an SRE colleague who knows the system well, you ask follow-up questions round by round, gradually narrowing the scope of the investigation.
It pulls up a correlation analysis of release times and the latency curve—latency rose immediately after v2.2.0-buggy was deployed at 14:06, P95 climbed sharply to its peak during the second deployment between 14:06 and 14:22, and latency returned to normal after the rollback to v2.1.0. The timing lines up precisely. It helps you compare configuration differences between versions—pinpointing the specific changes to connection-pool parameters like SetMaxOpenConns, SetMaxIdleConns, and SetConnMaxLifetime, as well as the abnormal introduction of a SetProduct write operation. In the end you might pin it down to this: v2.2.0-buggy not only squeezed the connection pool to its limit, it also inserted an unnecessary database write into the query path, and the two factors combined drained the connection pool instantly.
The root cause is found, and the fix is clear too—restore the connection-pool parameters to reasonable values, remove the redundant SetProduct write, and add a 100ms context timeout to the query to keep slow queries from blocking.
The value of this scenario is depth. A single round of diagnosis gives you a direction; multiple rounds of follow-up help you pin the problem down to the specific code change. The whole process requires no ops query syntax at all—you don't need to understand Prometheus QL or SLS query syntax; you only need to describe what you want to know in natural language.
The first two scenarios helped you locate the root cause: the v2.2.0-buggy version of the product-catalog service squeezed the database connection pool to its limit and introduced an unnecessary write operation into the query path, driving the ListProducts endpoint's P95 latency up to 1875.8ms. But diagnosis isn't the finish line—you still need to turn this conclusion into a concrete code fix, get it committed, and push it toward release.
Keep asking in Qoder:
How should the OPS-1024 connection pool starvation problem be fixed? Give me a concrete code fix, and once it's done, submit an MR for me.Qoder + STAROps doesn't just tell you “where the problem is”—it can fix it directly for you. Based on the earlier diagnostic context—ticket OPS-1024, the connection-pool parameter changes introduced by buggy commit d9420f7, and the ListProducts endpoint's P95 jumping from <60ms to 1875.8ms—it generates concrete fix code:
Fix plan (12 changes): File to fix: src/product-catalog/main.go
What you get isn't a vague “check your connection pool configuration,” but a fix precise down to the code file and the specific parameters. But what matters more is what happens next—you don't have to perform these changes by hand. Qoder + STAROps takes over the entire commit process: it automatically creates the fix branch fix/product-catalog/revert-ops-1024-pool, commits & pushes the modified code to the remote. Then, through the MCP protocol, it calls the Yunxiao Codeup API to automatically create a MergeRequest targeting the master branch, with the MR title fix/product-catalog: revert OPS-1024 DB pool starvation and pg_sleep audit—even the MR description is auto-generated, including the full incident background, root-cause analysis, and fix notes. When you open Yunxiao Codeup in your browser, the MR is already there waiting for your review.
The value of this scenario is the closed loop. In the traditional workflow, there's still a “translation cost” between locating the root cause and writing the fix code—you have to understand the technical details of the problem yourself, figure out how to change it and which files to touch, and then manually go through the Git flow and log in to the code platform to create an MR. Qoder + STAROps eliminates that entire cost: the diagnostic conclusion connects directly to the fix code, and the fix code turns directly into a MergeRequest. From discovering the problem to an MR waiting for review, the whole process can be done in a single IDE window, with no need to switch to any other platform in between. A developer's coding decisions are no longer based only on code logic and local tests—they're backed by real production data. The fix you submit isn't just “logically correct,” it's also “aware of the production environment.”
Now that you've seen the three scenarios, you might be wondering: how is all this done?
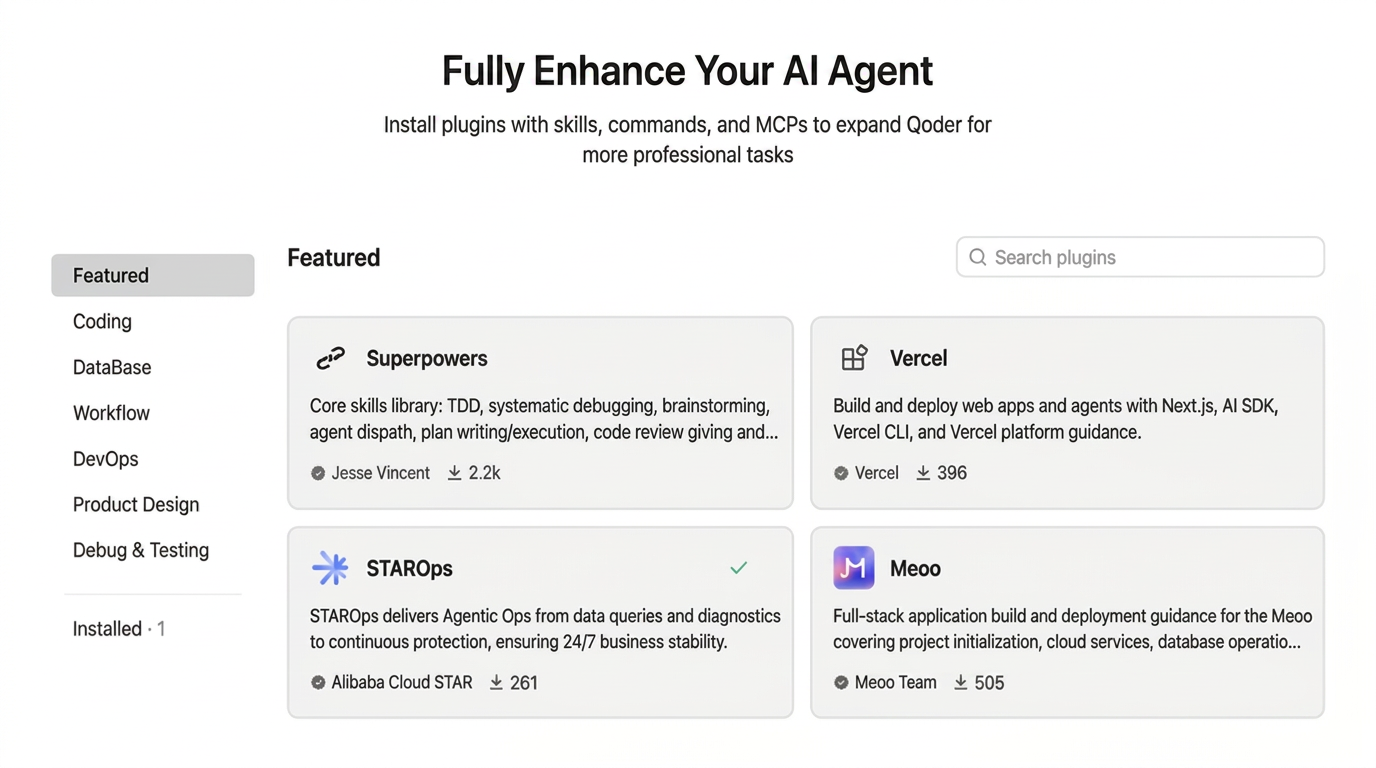
The answer is Qoder's plugin mechanism. STAROps provides an official plugin; once you install it with one click from the Qoder plugin marketplace, every ops-related question you ask in the chat box is routed to STAROps.
The call chain is simple: you type natural language → Qoder recognizes the ops intent → the request is forwarded to STAROps → STAROps performs cross-domain data queries and root-cause reasoning → the structured conclusion returns to your IDE.
The security mechanism follows Alibaba Cloud's enterprise-grade standards: it inherits RAM permissions (no privilege escalation), performs read-only queries (no changes), applies automatic data masking (no leaks), and keeps a full audit trail (traceable). Credentials use the default Credentials SDK chain and support environment variables, config files, and OIDC—no plaintext keys required.
It's worth noting that STAROps comes in three capability forms: intelligent assistant (instant Q&A diagnosis), long-running task (continuous inspection and guarding), and digital employee (an ops agent with configurable duties and permissions). What you invoke inside Qoder is the intelligent assistant—instant, precise, and triggered on demand, best suited for developers to quickly gain ops insights while coding. If you later need continuous monitoring (for example, “automatically keep an eye on things for an hour after a release”), you can upgrade to a long-running task.
Three steps to get going, 3 minutes end to end:
Step 1: Install the STAROps plugin. In Qoder Desktop, switch to the Quest view and search for “STAROps” in the plugin marketplace to install it with one click.
Step 2: Configure your Alibaba Cloud credentials. It follows the default Credentials SDK chain standard and supports multiple methods—environment variables, config files, OIDC, and more—with no need to configure plaintext keys.
Step 3: Start asking. Open the Qoder chat box and simply describe, in natural language, the ops question you want to investigate.
New STAROps users get 10,000 credits valid for one month, plus an additional free allowance of 2,500 credits each month. For reference: a single lightweight query costs about 30 credits, and a full cross-domain root-cause diagnosis costs about 200 credits.
At this point, what this article describes is really one concrete thing: developers gain STAROps's ops diagnostic capabilities through Qoder. But if you pull back a little, you'll find the significance goes beyond "you can query production from the IDE."
In the traditional model, the capability boundary between development and ops is rigid. Developers write code, ops keeps the system running, and the two rely on people relaying messages, tickets circulating, and meetings to stay in sync. After the STAROps plugin connects to Qoder, this boundary is crossed by technology rather than people for the first time—developers can gain ops insights without learning ops tools, and ops teams no longer have to pull logs for developers, because diagnostic capability becomes infrastructure available to everyone through Qoder and the STAROps plugin.
This is the first step toward breaking down the information barrier between Dev and Ops. For developers, there's no more playing telephone with information—you can sense the production state as you write code, and troubleshooting compresses from hours to minutes. For ops teams, it dramatically reduces the energy consumed by repetitive data pulls and basic troubleshooting tickets, freeing up time to focus on high-value work like architecture optimization and building reliability systems. When development and ops share the same production context, not only will incident recovery be faster, but those "hit the same trap over and over" problems will grow rarer—ultimately delivering a two-way boost to the efficiency and stability of the entire engineering team.
You can head straight to qoder.com to download Qoder, finish setup in 3 minutes, and immediately experience troubleshooting production issues with a single sentence inside the IDE. Register now to claim 10,000 STAROps credits and put production-environment diagnostic capability right into your Qoder.
Seeing Every User Step: How Session Replay and Heatmaps Drive Evidence-Based UX Optimization

776 posts | 60 followers
FollowApsaraDB - September 2, 2026
OpenAnolis - August 4, 2026
Alibaba Cloud Community - July 17, 2026
Alibaba Cloud Native Community - August 13, 2026
Bryan, Zhang - June 17, 2026
Alibaba Cloud Community - August 12, 2026
776 posts | 60 followers
Follow CloudMonitor
Automate performance monitoring of all your web resources and applications in real-time
Learn More DevOps Solution
Accelerate software development and delivery by integrating DevOps with the cloud
Learn More AgentLoop
An Agent self-evolution platform designed to make your Agents progressively smarter and more attuned to users.
Learn More Log Management for AIOps Solution
Log into an artificial intelligence for IT operations (AIOps) environment with an intelligent, all-in-one, and out-of-the-box log management solution
Learn MoreMore Posts by Alibaba Cloud Native Community

