When users report that "the page keeps spinning," "nothing happens after I tap the button," or "the content froze halfway through loading" in a Flutter app, most engineers immediately check API latency, error logs, or crash stacks. But production problems rarely have a single cause. One wait can span a user operation, page state, a network request, on-device rendering, error handling, and calls to native platform capabilities.
Looking at only one type of log can easily lead to an incomplete conclusion:
The Alibaba Cloud Real User Monitoring (RUM) Flutter SDK addresses these problems for Flutter apps. Through alibabacloud_rum_flutter_plugin, it collects context in the Dart layer — pages, network, action, LongTask, exceptions, resource snapshots, and custom business fields — and passes that data to the native RUM SDK for reporting and correlation. This article uses these implementation details to show how to turn a single user wait into a traceable, verifiable account of what happened in production.
A typical Flutter interaction path breaks down roughly into the following stages:
The user taps a button
-> Flutter Action detection
-> business state machine update
-> network request or local task execution
-> response returns
-> page content refresh
-> list, rich text, or image rendering
-> the page reaches a stable state
All the user sees is "it took a long time." What engineers actually need to answer is where the time went: before the tap, before the request, during the request, after the response, or in the on-device rendering stage.
Traditional troubleshooting struggles to answer this question because it has several blind spots.
| Visibility gap | Production symptom | Why traditional methods fall short |
|---|---|---|
| Behavior gap | No response after tapping a button, repeated taps, accidental triggers | Manual instrumentation can easily leave gaps, and definitions are inconsistent |
| Network gap | Slow APIs, failed requests, retries on weak networks | With only URL and duration, it is hard to get back to the specific page and user session |
| Rendering gap | Stuttering on list refresh, slow rich text rendering, brief page freezes | Server-side logs show nothing about main Isolate pressure on the client |
| Exception gap | State machine exceptions, parse failures, null object errors | The Dart stack lacks the preceding action and resource context |
| Session gap | Many logs exist, but they cannot be connected into a complete picture of a single user session | Engineers must manually correlate logs by timestamp, device, app version, and page path |
The point of Flutter RUM, then, is not to collect a few more SDK event types. It is to build a connected timeline around a real user's experience:

Only when these events land in the same RUM Session can engineers turn "the page keeps spinning" into a set of testable hypotheses.
A Flutter app's observability path is inherently cross-layer. The Dart layer knows about Widget, Route, Zone, Dio, and business state; the Android, iOS, and HarmonyOS native SDKs are better suited to platform-side reporting, network tracing configuration, and data delivery.
Structurally, the Flutter RUM SDK splits into three layers:
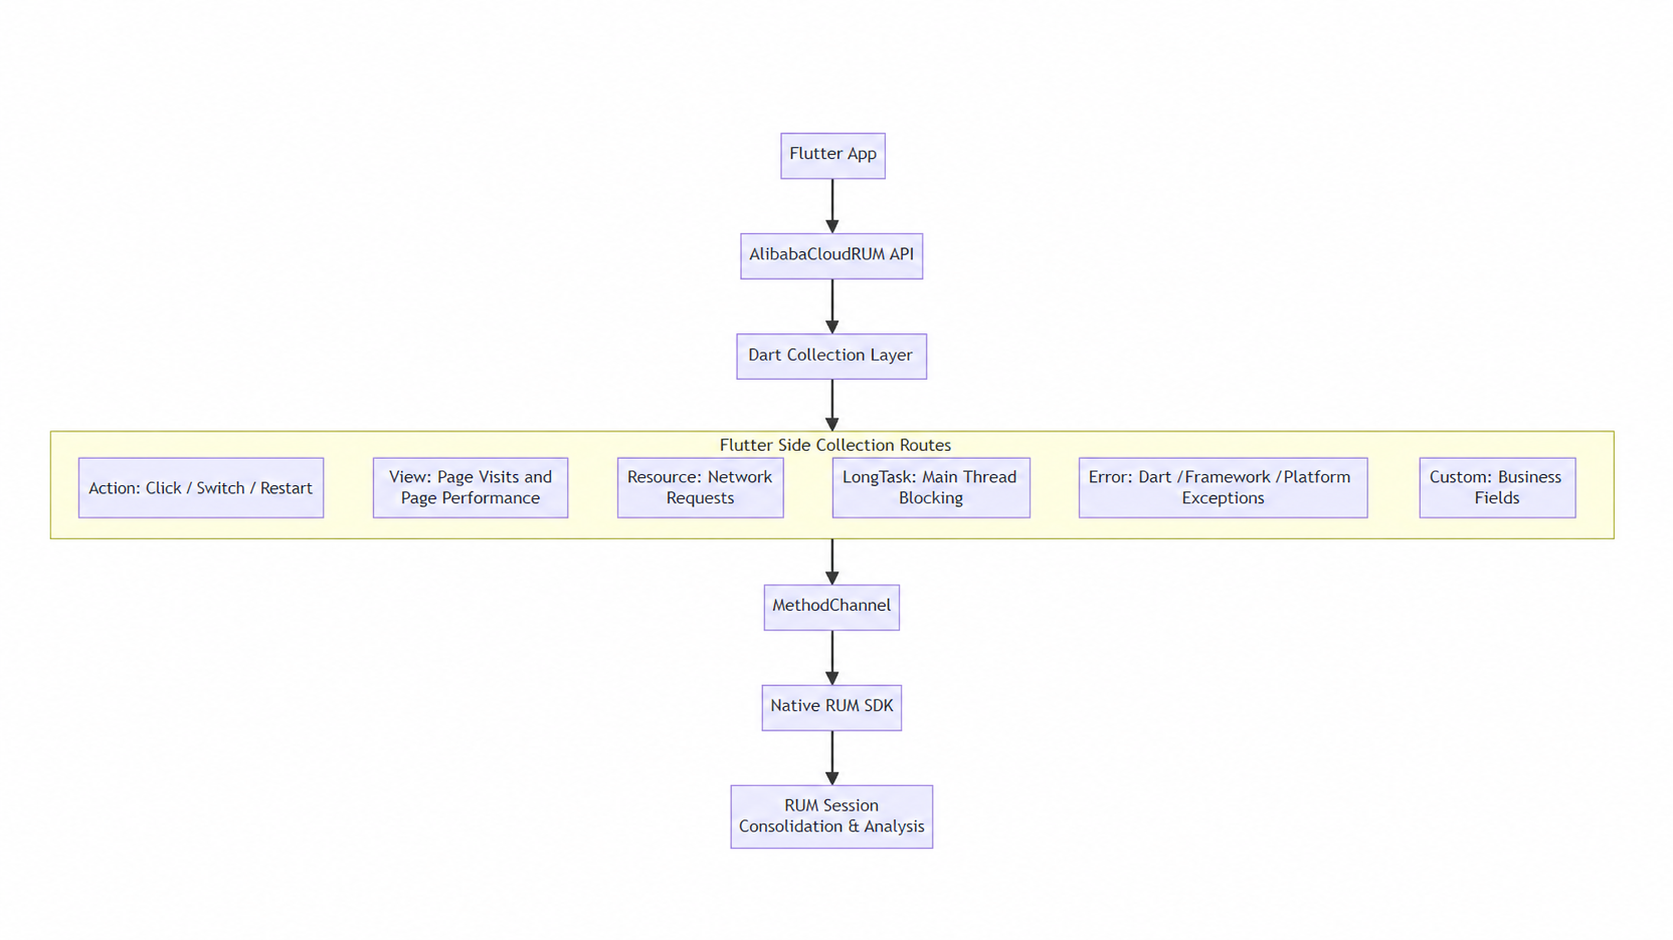
The Dart collection layer preserves Flutter semantics — Dart Zone exceptions, Route lifecycles, Widget taps, Dio requests, and main Isolate blocking. The native SDK handles the standardized events and platform-side reporting.
This division of labor pays off most in complex Flutter scenarios: the Flutter side keeps the semantics of what the user did, what state the page was in, and how content refreshed, while the native and RUM sides place that data into a single session view.
"Nothing happens after I tap" is a common report from production users. It can have several causes:
The first step here is not to open the API logs. Instead, confirm that the user behavior actually reached the same session.
User behavior in Flutter is not a native button tap, and it is not a Web DOM click. An operation starts as pointer events and coordinates, so the SDK has to go back into Flutter's HitTest, Widget, Element, and RenderObject system to recover the semantics.
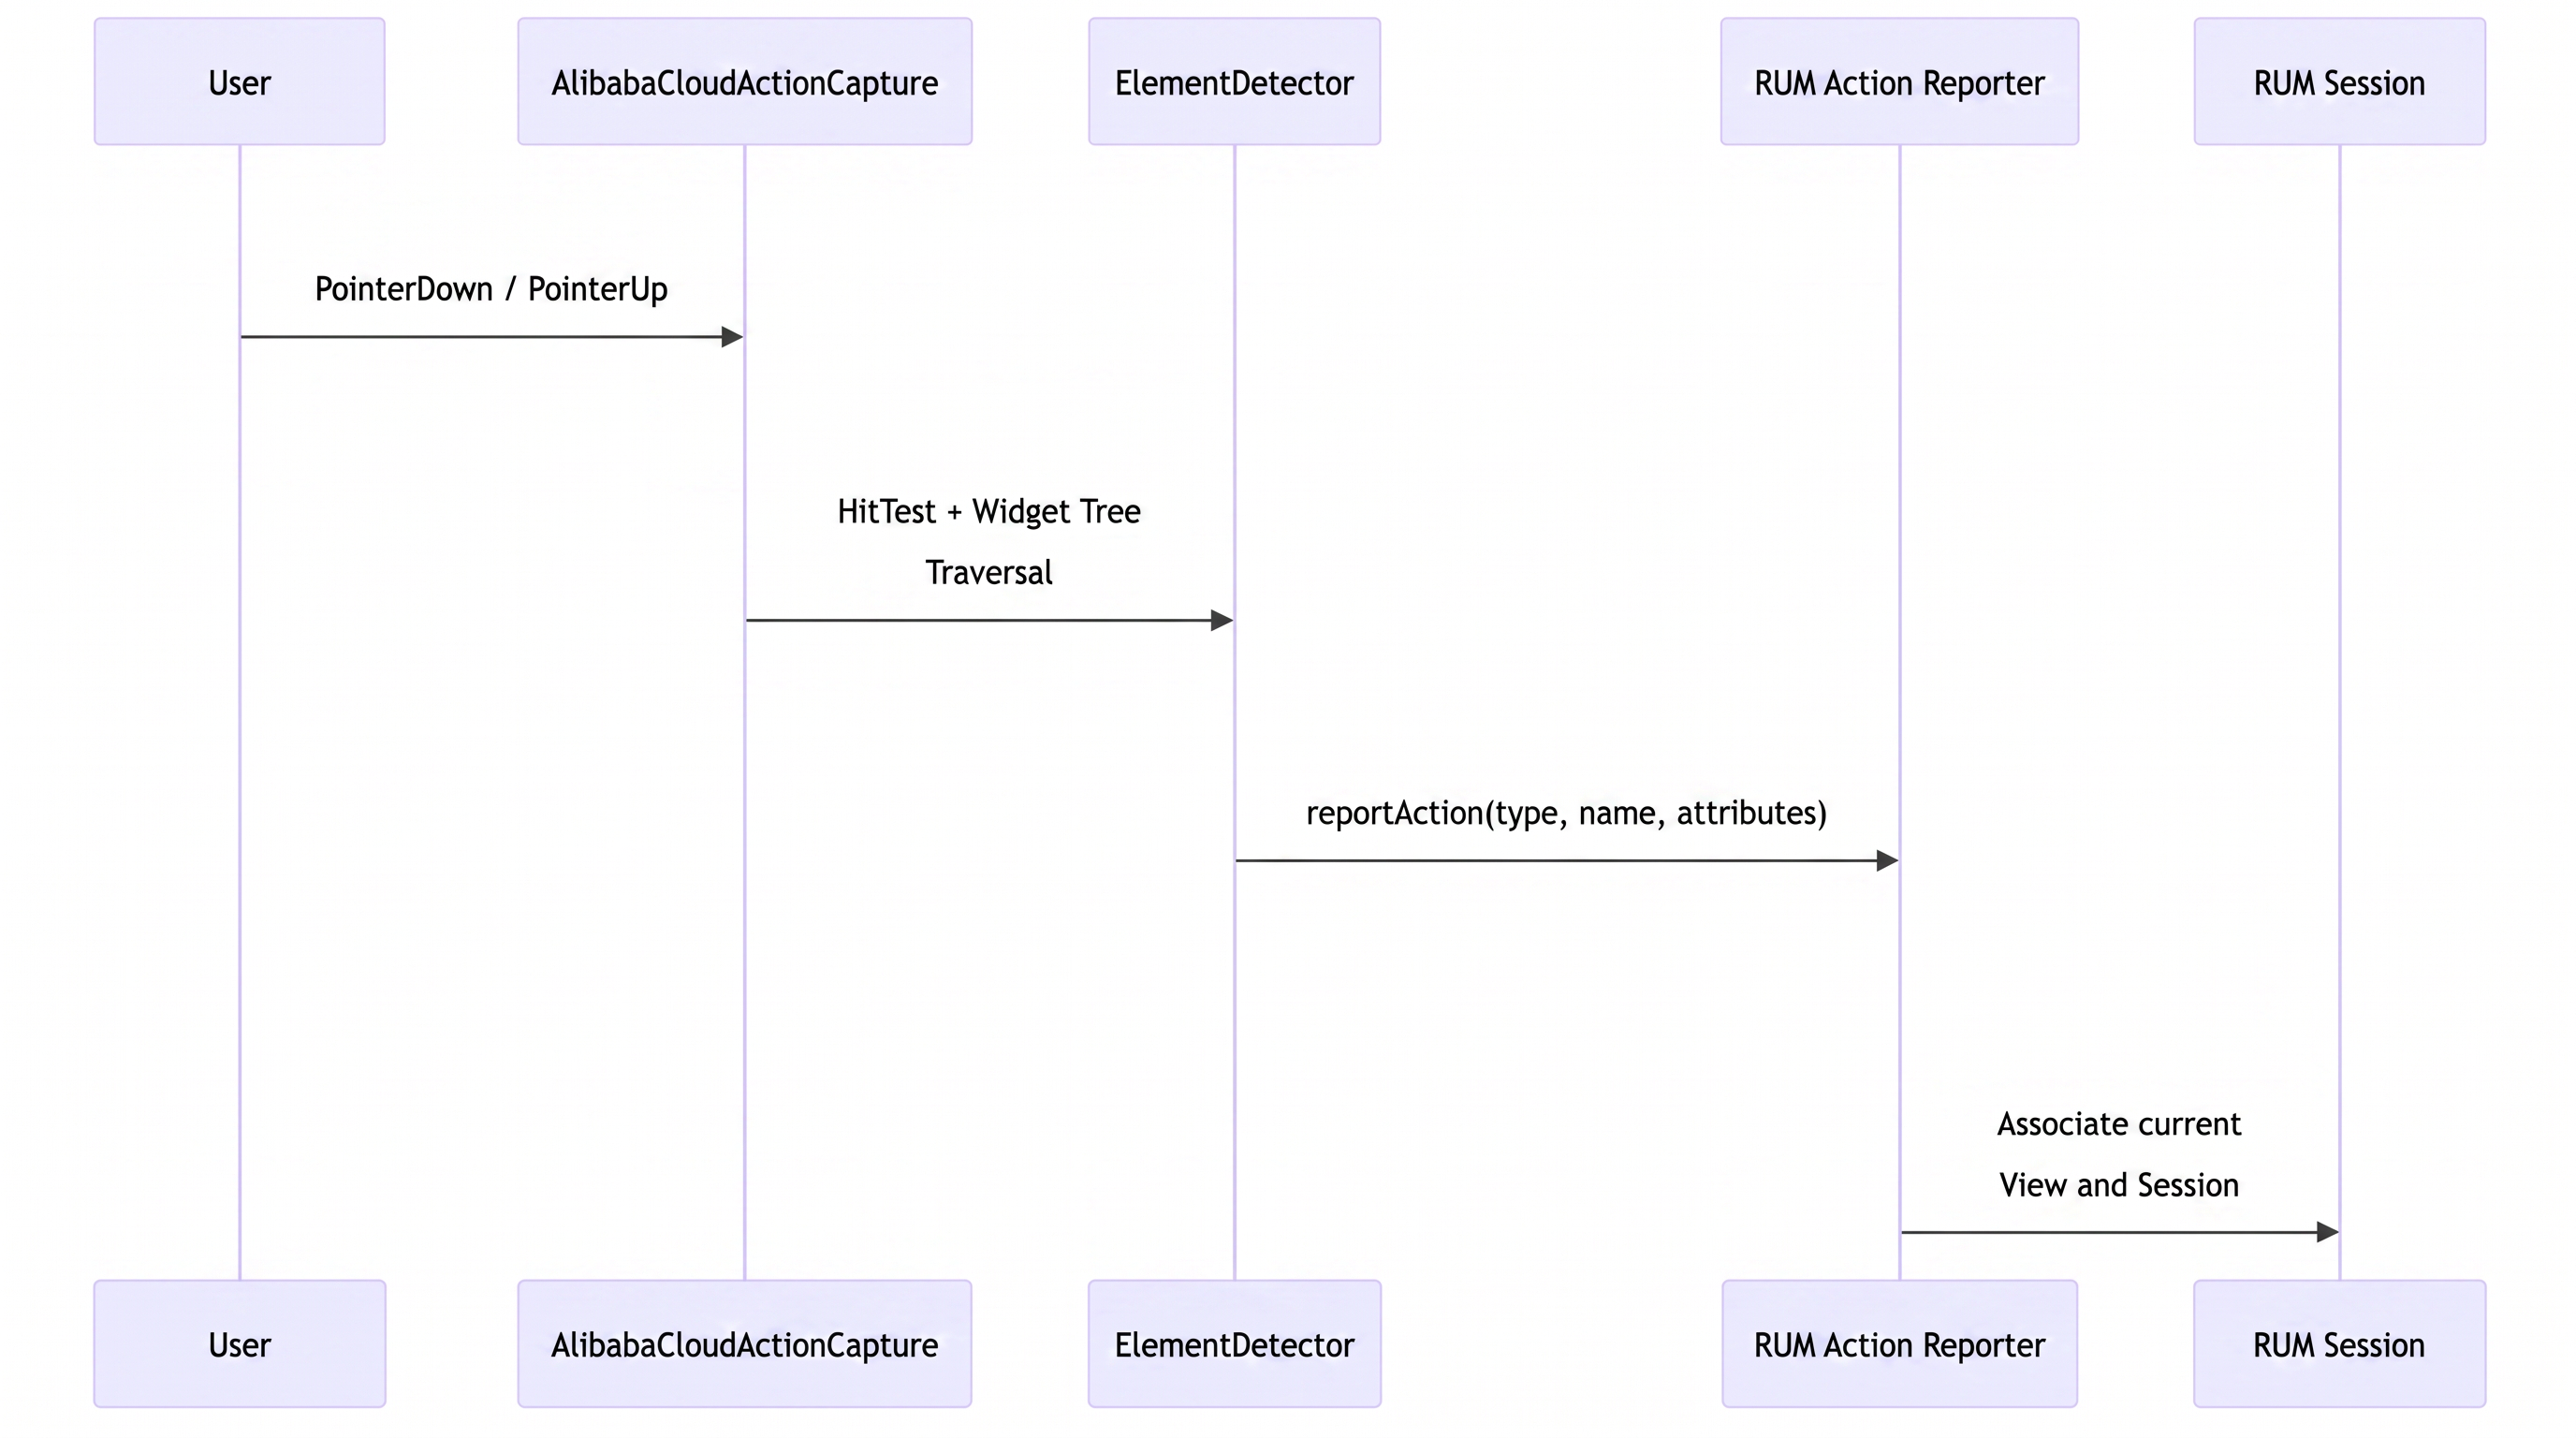
Automatic action detection is not enabled by calling start() alone. The app must wrap the target widget tree in AlibabaCloudActionCapture:
AlibabaCloudActionCapture(
  child: MaterialApp(
    navigatorObservers: [
      AlibabaCloudRUMNavigationObserver(enablePagePerf: true),
    ],
    home: HomePage(),
  ),
);
For critical business operations, do not rely on default control detection alone. Add business semantics through ActionAnnotation:
ActionAnnotation(
  description: 'Submit Button',
  attributes: {
    'screen': 'order_detail',
    'action': 'submit_order',
    'actor_type': 'human',
  },
  child: ElevatedButton(
    onPressed: _submitOrder,
    child: Text('Submit'),
  ),
);
An operation driven by an automated business flow does not necessarily produce a standard pointer event that Flutter can observe. When the app calls a method directly, triggers a background task, or runs a rules engine, the SDK cannot recover the full semantics from a tap alone; if the tap comes from system accessibility or a simulated coordinate tap, it may still look like an ordinary tap. We therefore recommend that the app explicitly report an Action or a custom event at critical points in the flow, and add context such as actor_type.
| actor_type | Meaning | Typical scenario |
|---|---|---|
| human | Action performed by a human user | Tapping submit, refresh, back, or retry |
| automation | Automated business flow | Scheduled retries, batch processing jobs, rule-triggered jobs |
| system | Triggered by an automated system process in the app | Automatic recovery, background refresh, timeout retry |
With that in place, RUM has more than a single tap to work with when you investigate "nothing happens after I tap." By correlating the action with business events and subsequent resource, LongTask, and error events, engineers can reconstruct who or what initiated the operation and how it executed.
When a user says "the page keeps loading," the API is not necessarily slow. Break it into at least these stages:
The Flutter RUM SDK offers two entry points at the network layer: when you use dart:io directly, wrap the global HttpClient through HttpOverrides; when you use Dio, integrate through AlibabaCloudRUMDioInterceptor.
final dio = Dio();
dio.interceptors.add(
  AlibabaCloudRUMDioInterceptor(
    onProvideSnapshots: (requestOptions, response, error) {
      return ResourceSnapshots(
        requestHeaders: {
          'content-type': requestOptions.headers['content-type'] ?? '',
        },
        responsePayload: response?.data is Map
            ? {
                'code': response?.data['code'],
                'requestId': response?.data['requestId'],
              }.toString()
            : null,
      );
    },
  ),
);
For a Flutter app, network monitoring is valuable not because it records one request's latency, but because it puts the API request, the user operation, and the page state back on the same experience path. When a user says "the page keeps spinning," engineers need to know whether the request was even sent, whether the API timed out, whether the server-side path failed, whether the page updated promptly once the response came back, and on which page, which version, and in which session all of this happened.
Where business policies permit, RUM can correlate client-side requests with server-side traces, turning troubleshooting from reading one isolated API log into reconstructing the full path of a user's wait. Requests involving third-party domains, sensitive APIs, or user input must still comply with business security policies and data governance requirements.
Resource latency alone is not enough. For critical business paths, add business fields that help locate the problem:
| Field | Suggested source | Purpose |
|---|---|---|
| flow_id | Session-level custom property | Links the requests and page events within a single business process |
| request_id | Resource extension property or server-side trace | Aligns client-side requests with server-side logs |
| business_stage | Custom event or log | Identifies the business stage in which the wait occurred |
| result_status | Custom event | Distinguishes success, user cancellation, network failure, and server-side exception |
| error_stage | Custom event or log | Distinguishes failure stages such as parameter validation, networking, server-side processing, and rendering |
These are not built-in fields the SDK promises to collect by default; they are context we recommend you add for business troubleshooting. The SDK provides a stable foundation for collection, reporting, and session correlation. Business semantics still have to be designed by engineers around their own paths and compliance requirements.
When a Flutter page refreshes its content, it may trigger state updates, rich text rendering, image loading, long-list diffing, or JSON parsing. If that logic consumes too many on-device resources, the user sees a page that stutters, while the server-side logs look entirely normal.
The Flutter RUM SDK watches for periods when the Dart main Isolate remains unresponsive. When text rendering, list updates, or complex layouts consume too many client-side resources, the SDK can record a LongTask event and place the blocking duration, affected page, and user session on the same timeline.
Engineers do not need to focus on the underlying detection algorithm here. What matters is preserving evidence when the server has returned the content but client-side rendering cannot keep up. Then, when a user reports that "the page froze," the investigation can move beyond the server and network APIs to Flutter's rendering and state-update path.
These events fill in what happens on the client after the server responds. Within a single session, for example, you might see:
Action: Submit
-> Resource: /api/order/submit 200
-> Custom: business_stage = render_result
-> LongTask: 236ms
-> LongTask: 410ms
-> View: OrderResultPage
At that point engineers can form a working hypothesis: the API response is not slow, but the main Isolate is under significant pressure while the page refreshes. From there, keep verifying against data volume, list length, rich text node count, device model, and page structure.
LongTask is therefore best treated as one signal in user-experience troubleshooting. It can point to pressure in client-side rendering or state updates; correlated with action, resource, error, and business events on the session timeline, it helps engineers determine whether the bottleneck is on the client. If LongTask events cluster during a page refresh after the API has already returned, inspect list refreshes, layout calculations, and state-update frequency first.
The stack trace may make many Flutter exceptions easy enough to understand. What it does not explain is why the exception occurred for this user, on this page, after this operation.
A state exception, for example, may come from:
The user taps submit
-> the request goes out
-> the server returns an unexpected structure
-> Dart parsing logic enters the exception branch
-> the Flutter state update fails
-> an Error is reported
From the exception stack alone, it is hard to tell whether the parameter was invalid, the business API failed, a native capability failed, or the Flutter state machine failed to handle the response.
Flutter exception collection cannot rely on a single entry point. During initialization, the SDK hooks into several exception paths:
For standard cases, just use start():
void main() {
  AlibabaCloudRUM().start(MyApp());
}
void main() async {
WidgetsFlutterBinding.ensureInitialized();
await AlibabaCloudRUM().initialize();
runApp(MyApp());
}Note that if you choose initialize() and call runApp() yourself, some capabilities that depend on post-startup application state must be enabled separately at an appropriate time. For example, if you need LongTask detection, enable it after runApp() using the current public API:
await AlibabaCloudRUM().initLongTaskDetection();For business troubleshooting, the exception alone is not enough. We recommend adding the following semantics:
| Field | Meaning | Example |
|---|---|---|
business_stage |
Current business stage |
submit, pay, render_result
|
request_id |
Request ID | Correlates the request with server-side logs or traces |
error_stage |
Failure stage |
param, network, server, render
|
result_status |
End reason |
success, user_cancel, server_error
|
When an error occurs, it is no longer just a Dart stack. Engineers can analyze it alongside the preceding action, resource, page state, and business stage.
When investigating API problems, engineers usually want more context, such as error codes, request IDs, server response status, and whether required parameters are missing. But headers and payloads may contain user input, authentication data, or sensitive business fields, so they cannot be collected in full by default.
The SDK therefore uses an explicit Provider mechanism:
ResourceSnapshotProvider or Dio's onProvideSnapshots.For critical requests, keep only the fields that help diagnosis and contain no sensitive content, for example:
ResourceSnapshots(
requestHeaders: {
'content-type': requestOptions.headers['content-type'] ?? '',
},
responsePayload: response?.data is Map
? {
'code': response?.data['code'],
'requestId': response?.data['requestId'],
}.toString()
: null,
);Resource snapshots are meant to add troubleshooting context, but the size limits are not a substitute for your own data masking and compliance review. When integrating, prioritize the minimum diagnostic fields such as error codes and request identifiers, and avoid uploading user input or full business responses.
This is a deliberate design trade-off: the SDK provides a channel for collection and reporting, but it does not read application payloads on its own. This prevents monitoring logic from affecting the application's data flow or introducing compliance risks.
A Flutter page is usually not a static page that loads once. After a user opens an order, payment, content detail, or workbench page, the app may need to show the page container first, then load API data, render lists or rich text, and finally make key operations such as submit, refresh, and filter available. Page metrics are therefore better suited to answering a few business questions: did the page appear promptly, is the key content visible, are the main operations available, and can the user finish the current task quickly.
The Flutter RUM SDK collects standard routing scenarios through AlibabaCloudRUMNavigationObserver:
MaterialApp(
navigatorObservers: [
AlibabaCloudRUMNavigationObserver(
ignoreRoutes: ['/splash'],
enablePagePerf: true,
),
],
home: HomePage(),
);For non-standard page structures such as IndexedStack, PageView, and Tab containers, you can also use the manual API:
AlibabaCloudRUM().startView('OrderDetailPage');
AlibabaCloudRUM().stopView('OrderDetailPage');Page performance collection is organized around a single Route lifecycle and focuses on the following metrics:
| Metric | Meaning | How it is collected on the Flutter side | Questions it answers |
|---|---|---|---|
| TD | Transition Duration | Derived from TransitionRoute.animation state; in the current public implementation it is not necessarily reported as a separately queryable field | Whether entering a key page is slowed down by the page transition |
| FP | First Paint (FP) | Captured through WidgetsBinding.instance.addPostFrameCallback | Whether the page container appears quickly |
| FCP | First Contentful Paint (FCP) | Traverses RenderObject to detect content such as RenderImage, RenderParagraph, and TextureBox | When the first piece of business content, such as order, list, or detail content, appears |
| TTI | Time to Interactive (TTI) | Based on the effective element coverage rate; a fallback timing policy applies when the threshold is not reached | When the main operations, such as submit, refresh, and filter, become available |
FP, FCP, and TTI in Flutter are estimates based on Flutter rendering and page structure, so they should not be interpreted in the same way as browser page metrics. For PlatformView, custom-painted widgets, or complex page containers, validate each metric against the page structure. Page performance data is reported through extension fields when the View event ends; the fields ultimately available for queries depend on the View extension map and each platform SDK's support.
For complex pages, read page metrics together with business stages. For example:
View: OrderDetailPage
-> FP / FCP / TTI
-> Action: Submit
-> Resource: /api/order/submit
-> Custom: business_stage = render_result
-> LongTask: page renderThat lets you separate "the page itself opens slowly" from "the business processing is slow after the page opens."
Once RUM data reaches the platform, troubleshooting should not stop at handwritten queries. Start with the troubleshooting question, then let the observability platform help structure the analysis path.
Within the capabilities currently available in Cloud Monitor 2.0 (CMS 2.0), STAROps can serve as an assisted analysis entry point. CMS 2.0 refers here to the new generation of Cloud Monitor console capabilities, while STAROps provides assisted analysis of observability data. Product names, scope, and entry points are subject to current console availability.
For a Flutter app, the question is no longer "which table should I query?" It sounds much more like a real production troubleshooting question:
Which pages had abnormal wait times in the past hour?
In sessions where nothing happened after the submit button was tapped, did LongTask events or slow requests appear at the same time?
Are API errors concentrated in a specific version or a specific class of device?
After a version upgrade, did Resource errors on the page and TTI increase at the same time?STAROps helps by organizing these natural-language questions into an analysis path:
Start from the symptom. First describe the problem: "the page keeps spinning," "nothing happens on tap," "the API fails."
Narrow the impact. Use application version, operating system, device, page, region, and time window to define the affected scope.
Correlate session events. Link the action, page performance, resource, error, LongTask, and business events from the same user session.
Develop working hypotheses. Possible causes include client-side blocking, a slow API, retries along the path, rendering failures, or resource errors concentrated in one version.
Inspect individual samples. Return to a specific session, page path, request path, and exception context to test each hypothesis.
What STAROps can do, which entry points are available, and how well the analysis works all depend on what the console currently supports, and the results also depend on the completeness of the underlying RUM data. If pages are named inconsistently, Actions lack business semantics, resource snapshots are not masked and enriched as needed, or tracing is not connected end to end, assisted analysis can only see part of the picture. Automatic collection on the SDK side and semantic enrichment on the business side remain the foundation.
Trying to cover every Flutter page, network request, and business flow from day one increases integration costs and makes definitions harder to standardize. A better approach is to pick one representative critical page and establish a minimal end-to-end loop first.
Standard case:
void main() {
AlibabaCloudRUM().start(MyApp());
}Custom startup flow:
void main() async {
  WidgetsFlutterBinding.ensureInitialized();
  await AlibabaCloudRUM().initialize();
  runApp(MyApp());
}Mark the key pages with AlibabaCloudRUMNavigationObserver or startView/stopView.
Collect the core business requests with AlibabaCloudRUMDioInterceptor or HttpOverrides.
Use AlibabaCloudActionCapture and ActionAnnotation to detect key operations such as submit, refresh, back, and retry.
Once view, action, resource, LongTask, and error collection are in place, RUM already records what the user did, whether requests succeeded, whether the page stuttered, and whether an exception occurred.
But these technical events do not fully explain the business process. Developers still need to know which flow the events belong to, which stage the user is waiting on, and how the operation ended. The application only needs to add enough context to answer those questions:
| Context to add | Reference fields | Questions it answers |
|---|---|---|
| Flow correlation | flow_id, request_id | Whether these pages, operations, requests, and exceptions belong to the same flow |
| Execution stage | business_stage | Whether the wait occurs during the request, processing, parsing, or rendering stage |
| Execution result | result_status, error_stage | How the flow ended, and at which stage the exception occurred |
In an AI conversation scenario, flow_id can map to one conversation or task, and business_stage can separate stages such as calling the model, streaming the response, and rendering the page. Design the field names and values around your actual business workflow; they are not built-in fields provided by the Flutter RUM SDK.
Design fields so that they explain problems; you do not need to cover every state change. Once these semantics are in place, the next step is to check that they show up in the same session as view, action, resource, LongTask, and error events.
After integration, do not just check whether individual metrics appear. Verify that RUM captures a complete user timeline:
View: OrderDetailPage
-> Action: Submit
-> Resource: /api/order/submit
-> Custom: business_stage / result_status
-> LongTask: page render
-> Error: optional
Once RUM can stitch this trace together, extend it step by step to more pages, more business processes, and more business semantics.
Production experience problems in a Flutter app usually cannot be explained by one API, one stack trace, or one tap. A report that "the page keeps spinning" may involve client-side interaction, a network request, server-side processing, page rendering, main Isolate blocking, and exception handling. Server-side logs alone cannot show the client-side page state or rendering behavior; a Flutter exception stack alone cannot show the preceding action and request path.
The Flutter RUM SDK brings these scattered events back into one user session: what the user did, whether the request went out, whether the API failed, whether the page stuttered, and whether an exception occurred on the same path. Instead of a pile of isolated logs, engineers get a coherent record they can trace, correlate, and review.
This approach is already implemented in the Alibaba Cloud RUM Flutter SDK. For the exact APIs, fields, and supported platforms, refer to the official release and the integration documentation. There is still room to go further in areas such as complex gesture detection, LongTask analysis, standardized business fields, compliance policies for resource snapshots, and field consistency across platforms.
For mobile developers, the goal of observability is not to collect more data. It is to break a real wait into a verifiable trace so engineers can understand the problem faster.

780 posts | 60 followers
FollowAlibaba Tech - April 24, 2020
Alibaba Cloud Native Community - August 14, 2026
XianYu Tech - September 4, 2020
Alibaba Cloud Native Community - April 15, 2026
Alibaba Cloud Native Community - August 7, 2026
Alibaba Clouder - November 24, 2020
780 posts | 60 followers
Follow Application Real-Time Monitoring Service
Build business monitoring capabilities with real time response based on frontend monitoring, application monitoring, and custom business monitoring capabilities
Learn More CloudMonitor
Automate performance monitoring of all your web resources and applications in real-time
Learn More Cloud Parallel File Storage
The fully-managed scalable parallel file system can meet your requirements on high-performance computing.
Learn More Elastic High Performance Computing
A HPCaaS cloud platform providing an all-in-one high-performance public computing service
Learn MoreMore Posts by Alibaba Cloud Native Community

