In 2026, AI Agents are making the critical leap from "chatting" to "doing": writing and executing code themselves, operating browsers to search for information, and invoking a series of tools to complete complex tasks. The prerequisite for allowing an Agent to safely "take action" is providing a secure and efficient execution environment. Consequently, sandboxes have become the de facto standard for Agent infrastructure.
Agent Sandbox, launched by Alibaba Cloud Container Compute Service (ACS), serves as the sandbox compute foundation for production-grade AI Agents, featuring MicroVM-level isolation, elasticity of 15,000 instances per minute, and memory-level hibernation and wake-up. However, a new problem arises: the better the isolation, the more the sandbox interior resembles a black box. Operations and security teams find it difficult to see which models the Agent invoked, what code it ran, and which external services it accessed.
Now, this puzzle piece is in place: OpenTelemetry eBPF Instrumentation (OBI) from Cloud Monitor 2.0 (CMS) officially supports the ACS Sandbox scenario. Without changing a single line of code or rebuilding images, every model invocation, tool call, and external access by an AI Agent within the sandbox automatically generates standard traces and metrics.
Code executed by AI Agents has a distinct characteristic: much of it is dynamically generated by large models on the spot. Such code is untrusted and unpredictable, and must never run in the same container as production workloads. Agent Sandbox addresses this with a MicroVM-level isolated execution environment: each sandbox has a dedicated kernel with end-to-end isolation across compute, network, and storage. Even if the code inside exhibits abnormal behavior, it remains securely locked in the "box."
Beyond security, there are three sets of capabilities tailored for Agent scenarios.
Large-scale, low-latency elasticity. Agent tasks are often bursty: a reinforcement learning session (AgentRL) might instantly require thousands of environments, while peak requests for an online service (Agent Serving) can surge. Agent Sandbox supports creating up to 15,000 sandboxes per minute. Combined with a warm pool, it achieves hundred-millisecond startup times, and image caching reduces pull times by over 90%. In a public case study, MiniMax spun up 5,000 sandboxes within 10 seconds.
State retention. Running sandboxes support on-demand hibernation with memory state fully preserved, enabling rapid wake-up within 1 to 10 seconds. Combined with checkpoint/restore, an Agent's execution state can be saved, migrated, or cloned. When multi-turn conversations are interrupted, there is no need to destroy and rebuild the environment. No CPU or memory fees are charged during hibernation, and per-second billing makes "use it and pause it" truly cost-effective.
Open ecosystem. Agent Sandbox provides two integration methods: an E2B-compatible SDK and the Kubernetes-native Sandbox CR. It is compatible with mainstream Agent frameworks such as AgentScope and LangGraph, covering typical sandbox scenarios like Code Interpreter (code execution) and Browser Use (browser operations).
The sandbox solves the problem of "whether it is safe to run," but "how well it runs" remains shrouded in mystery. Attempting to apply traditional Application Performance Management (APM) solutions one by one, you find that all three paths lead to dead ends.
SDK instrumentation cannot get in. Traditional application monitoring relies on integrating SDKs or attaching language-specific instrumentation agents in the code. However, the code running inside the sandbox is generated by large models on the fly — it is diverse and unpredictable. Agent frameworks themselves also span multiple languages such as Python and Node.js. You cannot expect the model to "add monitoring instrumentation while generating code."
Host-level collection has nowhere to go. ACS is a serverless container compute service with no user-visible nodes, leaving traditional DaemonSet-based host-level monitoring components with no foothold. The strong isolation of MicroVM completely blocks the path of "looking in from the host."
Sandbox lifecycles are too short. Created in hundreds of milliseconds, destroyed after use, hibernated at any time — by the time you log in to troubleshoot, the environment has long been gone. A host-centric monitoring model simply cannot keep up with this ephemeral rhythm.
The result: when an Agent task fails, you do not know whether it was a slow model response, a tool timeout, or a code error. When token costs rise, you cannot tell which stage consumed them. When the security team wants to audit which external addresses the sandbox code accessed, they can only sift through network logs manually.
OBI takes a different approach: instead of entering the application, it stands between the application and the kernel.
OBI intercepts application communications at the kernel and library function levels, parses protocol semantics, and directly outputs standard OpenTelemetry telemetry data. This means that regardless of whether the sandbox runs Go, Java, Python, Node.js, or .NET, and regardless of the HTTP framework, database, or large model provider involved, monitoring data is automatically collected without modifying any code. For sandbox scenarios where "code is dynamically generated by models on the spot," this is virtually the only viable solution.
In the ACS Sandbox environment, OBI runs alongside the sandbox workload as a sidecar. After installing the ARMS instrumentation onboarding assistant ack-onepilot (v5.2.2 or later), you only need to add a few labels to the workload YAML. The OBI sidecar is then automatically injected, and the collected data is centrally aggregated in the CMS console. (Running eBPF inside a sandbox requires specific Linux kernel permissions, which can be enabled for your account by submitting a ticket.)
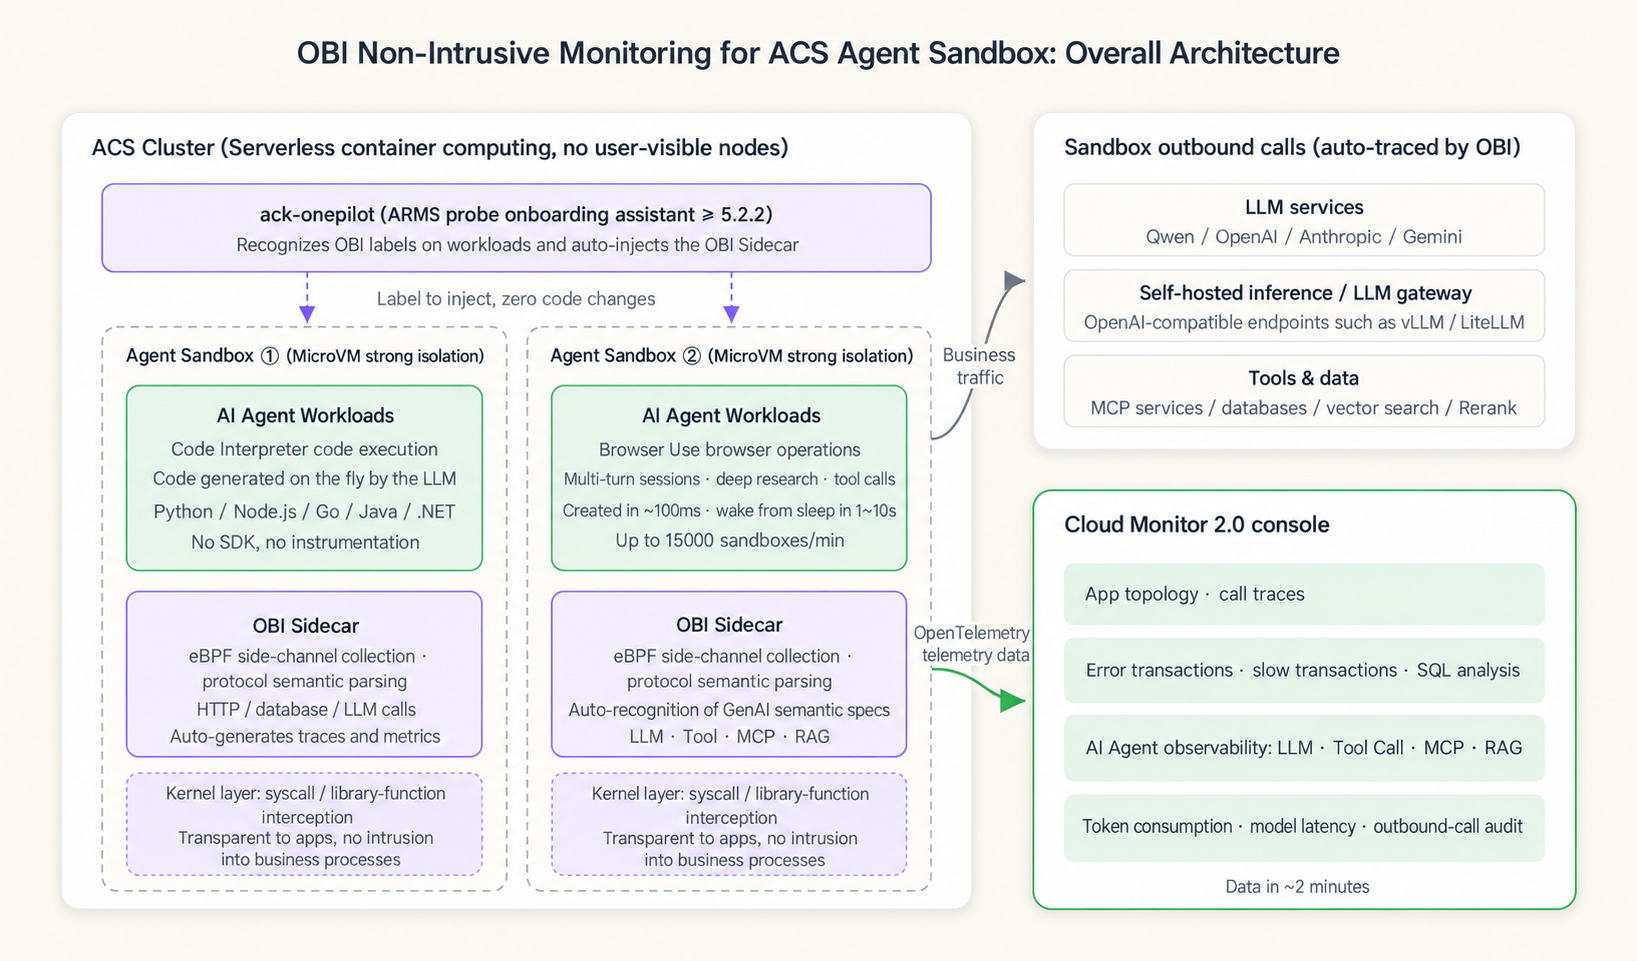
What can you see after integration?
The first layer is the full suite of classic application monitoring: application topologies, traces, abnormal transactions, slow transactions, and SQL analysis. Every external call by the Agent inside the sandbox generates a trace — whether the bottleneck is model inference or tool execution, a single trace reveals it all.
The second layer is the true highlight of this upgrade: AI Agent observability. OBI features built-in protocol-level tracing for four major GenAI providers — OpenAI, Anthropic, Google Gemini, and Qwen — automatically identifying LLM calls and generating telemetry data according to GenAI semantic conventions:
If your model traffic flows through self-hosted inference services or LLM gateways such as vLLM or LiteLLM, you only need to declare the corresponding host in the configuration. OBI parses them using OpenAI-compatible protocols and includes them in the AI Agent observability view.
For sandbox scenarios, this data simultaneously answers three questions: Performance—which stage is slowing down the task; Cost—which types of invocations are consuming tokens; Security—which external addresses the untrusted code in the sandbox accessed. All of these are recorded out-of-band, naturally serving as an audit ledger.
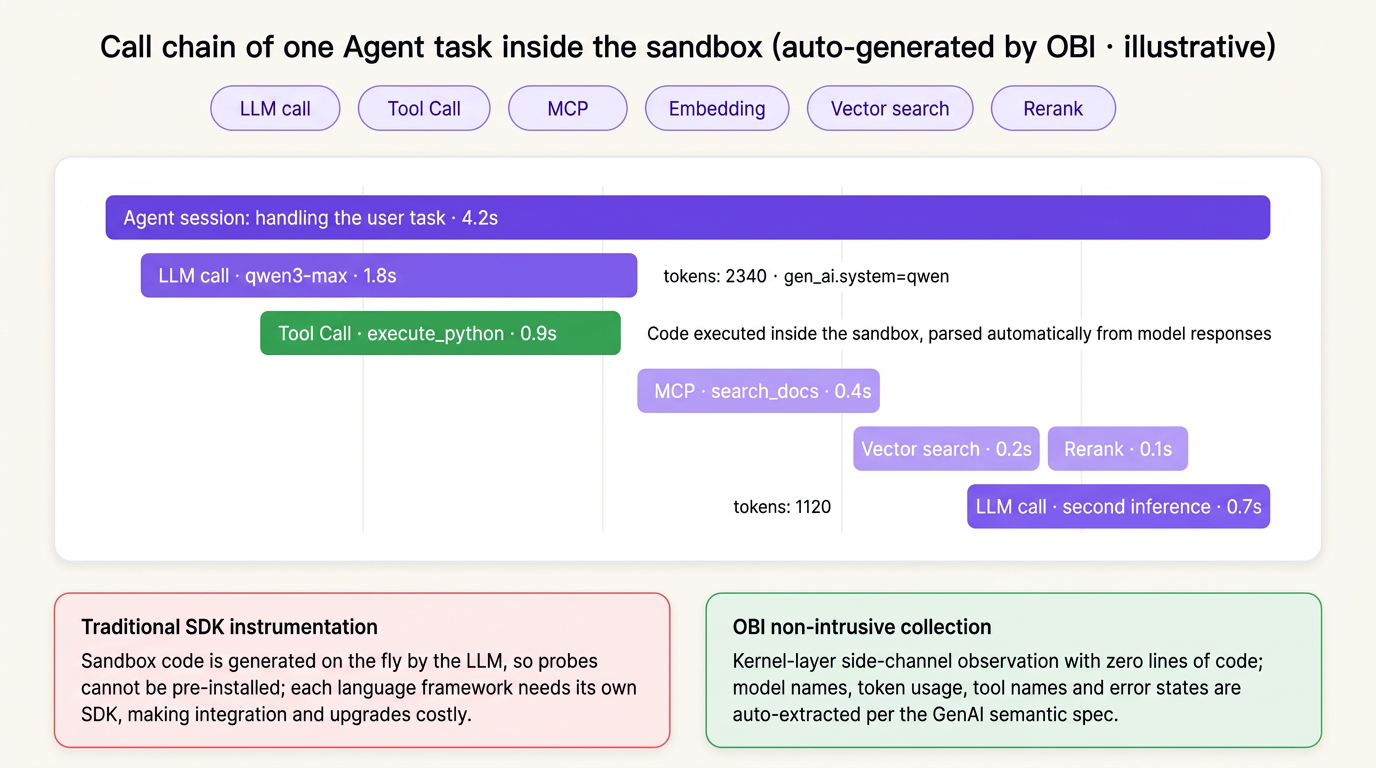
The entire integration process requires no changes to the application code.
Step 1: Install the ack-onepilot component (v5.2.2 or later) for your ACS cluster in the ACS console.
Step 2: Add OBI labels to the YAML file of the target workload:
labels:
  apsara.apm/application-type: obi    # Indicates that this application is integrated via OBI
  armsPilotAutoEnable: 'on'
  armsPilotCreateAppName: "your-application-name"
  armsPilotAppWorkspace: "your-workspace-name"
Step 3: Wait about 2 minutes, then open the CMS console: view topologies and traces under "Application Monitoring," and view model and tool call details under "AI Agent Observability."
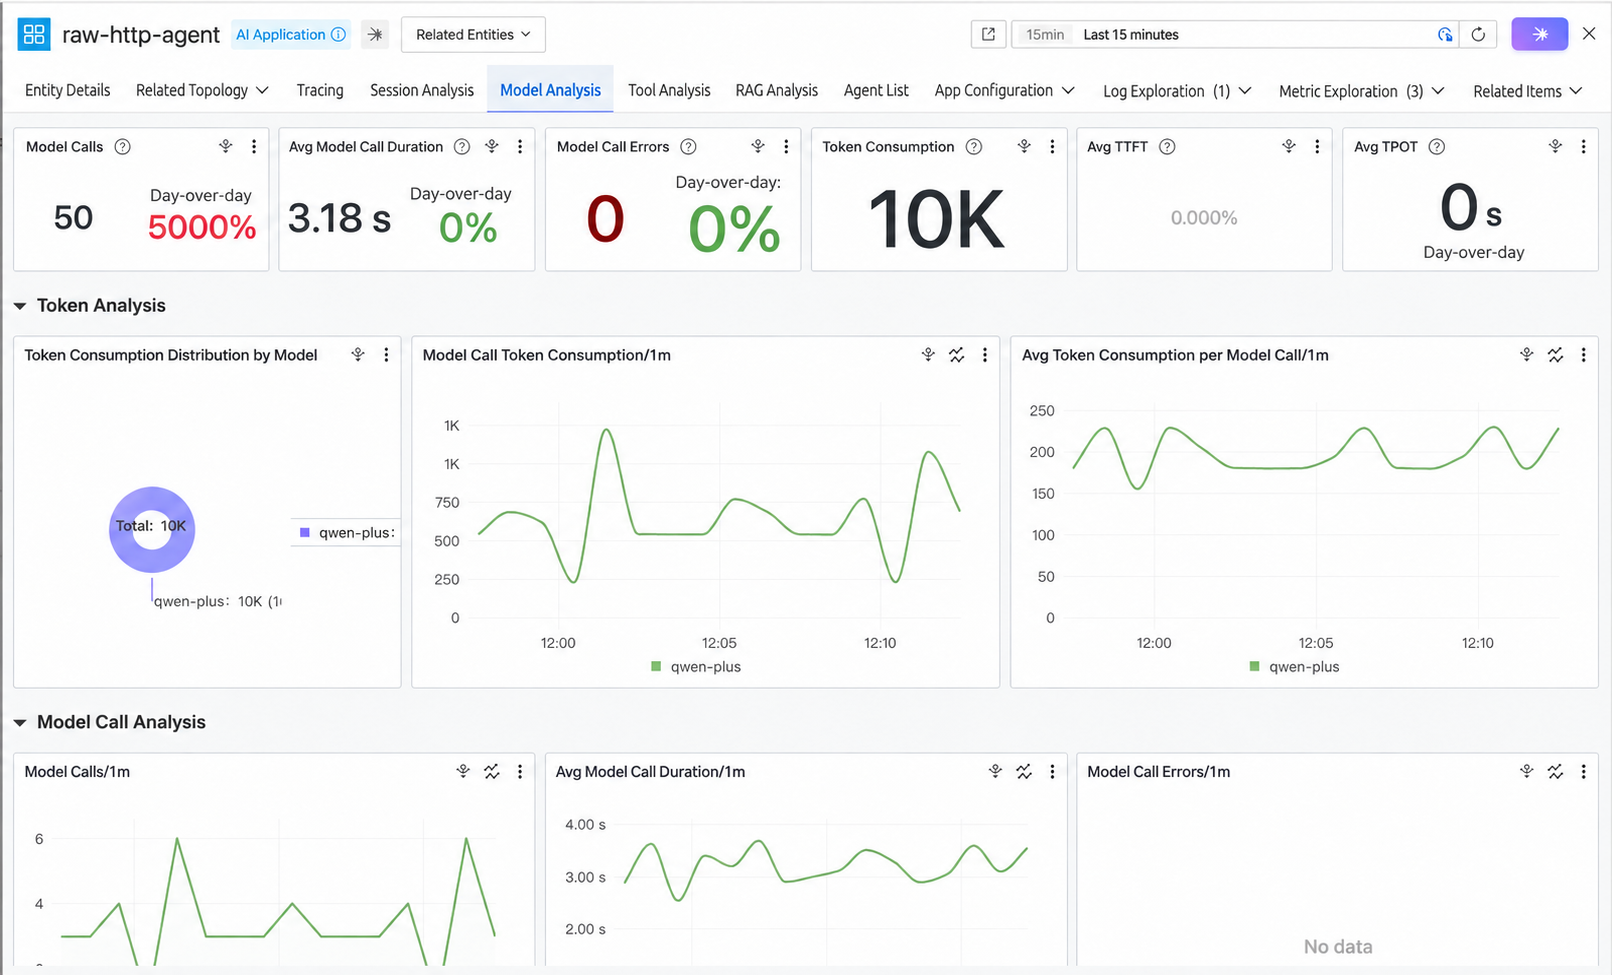
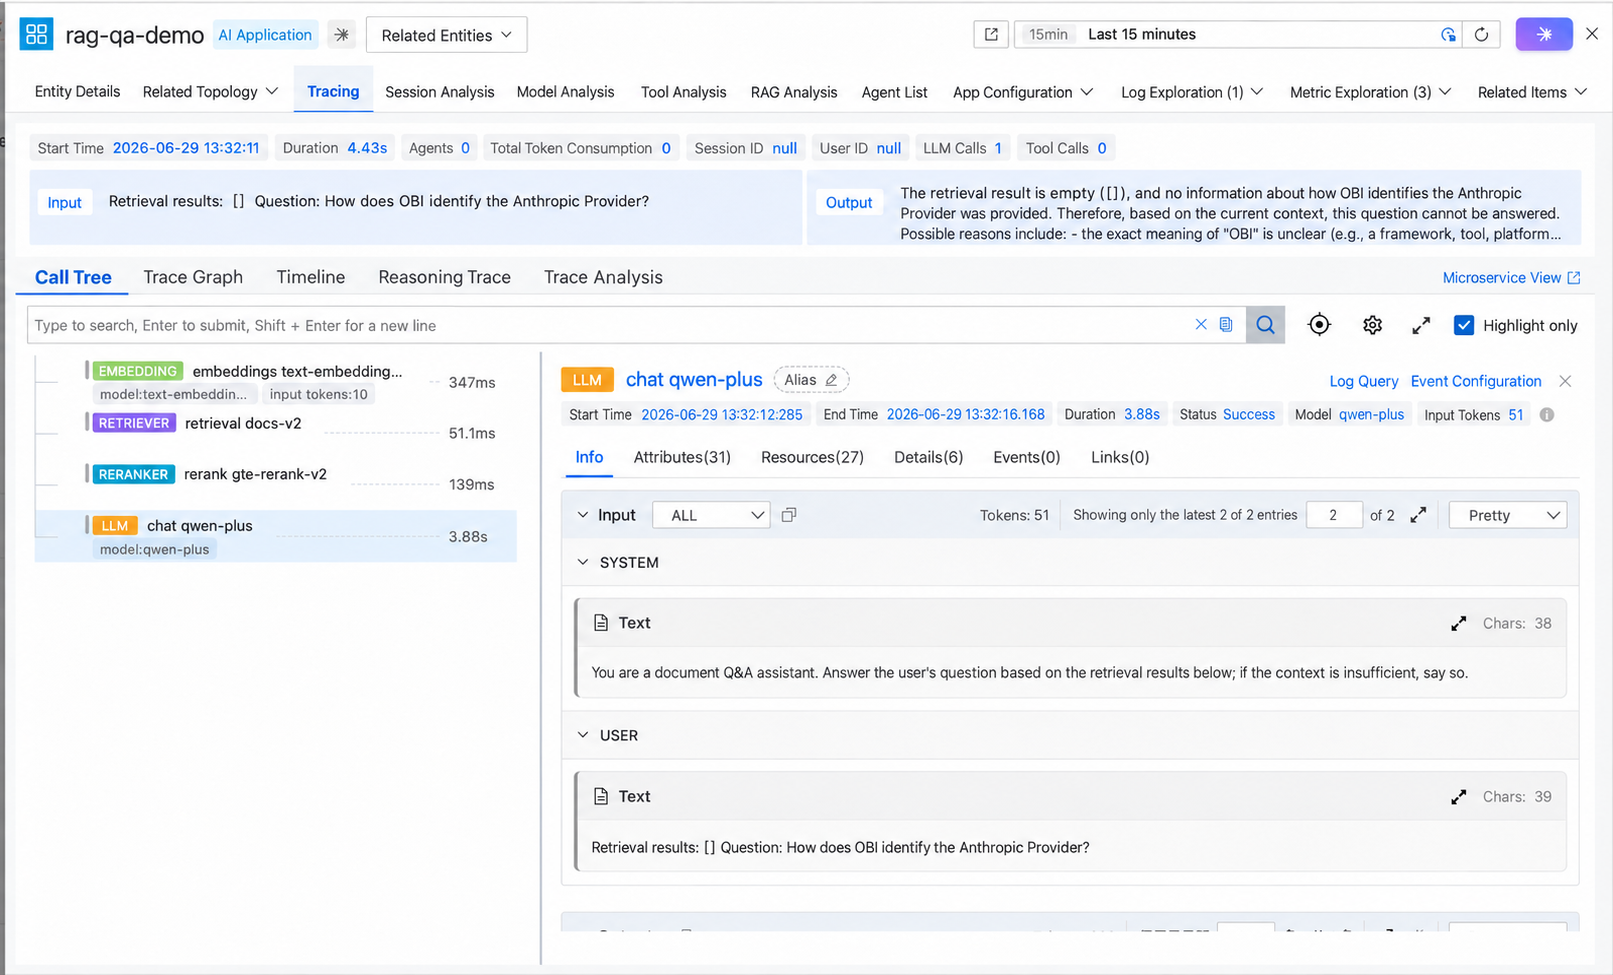
Step 4: Go to the AI Agent application in CMS to view monitoring data:
Competition in Agent infrastructure is moving from the "make it run" phase to the "make it transparent" phase. ACS Agent Sandbox ensures that AI Agents run securely and elastically, while OBI makes every execution transparent and visible. Together, "security" and "observability" for production-grade Agents can coexist for the first time — all at the cost of zero lines of code.
If you are building Agent applications, start with the official documentation "Access ACS applications through OBI": https://www.alibabacloud.com/help/en/cms/cloudmonitor-2-0/access-acs-applications-through-opentelemetry-non-intrusive-monitoring-obi
RocketMQ-A2A Paper Accepted at ACM FSE: Defining a Reliable Collaboration Paradigm for AI Agents

773 posts | 60 followers
FollowAlibaba Cloud Native Community - May 26, 2026
Alibaba Cloud Native Community - June 2, 2026
Alibaba Cloud Native Community - June 10, 2026
Alibaba Cloud Native Community - April 9, 2026
Alibaba Cloud Native Community - July 28, 2026
CloudSecurity - May 26, 2026
773 posts | 60 followers
Follow CloudMonitor
Automate performance monitoring of all your web resources and applications in real-time
Learn More .COM Domain
Limited Offer! Only $4.90/1st Year for New Users.
Learn More ACK One
Provides a control plane to allow users to manage Kubernetes clusters that run based on different infrastructure resources
Learn More
Container Service for Kubernetes
Alibaba Cloud Container Service for Kubernetes is a fully managed cloud container management service that supports native Kubernetes and integrates with other Alibaba Cloud products.
Learn MoreMore Posts by Alibaba Cloud Native Community

