By Huiling
As one of the leading open-source monitoring solutions in the market, Grafana makes data monitoring and visualization easier. It is an open-source data visualization and analysis software that supports querying, visualizing, alerting, and exploring your data, no matter where they are stored. Grafana provides support for various data sources by using data source plug-ins. You can use its extensive data source plug-ins to easily integrate metrics from different platforms, display key performance data through personalized dashboards, and customize alerts.
This article provides a framework to help users understand the installation and configuration of plug-ins, as well as how to utilize the Alibaba Cloud OpenAPI plug-ins in Grafana to visualize cloud data and quickly verify development prototypes.
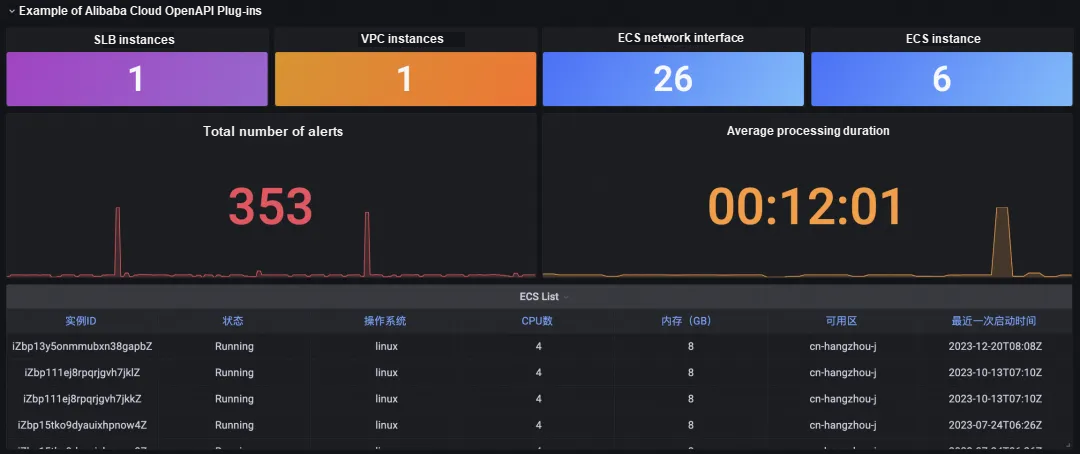
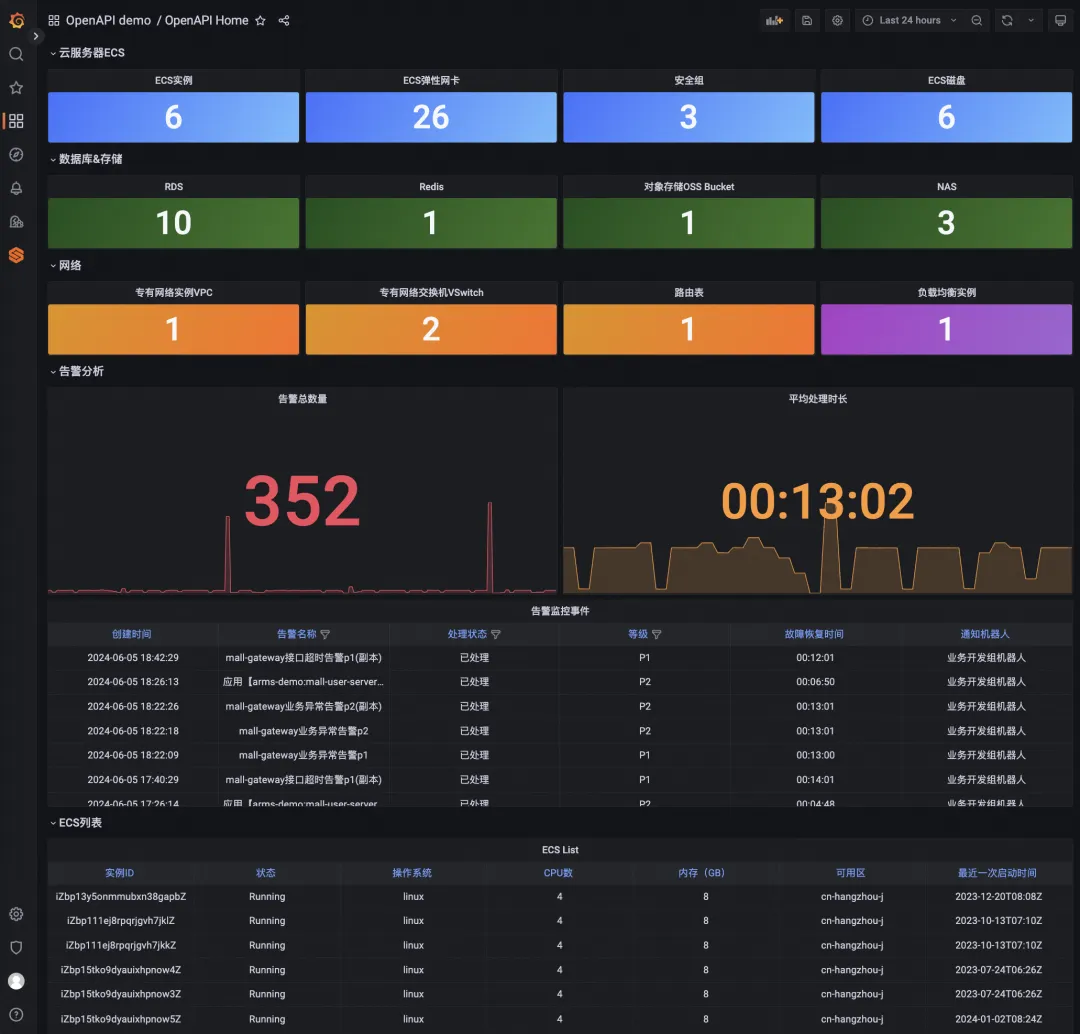
You can use the Alibaba Cloud OpenAPI plug-ins to visualize cloud resources and other information as shown in the following figure.
With fast-paced software development, rapid iteration and innovation verification are keys to maintaining competitiveness. In the traditional development mode, the verification of new features involves great collaboration between the frontend and backend, which leads to efficiency bottlenecks. In addition, effective visualization of monitoring data is essential for efficient decision-making during the development, because it can simplify complex information into simple charts to accelerate problem discovery and resolution. However, it is difficult to directly collect some non-traditional cloud metric data in monitoring tools, which poses additional challenges. As a leading open-source monitoring tool, Grafana simplifies the process of data insight and supports access to diverse data sources. Obstacles to obtaining comprehensive cloud data for monitoring by using Alibaba Cloud OpenAPI include authentication limits, difficulty in integrating non-metric data, and lack of a mechanism to directly set alerts based on OpenAPI data.
To address the above issues, a new Alibaba Cloud OpenAPI plug-in is developed for Grafana. The plug-in uses the following core mechanisms:
• Prototype verification acceleration: As a mature monitoring and visualization platform, Grafana provides rich charts, graphs, and dashboards. You do not need to build a high-quality frontend interface from scratch to display data. With Alibaba Cloud OpenAPI, you can easily obtain and process data on the cloud. This provides great convenience for backend developers to verify new business logic and data analysis methods. The backend can independently and quickly build data-driven business prototypes based on the massive data resources of Alibaba Cloud, quickly build frontend prototypes, and shorten the solution verification cycle.
• Data display expansion: You can call Alibaba Cloud OpenAPI to display non-traditional cloud monitoring data in Grafana. You can also customize the drill-down from the overview dashboard to the detailed resource status or configuration information obtained based on OpenAPI to quickly locate and troubleshoot issues.
• Alert notification: Grafana provides a built-in alert system. You can set conditions based on OpenAPI query results, trigger alerts, and notify relevant personnel through emails and text messages. This improves the ability to respond to changes in Alibaba Cloud resources.
OpenAPI is a calling method for cloud product open interfaces provided by Alibaba Cloud. By using OpenAPI, you can easily call the API interfaces offered by various cloud products and easily achieve features such as control and query. In Grafana, the most common scenario is to use OpenAPI to call APIs of other cloud services to obtain and display data.
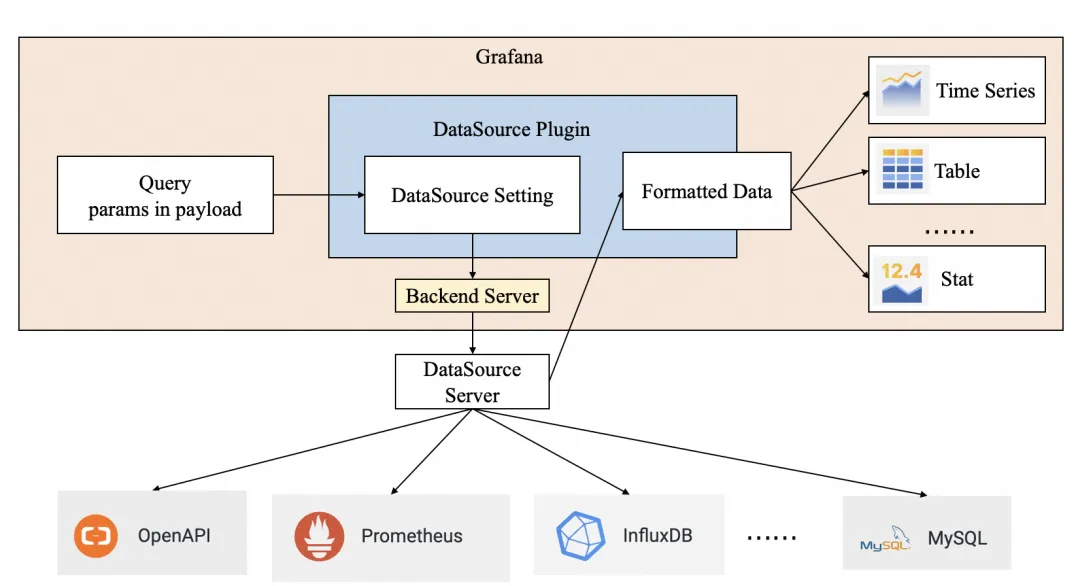
Figure 1: Principle of Grafana data plug-in
If you are using a self-managed Grafana cluster, download the installation package from GitHub, and place it in the Grafana plug-ins directory.
[plug-ins]
allow_loading_unsigned_plug-ins = aliyun-openapi-grafana-datasource-pluginIn the Data Sources panel, add an OpenAPI data source, and configure the following parameters:
|
Parameter |
Description |
|
Name |
You can specify the name of the data source. |
|
AccessKeyId AccessKeySecret |
AccessKeyId: You can call the AccessKey ID of the OpenAPI account. For more information, please refer to View the AccessKey information of a RAM user. |
|
Product |
You can select a cloud product name from the drop-down list or directly enter a name. |
|
Endpoint |
You can obtain the endpoint of OpenAPI from the API documentation of the related cloud product. Service addresses in the multi-region [regionId] format are supported. If the multi-region format is used, you must specify the RegionId parameter in the query parameter. |
|
Version |
You can obtain the cloud product version information from the API documentation of the cloud service. |
|
Style |
You can obtain the style information from the API documentation of the cloud service. |
A configuration example is shown in Figure 2.
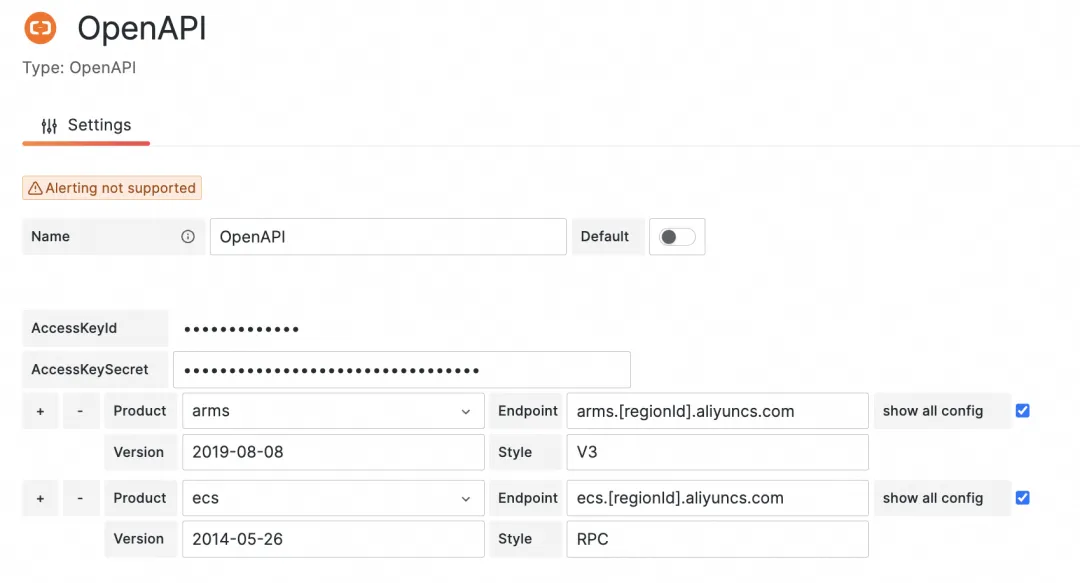
Figure 2 Example of data source configuration
Click Save & Test. If the Data source is working appears, it means that the data source is added.
Configure the query page:
1. On the Action tab, specify the following parameters, as shown in Figure 3.

Figure 3 Query configuration -- Action tab
2. On the Params tab, click Add Param, and then enter a parameter name and value.
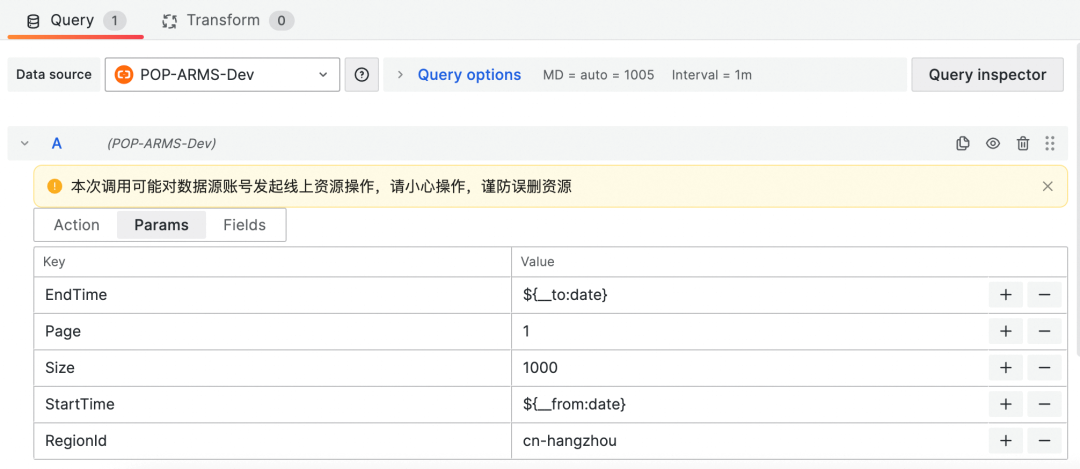
Figure 4 Query configuration -- Params tab
3. On the Fields tab, configure the parsing of the returned results in the Field and $ represents all data. Parse them based on the JSON. Type: Select a data type, and its default value is Auto. Alias: the alias of the parameter column.
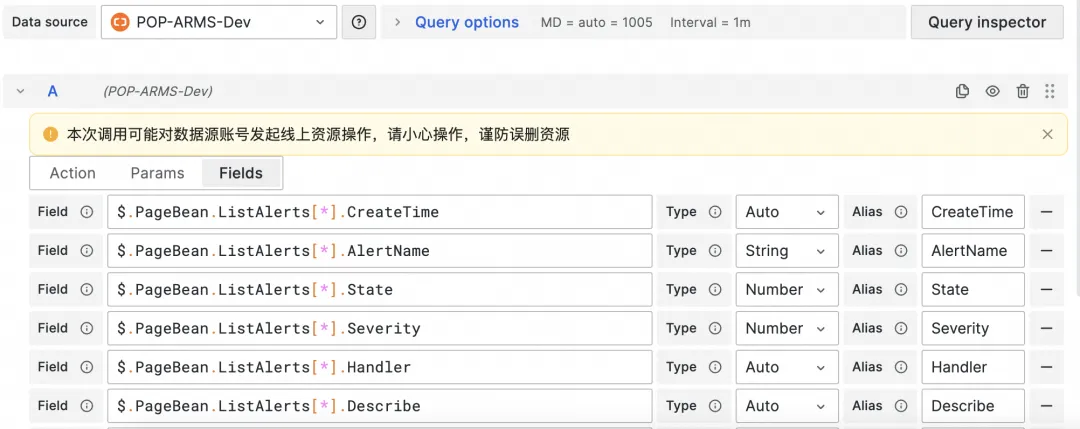
Figure 5 Query configuration -- Fields tab
4. Create a Time Series disk
Create a time series graph. It requires a series of data points associated with timestamps. During configuration, the data must meet the following format standards:
• Timeline (Horizontal Axis): You need to provide a time value that can be converted to the ISO standard time format. In the configuration of the chart, the data type of the time should be selected as Time to correctly parse the time information.
• Data (Vertical Axis): Each timestamp must be a numeric value. In the configuration of the chart, the data type should be selected as Number to ensure that the chart can display the data correctly.
After you configure the chart based on the preceding information, you can view a time series graph that shows the data points sorted in chronological order on the timeline and the value of each data point on the vertical axis. This chart is ideal for observing and analyzing trends over time. Taking the ListAlerts API as an example, you can create a time series graph to display the trend over the time when an alert is cleared, as shown in the figure below.
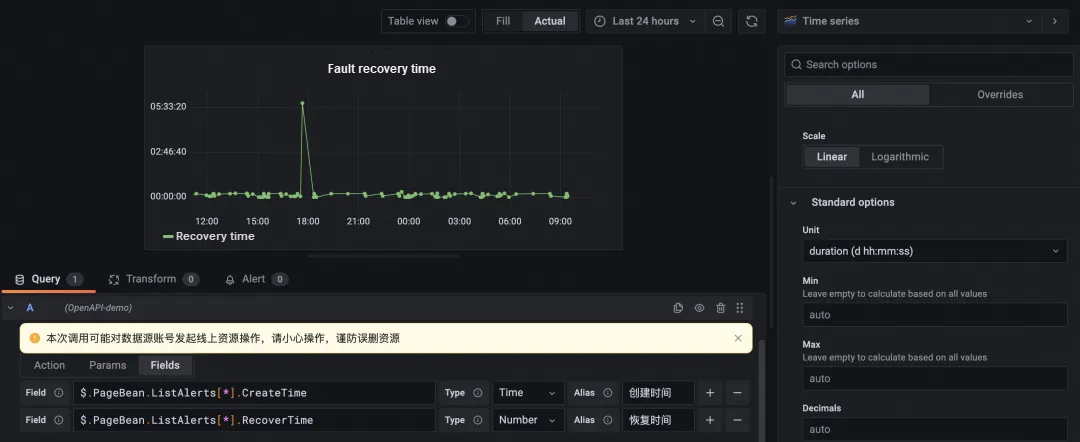
Figure 6 Example of TimeSeries panel
5. Final example
Try it from https://demo.grafana.aliyuncs.com/d/uid_for_demo_home/openapi-home?orgId=1
A Guide to Mastering the CustomResourceDefinition (CRD) - AliyunPipelineConfig

212 posts | 13 followers
FollowAlibaba Clouder - April 26, 2020
Alibaba Cloud Native Community - May 13, 2024
JwdShah - September 2, 2024
ApsaraDB - April 14, 2025
Xi Ning Wang - August 21, 2018
H Ohara - November 20, 2023

212 posts | 13 followers
Follow Simple Log Service
An all-in-one service for log-type data
Learn More Quick BI
A new generation of business Intelligence services on the cloud
Learn More Managed Service for Grafana
Managed Service for Grafana displays a large amount of data in real time to provide an overview of business and O&M monitoring.
Learn More Cloud-Native Applications Management Solution
Accelerate and secure the development, deployment, and management of containerized applications cost-effectively.
Learn MoreMore Posts by Alibaba Cloud Native