By Jia Zhenghua (Core Member of SysOM SIG), Huang Tuquan (Core Member of SysOM SIG), and Mao Wenan (Head of SysOM SIG)
Are you confused by the sudden OOPS and strange functions on your screen? Why can't the memory be applied for when the memory is so large? Are you confused when the business cycle jitters and ping commands occasionally take a long time? Why does business traffic or CPU not increase when there are only a few lines of the program to run? Why does business traffic or CPU not increase when the CPU usage rate is above 90%, or a large number of tasks are returned after you run the ps command, and you do not know how to choose?
When you try to find open-source products for O&M in the community, what you are likely to find is a bunch of professional, repetitive, conflicting commands, and similar monitoring systems. You cannot understand these commands, and monitoring systems are just panels monitoring CPU usage, memory usage, and network throughput. They cannot solve your problems. What's more, the low upfront investment of Linux brings extremely high O&M costs.
Therefore, SysOM is here. System Operation & Maintenance (SysOM) is a comprehensive operating system O&M platform built by the SysOM SIG of OpenAnolis, which integrates the successful commercial O&M practical experience of SIG members. It can help you realize complex operation system management on a unified platform, such as host management, system monitoring, exception diagnosis, log audit, and security control.
SysOM was born mainly to solve the following problems:
The OpenAnolis SysOM was created due to the problems above. Currently, SysOM has the following four capabilities:
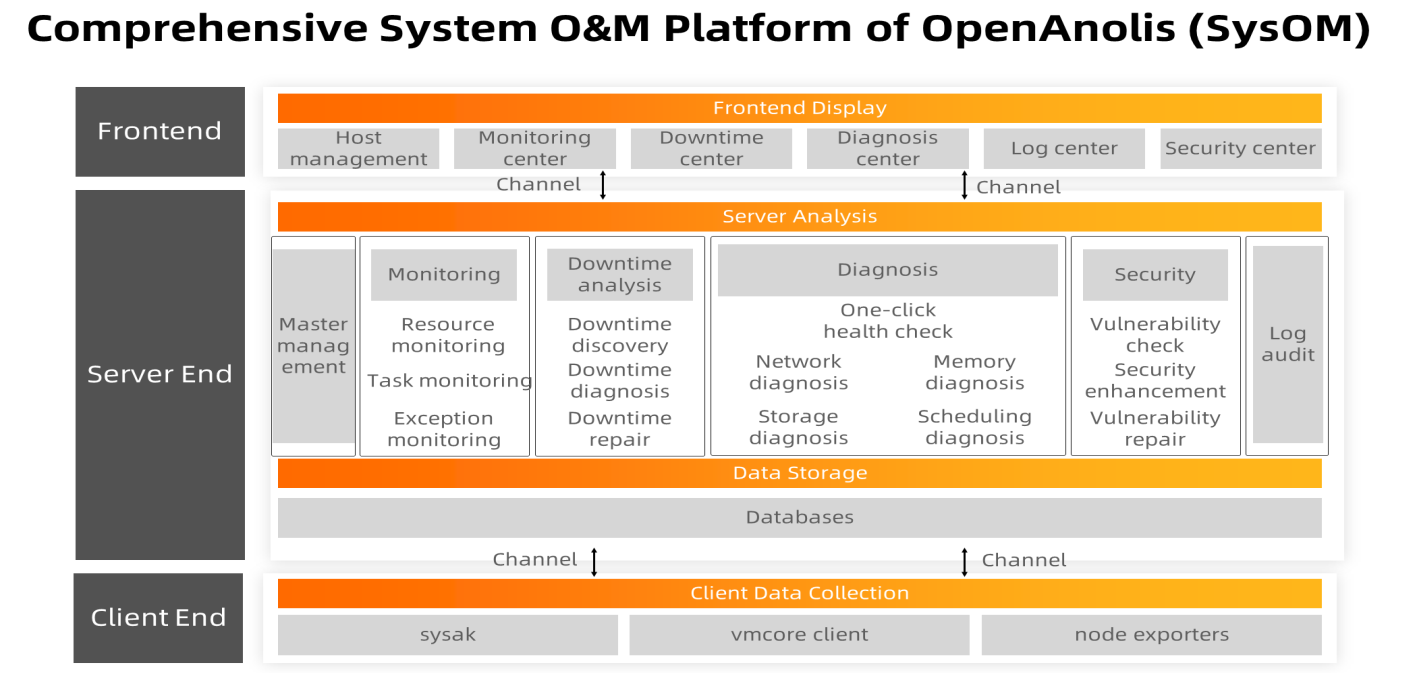
The overall architecture of SysOM includes frontend display, server analysis, and data analysis. It uses a unified frontend web page to display the analysis data of all O&M services:

SysOM thematic features include the following six categories:
As the SysOM control interface, it is responsible for adding, deleting, modifying, and checking nodes and the terminal operating system. You can add the machines to be managed into the management interface through simple operations on the web interface, or you can log on to the corresponding machines for shell operations with one click.
The monitoring center displays the situation of the operating system, including (but not limited to) network latency, resource usage, workload, and system tasks. It will provide the Netinfo feature for network jitter monitoring based on specific scenarios (such as games and finance) and offers all-around basic indicator monitoring of the operating system.
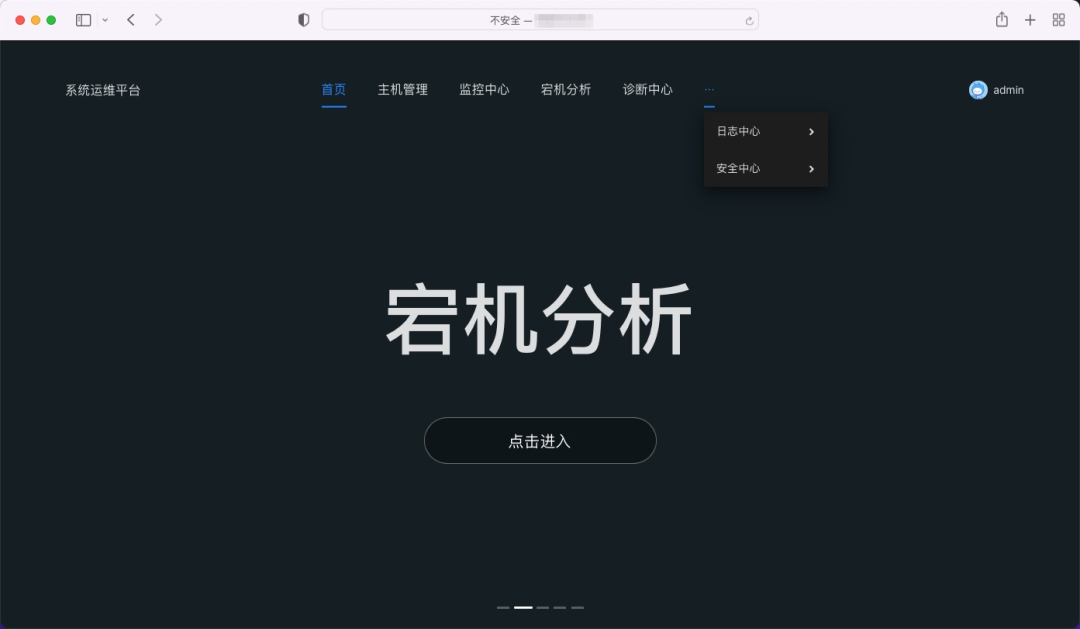
As an extreme exception of an operating system, downtime often has a significant impact on your applications. SysOM Downtime Center will provide unified downtime problem management, including downtime monitoring, existing problem management, online analysis, and solutions. Through multi-dimensional downtime management, the impact of downtime issues on users is reduced, and the stability of user business is improved.
As basic infrastructure, operating systems have difficulty in O&M. SysOM integrates the SysAK capability of OpenAnolis for problems related to the operating system to provide a full range of diagnostic capabilities, including system health check (also known as one-key diagnosis) and in-depth diagnosis of network, memory, storage, and scheduling. All-round diagnosis helps analyze various problems at the operating system level.
The log center boasts the log audit feature to facilitate administrators to monitor and manage the O&M of the clusters they are responsible for.
Security is more and more important. The operating system contains a large number of open-source software packages, creating security vulnerabilities all the time. The most important thing for operating system administrators is to be able to discover the security vulnerabilities in the system in time and be able to repair them quickly. SysOM Security Center provides real-time detection of security vulnerability and white screen repair operations based on the repair progress of the operating system.
Operating system: Anolis OS 8.4 ANCK 64-bit
System specification: 2 cores 8g
Quantity: 3
Network: public network IP
# Select the Server node and run the following command to deploy the monitoring component
# The deployment directory
mkdir -p /usr/local/sysom/server/monitor/
# Download grafana + prometheus + node-exporter
# Download grafana to usr/local/sysom/server/monitor/wget https://dl.grafana.com/oss/release/grafana-8.2.5-1.x86_64.rpm -P /usr/local/sysom/server/monitor/
# Download prometheus to /usr/local/sysom/server/monitor/
wget https://github.com/prometheus/prometheus/releases/download/v2.29.1/prometheus-2.29.1.linux-amd64.tar.gz -P /usr/local/sysom/server/monitor/
# Download node-exporter to the /usr/local/sysom/server/monitor/
wget https://github.com/prometheus/node_exporter/releases/download/v1.2.2/node_exporter-1.2.2.linux-amd64.tar.gz -P /usr/local/sysom/server/monitor/# On the Client node, run the following command to deploy the monitoring component
# If the diagnostic component is not installed, SysOM Diagnosis Center cannot run
# The deployment directory
mkdir -p /usr/local/sysom/server/diagnose
# Download the diagnostic component sysAK.
wget wget https://gitee.com/anolis/sysak/attach_files/1011048/download/sysak-4.19.91-24.8-1.2.1-1.an8.x86_64.rpm -P /usr/local/sysom/server/diagnose/
# Install sysAK
rpm -idv /usr/local/sysom/server/diagnose/sysak-4.19.91-24.8-1.2.1-1.an8.x86_64.rpm –nodeps# Download SysOM
wget https://gitee.com/anolis/sysom/attach_files/1010533/download/sysomRelease-20220329115704.tar.gz -P /usr/local/sysom/
cd /usr/local/sysom/tar -zxvf sysomRelease-20220329115704.tar.gzcd sysomRelease-20220329115704# Install Sysom. Select one of the previously prepared machines as the SysOM server. If there is only a public IP address, you only need to fill in the same format. Note that offline installation is not supported currently.
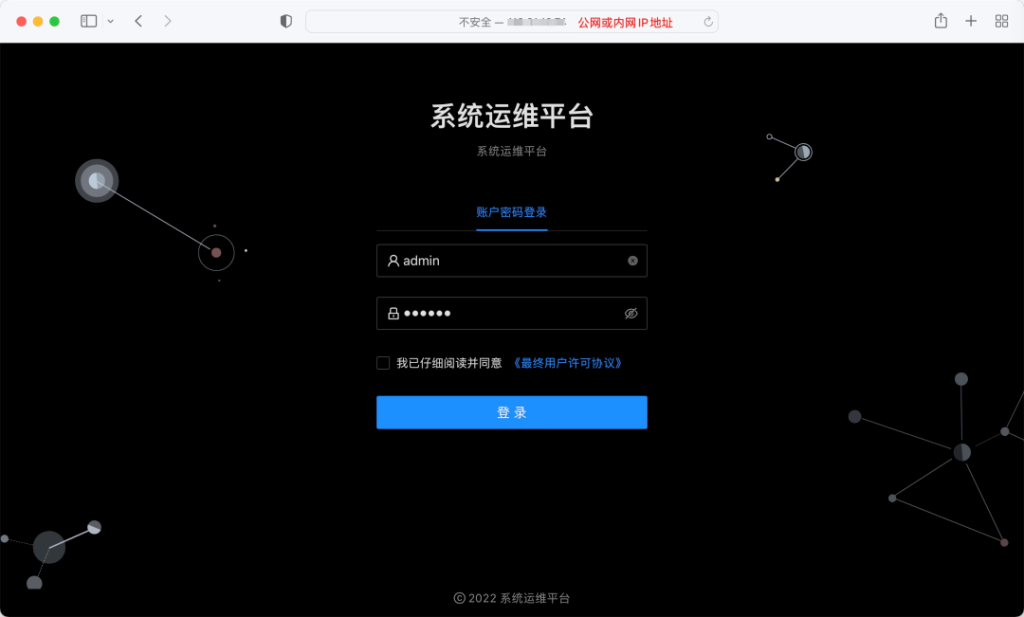
./deploy.sh /usr/local/sysom internal IP public IPAfter the deployment is completed, you can access the deployed SysOM platform through the browser. Enter the public network IP directly in the browser. If only the internal network IP is available, you can use it.


This article is the first article in the SysOM series. Please see the subsequent articles for more information about SysOM features.
SysOM is developed by the operating system O&M SIG members of OpenAnolis based on the real business scenarios. The O&M platform integrates capabilities for monitoring, alerting, diagnosis, repair, and security. SysOM has been made open-source to OpenAnolis. Please refer to SysOM SIG of OpenAnolis for details.
SysOM SIG of OpenAnolis:
https://openanolis.cn/sig/sysom
OpenAnolis Launches "Hierarchical Classification" to Develop Open-Source Industry Innovation Ecology
When Java Meets Confidential Computing, Another Fantastic Journey Begins!

105 posts | 6 followers
FollowOpenAnolis - May 8, 2023
OpenAnolis - January 21, 2025
OpenAnolis - April 7, 2023
OpenAnolis - February 13, 2023
Alibaba Cloud Community - September 23, 2022
OpenAnolis - March 25, 2026

105 posts | 6 followers
Follow Bastionhost
A unified, efficient, and secure platform that provides cloud-based O&M, access control, and operation audit.
Learn More Managed Service for Grafana
Managed Service for Grafana displays a large amount of data in real time to provide an overview of business and O&M monitoring.
Learn More Managed Service for Prometheus
Multi-source metrics are aggregated to monitor the status of your business and services in real time.
Learn More Microservices Engine (MSE)
MSE provides a fully managed registration and configuration center, and gateway and microservices governance capabilities.
Learn MoreMore Posts by OpenAnolis