The alert fires. The frontend P95 latency spikes to 1,800 ms. You trace the call chain downstream—Redis connections are fluctuating, ApsaraDB RDS (RDS) active sessions are climbing—and the clues gradually converge on the database layer. At this point, opening more monitoring dashboards won't help; what you need is something that can run deep diagnostics against the database itself.
The problem isn't a lack of monitoring data—Simple Log Service (SLS), Application Real-Time Monitoring Service (ARMS), Grafana dashboards—it's all there. What's truly missing is something that can stitch cross-layer data into a causal chain. STAROps excels at full-stack correlation analysis, narrowing the troubleshooting scope from many components down to a few suspects. But once the evidence points to the database layer, you need a database diagnostic partner that can drill down on real metrics. Alibaba Cloud ApsaraDB Agent (product ID: alibabacloud-yaochi-agent) fills exactly that role. In this post, we first explain why cross-layer root cause analysis is hard, then walk through three real-world cases—one RDS and two Redis—escalating from single-instance diagnostics (L3) to cross-layer root cause analysis (L4).
STAROps integrates metrics, logs, and traces across applications, middleware, and infrastructure for full-stack correlation analysis. That's its strong suit. But once the scope narrows to the database layer, the nature of the problem changes. "Redis anomaly" isn't enough—you need to know whether a Lua script blocked the single thread or a hot key maxed out the CPU. "RDS session spike" isn't enough either—you need to know which table is missing which index and which SQL query is doing a full table scan. These fall squarely in the specialized domain of database diagnostics, beyond what a general observability platform covers. ApsaraDB Agent supports RDS, PolarDB, Tair (Redis-compatible), MongoDB, Lindorm, AnalyticDB, ClickHouse, and SelectDB, enabling instance-level diagnostics and root cause analysis based on real metrics. Mount it as a skill on a STAROps digital worker, and a single evidence chain can reach from the application layer all the way down to a specific database command.
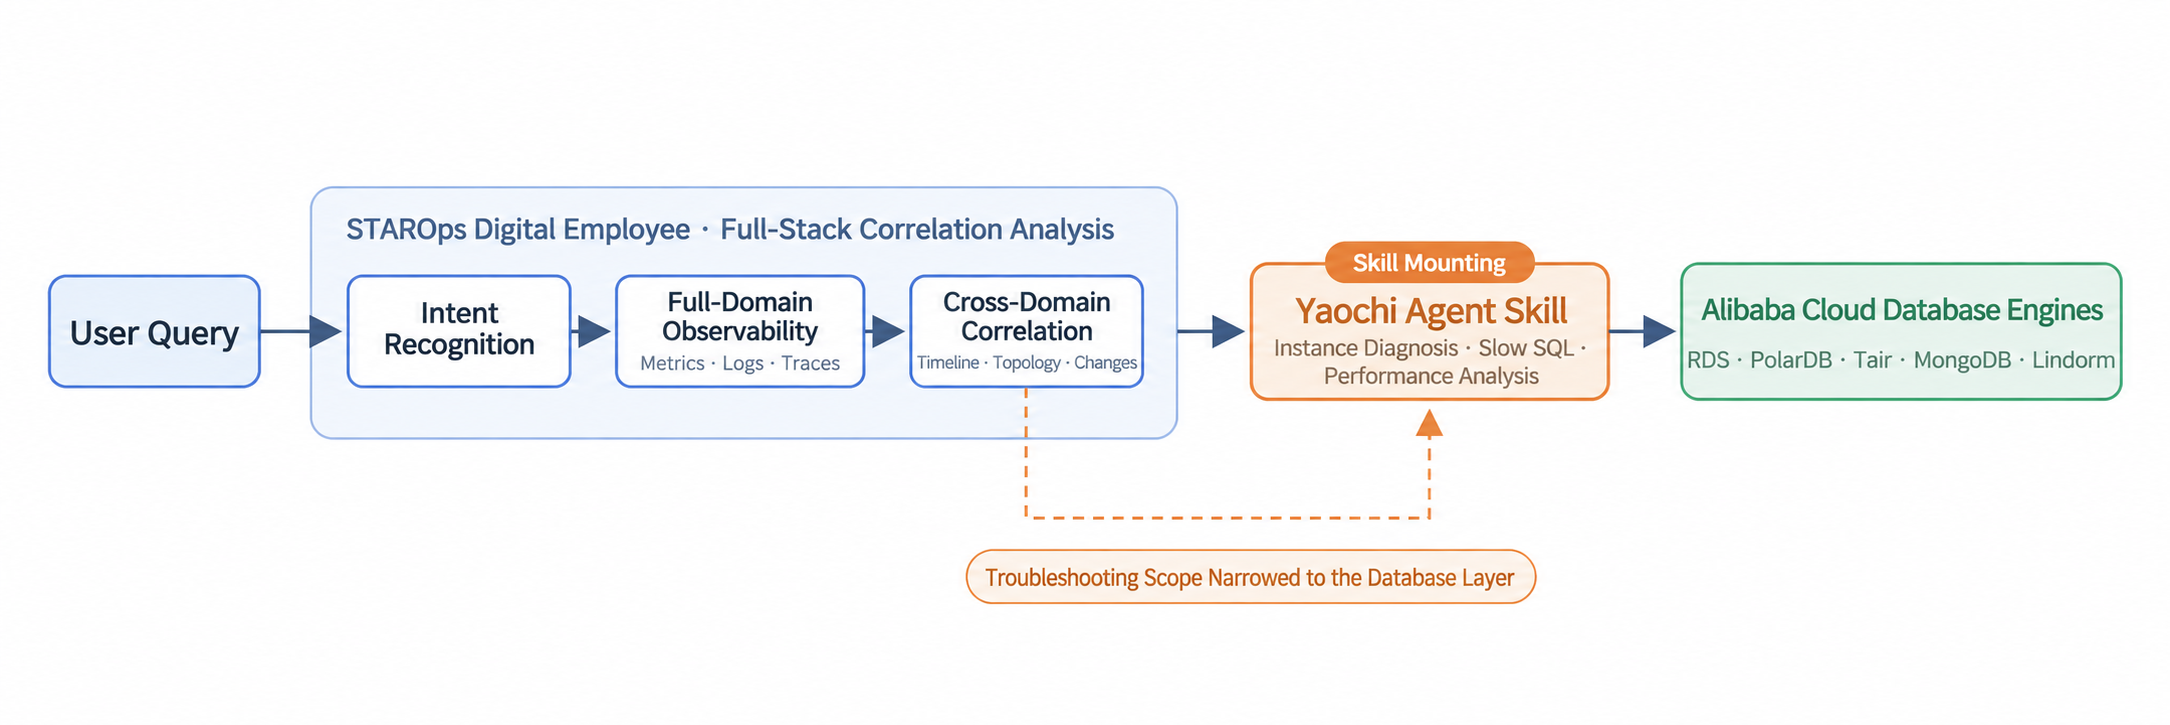
A digital worker is an AI operations assistant in STAROps that can be equipped with skills. Attach ApsaraDB Agent to a digital worker and it gains professional diagnostic capabilities at the database layer. ApsaraDB Agent can do far more than fault diagnosis—beyond instance diagnostics, it also covers everyday scenarios such as instance specification selection, kernel parameter change evaluation, cost analysis, schema modeling analysis, kernel parameter explanation, and backup status queries.
The cross-layer scenarios that follow all involve the same e-commerce application. Below is the frontend service call chain extracted from Cloud Monitor 2.0, which also represents the actual alert propagation path:
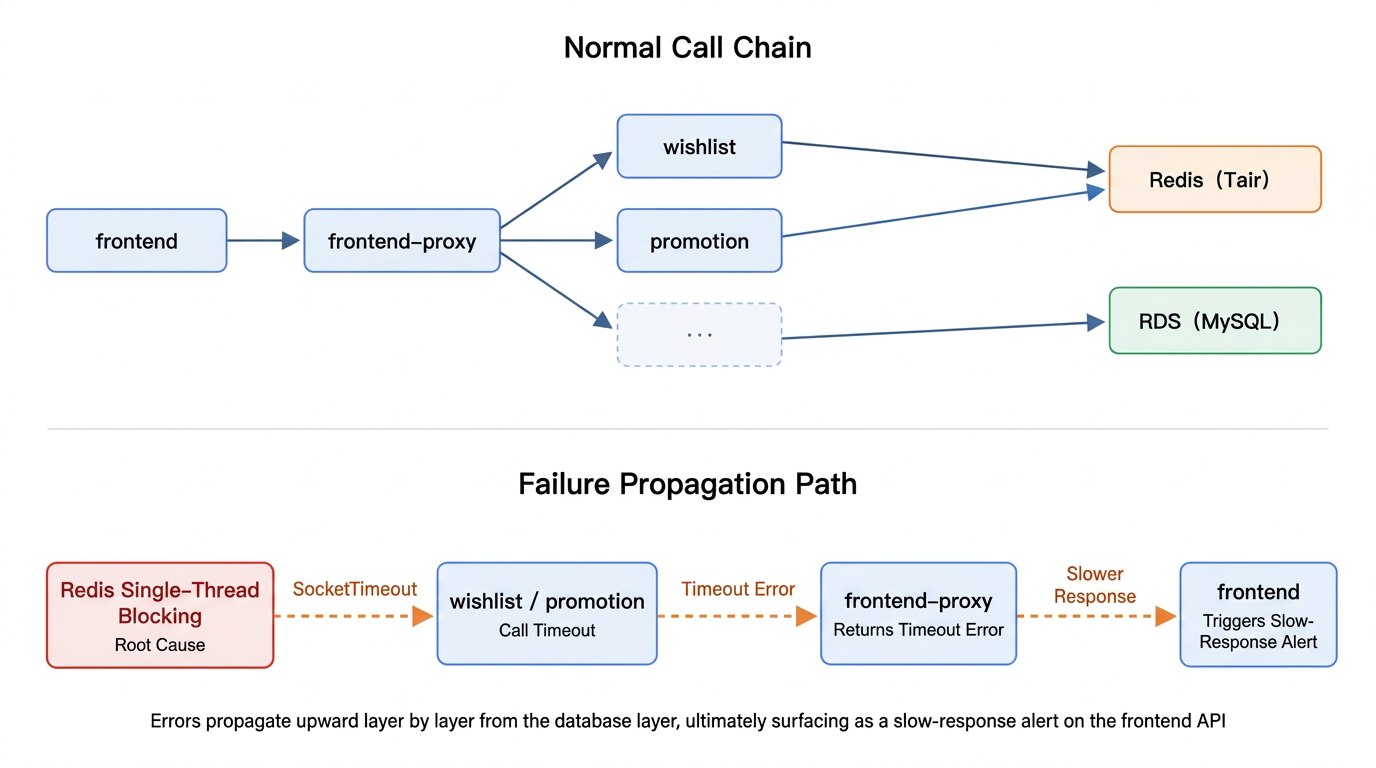
The frontend acts as the entry point for user requests, distributing them via frontend-proxy to business services such as wishlist and promotion. These services in turn call data stores like Redis (Tair, collectively referred to as Redis below) and RDS. When Redis experiences single-thread blocking, the downstream business services are the first to time out. Errors propagate upward layer by layer along the wishlist/promotion → frontend-proxy → frontend path, ultimately surfacing as a slow-response alert on the frontend.
The agent replies shown in the following scenarios are the final diagnostic conclusions. During actual use, the agent first displays analysis progress (querying metrics, analyzing slow commands…). Single-instance diagnostics typically complete within a few minutes, while cross-layer root cause analysis takes roughly 5–10 minutes. If the problem description is incomplete, the agent may ask follow-up questions.
Analyze the cause of the abnormal spike in active sessions for RDS instance rm-j6c3l32c730ti37ur during the period 2026-07-18T12:21:30+08:00 → 2026-07-18T12:38:30+08:00
The digital worker identifies that the issue clearly points to the RDS database layer and invokes ApsaraDB Agent for instance diagnostics.
Within the specified time window, active sessions on the RDS instance rose sharply from a normal level to a peak, lasting about 17 minutes before dropping back. Analysis reveals that during the alert period, a large volume of queries concentrated on the inventory table, all containing correlated subqueries on the product_id column. The client source was IP 10.0.20.210, with 540 concurrent connections executing these queries simultaneously. Because the inventory table lacked an index on
product_id, every query performed a full table scan, leading to a backlog of active sessions under high concurrency. Root cause: theinventorytable is missing theproduct_idindex, and 540 concurrent high-cost correlated subqueries overwhelmed the RDS instance. Recommendation: add an index onproduct_idto theinventorytable.
This is an L3 diagnosis—the alert directly points to a single RDS instance with no cross-layer propagation involved. ApsaraDB Agent's diagnostic path: confirm metric anomaly → analyze SQL distribution → trace the client source (IP 10.0.20.210, 540 concurrent connections) → locate the missing index (inventory.product_id). From "elevated active sessions" to "which table is missing which index," the diagnostic precision is enough to directly guide remediation. You can apply the index change right from the RDS console.
A slow frontend interface response alert occurred from 2026-08-10 10:31 to 10:50. Help me diagnose the root cause of the issue and provide a solution
The digital worker first kicks off STAROps full-stack correlation analysis, gradually narrowing the troubleshooting scope from the frontend layer to the Redis layer through timeline comparison, topology tracing, and change-record cross-referencing. It then invokes ApsaraDB Agent for in-depth diagnostics at the Redis layer.
The in-depth Redis diagnostics reveal the following key metrics: CPU maxed out at 98 % yet throughput dropped (QPS fell from 1,200 to 180), indicating that an operation was blocking Redis's processing thread. Slow-command log analysis pinpointed the source: a Lua script with heavy computational logic monopolized the Redis single thread, and it fired twice during the alert window. Cascading propagation path: Redis single thread frozen → promotion and wishlist services hit SocketTimeout → frontend-proxy returns timeout errors → frontend response slows down. Root cause: the single thread of the managed Redis instance was monopolized by a Lua slow command with heavy computational logic, firing twice. Recommendation: refactor the Lua script to avoid heavy computation in the script body; consider splitting into pipeline batches.
This is an L4 diagnosis—the alert fires at the frontend layer, but the root cause lies in the Redis layer, involving cross-layer propagation. The diagnostic path: frontend alert → STAROps full-stack correlation analysis → scope narrowed to Redis → ApsaraDB Agent Redis metric analysis → slow-command log pinpoints Lua script blockage → cascading propagation confirmed (Redis → microservices → frontend). The diagnostic precision goes down to the command type and behavioral characteristics, rather than merely answering "Redis has a performance issue."
Analyze the cause of the frontend response time spike alert during the period from 2026-08-10 06:19 to 06:25
Following the same troubleshooting path as Scenario 2: STAROps full-stack correlation analysis narrows the scope to the Redis layer, and ApsaraDB Agent takes over for in-depth Redis diagnostics.
Redis instance metrics show near-CPU saturation and a sudden QPS drop, a pattern similar to Scenario 2. Slow-command log analysis pinpointed the blockage source: EVAL commands. These commands contain extensive inline logic, executing complex calculations directly within Redis. The single thread is fully occupied during execution, forcing all other commands to queue. Root cause: the Redis single thread is monopolized by slow EVAL commands, causing all commands to queue. Recommendation: locate and block the client source issuing the abnormal EVAL calls, and optimize the script logic to avoid large-scale loops.
This is also an L4 cross-layer root cause analysis (RCA), with the same "alert in frontend, root cause in Redis" propagation chain and nearly identical metric behavior. Yet the underlying details differ: Scenario 2 involves heavy computation in the business's resident Lua script—fix it by refactoring the script. Scenario 3 involves a temporary inline EVAL script from an anomalous source (EVAL is Redis's command for executing inline Lua scripts)—fix it by blocking the anomalous source and moving the computation out of Redis. Same symptoms, different remediation paths.
Looking at Scenario 2 and Scenario 3 together:
| Scenario 2 (10:31 Alert) | Scenario 3 (06:19 Alert) | |
|---|---|---|
| Symptom | Slow frontend response | Frontend response time spike |
| Propagation chain | Redis → wishlist/promotion → frontend-proxy → frontend | Same as left |
| Metric behavior | CPU 98%, QPS 1200→180 | CPU saturated, sudden QPS drop |
| Root cause | Heavy computation in resident business Lua script, monopolizing single thread (occurred twice) | Temporary inline EVAL script monopolizing single thread |
| Remediation direction | Refactor Lua script | Block anomalous source, move computational logic out of Redis |
Same symptom, same middleware, and the root cause mechanism in both cases is "slow commands monopolizing the single thread"—yet the specific causes and remediation actions differ. This is precisely the value of command-level diagnostic precision: it pins the conclusion down to "which command, where it came from, and how to handle it," rather than merely answering "Redis has a performance issue."
ApsaraDB Agent currently supports the following Alibaba Cloud database products: RDS, PolarDB, Tair (Redis-compatible), MongoDB, Lindorm, AnalyticDB, ClickHouse, and SelectDB. Self-managed databases and non-Alibaba Cloud databases are not supported.
When the evidence is insufficient for a definitive conclusion, the agent marks the confidence level and lists potential troubleshooting directions rather than forcing a root cause. Before executing any fix, it is best to have a DBA or engineering lead review the diagnostic conclusions.
alibabacloud-yaochi-agent under "Skills → Features" and associate it with the employee.You can use the following template to construct your prompt, replacing the content in the brackets:
Analyze the cause of [Anomaly Description] for [Instance Type: RDS/Redis/Tair/MongoDB/PolarDB] instance [Instance ID] during the period from [Start Time] to [End Time]For example: "Analyze the cause of the abnormal spike in CPU utilization for the Redis instance r-xxxxx during the period from 2026-08-10 10:00 to 11:00." Describe the problem you encountered and the time it occurred using natural language. If you are unsure of the specific instance ID, you can describe the application name and the anomalous symptoms, and the Agent will attempt to correlate it with the underlying database instance.
ApsaraDB Agent raises database-layer diagnostic precision from "some middleware has a problem" to "which specific command or index caused the issue." STAROps, in turn, stitches cross-layer evidence into a complete causal chain. Together, SREs and DBAs can use the same toolset for end-to-end troubleshooting—from alert to fix. For complex faults involving cross-layer propagation, this combination is worth a try.
STAROps currently offers new users 10,000 credits for the first month plus a recurring free tier of 2,500 credits every month. Give STAROps a spin—feed it your most recent production incident and see whether it can actually help: pinpointing the exact command, tracing where it came from, and telling you how to fix it.
Try it now: https://starops.console.aliyun.com/
Model Studio Gateway in Practice: Using RocketMQ LiteTopic to Cut the Throttling Ratio by 10×

777 posts | 60 followers
FollowAlibaba Cloud Native Community - August 5, 2026
Alibaba Cloud Native Community - September 2, 2026
Alibaba Cloud Native Community - August 26, 2026
Alibaba Cloud Native Community - September 16, 2026
Alibaba Cloud Native Community - August 14, 2026
ApsaraDB - September 2, 2026
777 posts | 60 followers
Follow Application Real-Time Monitoring Service
Build business monitoring capabilities with real time response based on frontend monitoring, application monitoring, and custom business monitoring capabilities
Learn More ADAM(Advanced Database & Application Migration)
An easy transformation for heterogeneous database.
Learn More Managed Service for Prometheus
Multi-source metrics are aggregated to monitor the status of your business and services in real time.
Learn More Real-Time Livestreaming Solutions
Stream sports and events on the Internet smoothly to worldwide audiences concurrently
Learn MoreMore Posts by Alibaba Cloud Native Community

