Once a company is on the cloud, the bill is usually visible enough. What's missing is being able to read it, chase it down, and act on it in time.
Most teams run into the same set of problems:
FinOps is not about making the bill look better. It is about making cost changes visible in time, explaining them clearly, and routing them back to the right team.
That also means cost governance cannot stop at bill analysis. Even after you pinpoint the product, billing item, and resource behind a cost increase, you have not yet found the optimization opportunity. You still need to look at CPU, memory, disk, connection, bandwidth, and traffic utilization to judge whether resource configuration matches actual load — and then turn that into actionable recommendations under constraints such as business purpose, capacity requirements, and service level agreement (SLA).
STAROps makes this process easy to start and sustain. Users simply ask a question, and the system handles data checks, definition validation, controlled queries, cost drill-down, resource utilization analysis, and optimization recommendations. If the data is not ready yet, it guides users through syncing the bill first, then picks up the analysis where it left off.
Put these problems into daily work and the picture is familiar.
At month-end the bill gets exported, finance spots a cost spike, the platform team helps break out the details, and engineering confirms whether a business change is behind it. Along the way, everyone keeps re-aligning time windows, product definitions, tag conventions, resource ownership, and cost baselines.
What STAROps adds is the full chain after "seeing the number": align cost and usage definitions, identify abnormal changes, and drill down to specific billing items and resources. Then bring in resource utilization to judge whether configuration matches load, and finally name what to check first, which direction to optimize, and what still needs confirmation. The results can also feed a recurring inspection that keeps tracking cost, usage, utilization, and optimization progress. In STAROps, a cost analysis looks more like this:
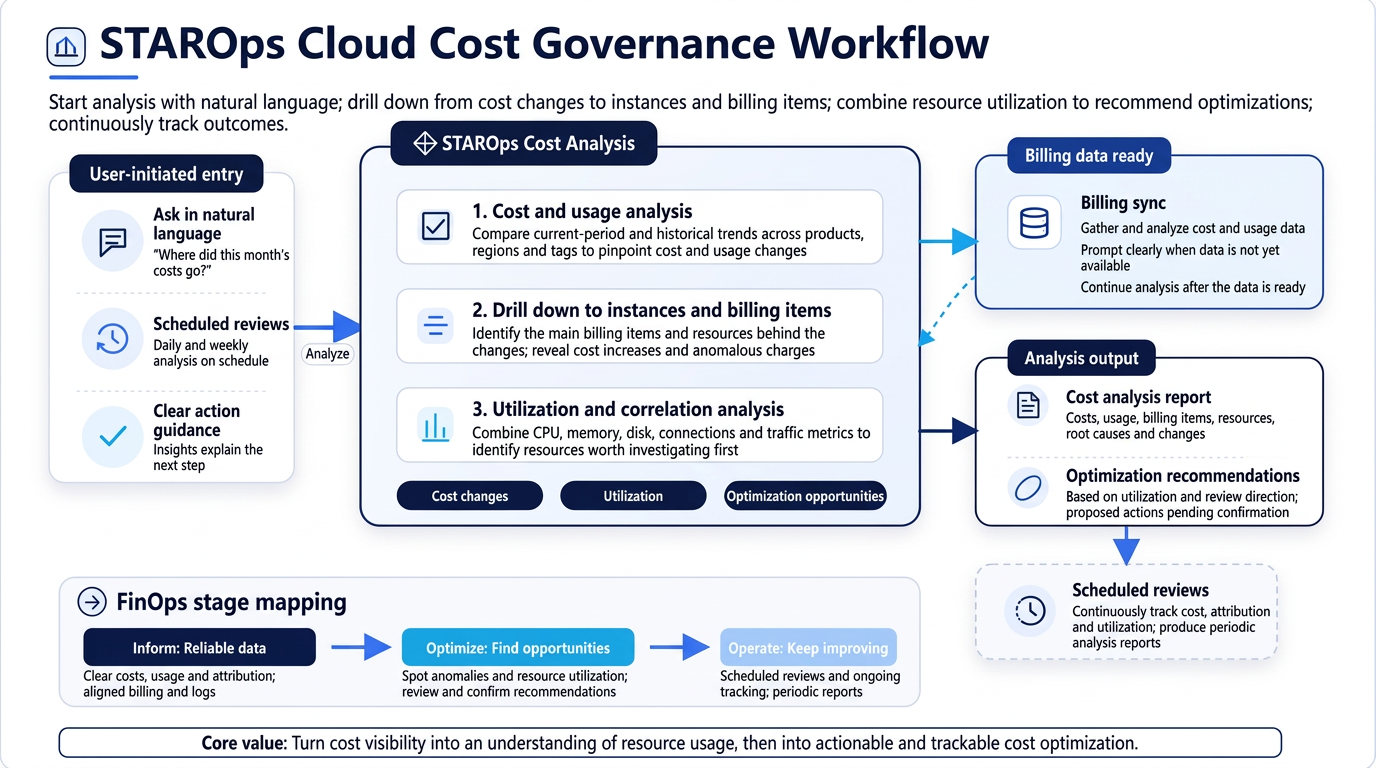
From cost changes to resource utilization and optimization recommendations, STAROps extends a single analysis into a cost-governance action you can keep tracking.
Users still ask in natural language, for example:
What the system really has to answer goes beyond "how much." The bigger questions are: who is using these resources, why cost changed, whether resource configuration matches actual load, which items deserve a closer look, and what optimization direction to take next.
This chain runs the whole way from cost visibility to continuous governance, and it maps onto the three core FinOps phases.
Mapped to the FinOps Foundation's three phases — inform, optimize, operate —, STAROps covers the full journey from data reliability and cost visibility to anomaly detection, optimization recommendations, and recurring governance.
| FinOps phase | What the enterprise needs to solve | STAROps cost governance capabilities |
|---|---|---|
| Inform: see clearly | Are cost, usage, ownership, and billing cycle definitions timely and accurate? | Data ingestion checks, natural language queries, cost attribution, cost-allocation inspection, multi-dimensional reports |
| Optimize: find opportunities | Which anomalies, waste, and structural changes are worth acting on? | Anomaly filtering, Top N ranking, usage/cost breakdown, resource drill-down, optimization recommendations |
| Operate: keep it running | How to turn cost governance into a continuous mechanism | Scheduled inspections, parallel tasks, billing data preparation, task recovery, report archiving |
These three phases are not a one-time exercise. The cause of today's cost increase can become tomorrow's inspection focus; a cost-allocation gap found this time feeds into the next governance cycle. Each phase reinforces the others in a loop — which is exactly what the FinOps Foundation means by a continuous process.
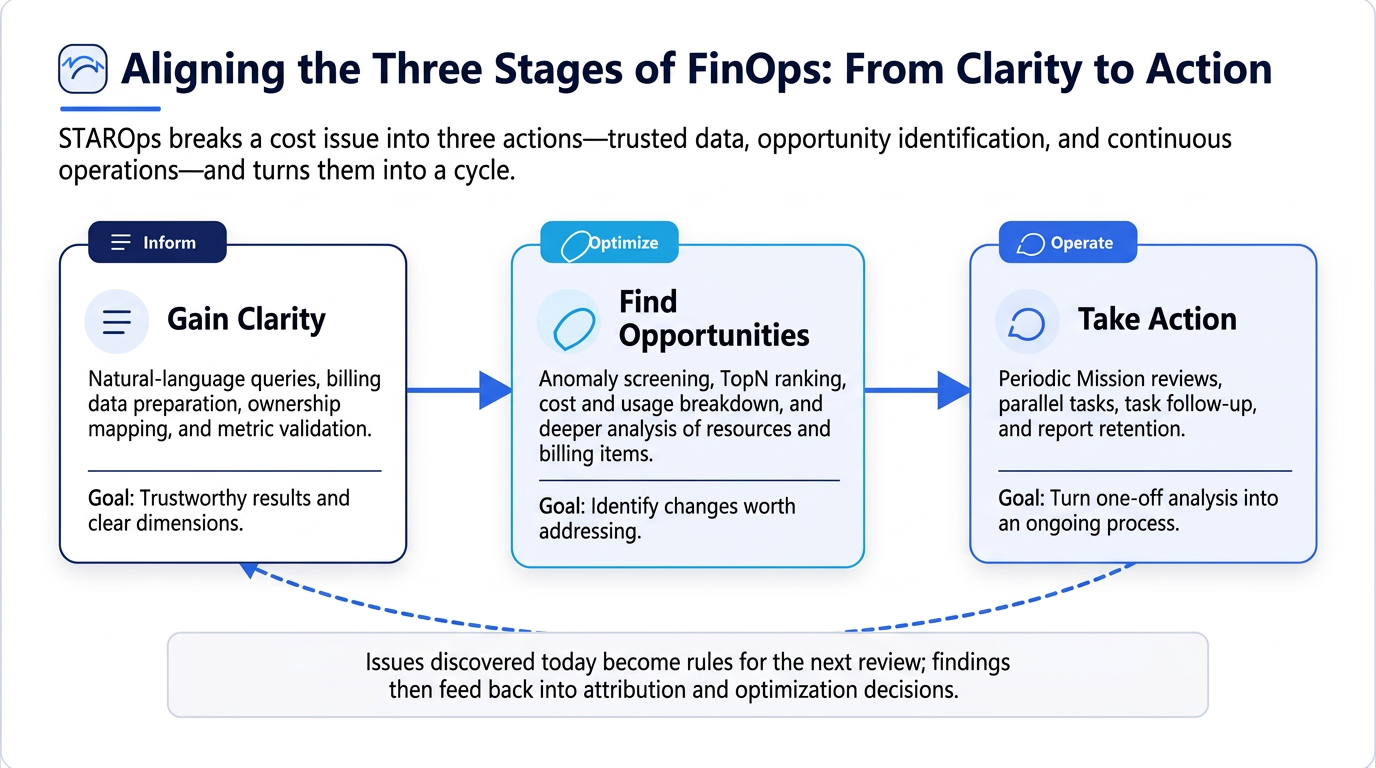
The first step in FinOps is cost visibility. But "visible" does not mean staring at a single summary table. What actually matters is knowing what data that table covers, how the numbers are calculated, and whether you can break them out by business dimension.
For an enterprise, the more important question is whether these points can be verified:
In the STAROps cost-analysis pipeline, a natural-language question does not turn straight into an ad-hoc SQL query. The system first generates a structured analysis plan — specifying the time window, comparison baseline, metric definitions, aggregation dimensions, filter conditions, sorting rules, and Top N scope — and only then produces a controlled SQL query or request.
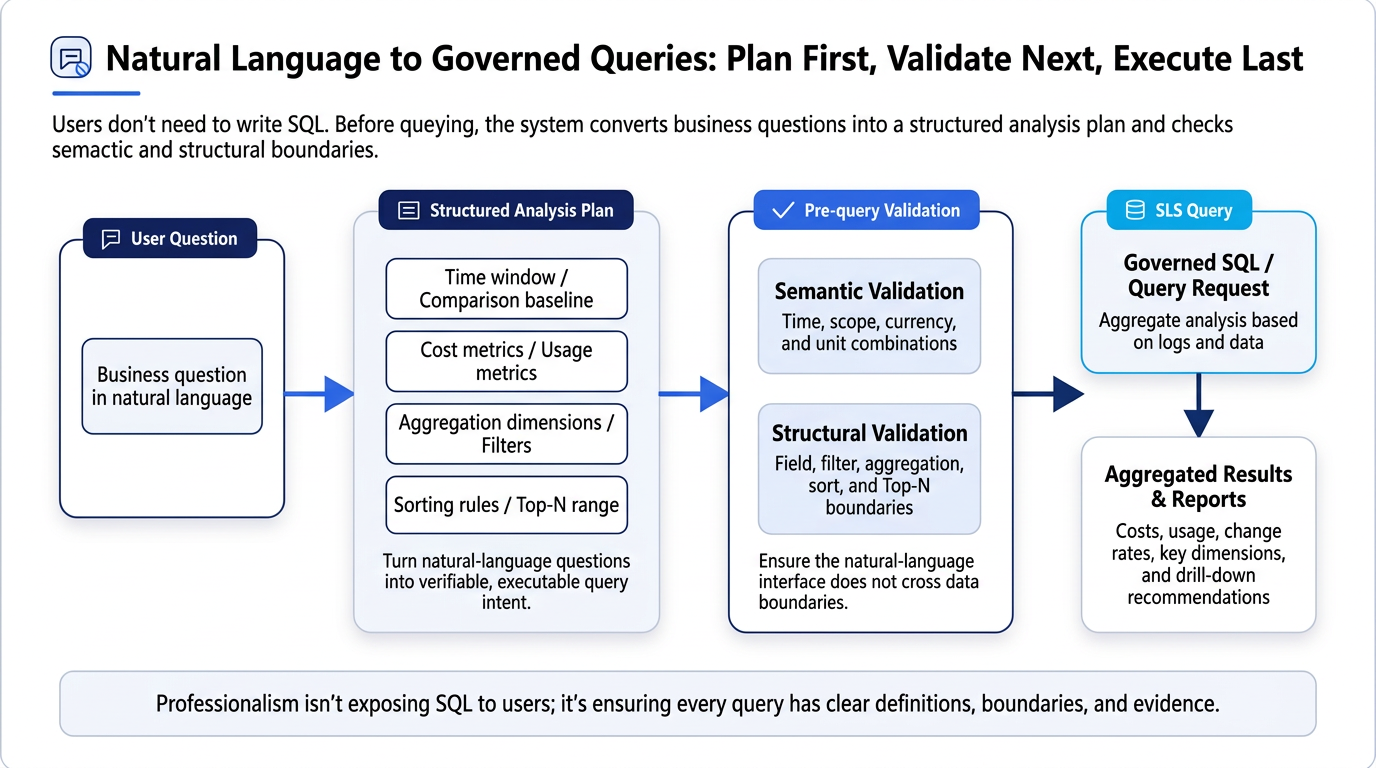
To keep results reliable, the system runs two kinds of validation before execution:
| Validation type | Purpose |
|---|---|
| Semantic validation | Checks whether the time window, cost definition, usage units, currency, and dimension combination fit cost analysis semantics |
| Structural validation | Checks whether query fields, filter conditions, aggregation methods, sorting, and Top N stay within the controlled scope |
The upside: users never have to understand the underlying billing fields or write SQL themselves, yet the system still enforces guardrails on query fields, aggregation methods, and cost definitions.
User question: Analyze this month's cloud cost by business project and compare cost distribution and changes across projects.
Agent answer (sample data): The e-commerce platform spent ¥100,000 this month, 50% of the total, up ¥20,000 from last month, with the increase coming mainly from Elastic Compute Service (ECS) and ApsaraDB RDS. The data platform spent ¥60,000, or 30%, roughly flat month over month. Internal R&D spent ¥40,000, or 20%, down ¥10,000. Recommendation: have the e-commerce platform team check the newly added compute and database resources first.
FinOps puts a lot of weight on "whoever uses it, owns it." But to make that principle real, cost first has to land on the right dimension.
For cost attribution, STAROps aggregates and filters mainly on fields already in the bill — Tag, ResourceGroup, CostUnit, OwnerID — and lays the cost distribution out for the user:
tag field in the bill to view Top N tags, tags with abnormal increases, and the share of cost carried by values like (no tag) or none.ResourceGroup to see which resource groups most cost falls into, and how much of it sits in the default resource group.CostUnit are supported at the underlying layer, so you can see how cost is distributed across cost units and how much remains unallocated.OwnerID across the primary account and financial sub-accounts to establish cost ownership in multi-account setups.One clarification: without a corporate tagging standard or mapping table, the system will not assert outright that "the cost center is wrong". More precisely, STAROps first aggregates the ownership fields already present in the bill so users can see cost distribution across tag, resource group, cost unit, and account. Whether a given case is a cost allocation gap, a naming inconsistency, or an organizational mapping issue has to be confirmed against the company's own rules.
Looking at this only at month-end leaves you reacting. Put it into a scheduled inspection, and finance spends less time re-confirming numbers at close, while engineering sees the cost impact of new resources and architecture changes much earlier.
User question: Which ECS cost increases in the last 7 days deserve the most attention? Please drill down to specific instances and billing items.
Agent answer (sample data): ECS is up ¥10,000 (+10%) versus the previous 7 days. On instance i-example03, the "system disk" billing item rose from ¥1,000 to ¥5,000, an increase of ¥4,000 and 40% of the abnormal ECS increase. On instance i-example04, the "cloud server configuration" billing item rose ¥3,000, or 30% of the abnormal increase. Recommendation: check resource changes on these two instances and their billing items first.
A cost increase is not necessarily waste. Business activity, traffic growth, and architecture migration can all drive legitimate growth. What FinOps really needs to watch are abnormal changes that lack an explanation, follow-up, or owner.
STAROps compares cost and usage between the current period and a baseline period, analyzing change amount, change ratio, usage trends, deductions and discounts, resource concentration, and the breakdown across tags, regions, products, and billing items to flag the anomalies worth attention. It also uses the baseline amount to filter out "small-amount, big-percentage" noise — a resource jumping from ¥1 to ¥10 is a steep rise, but usually matters less than a core product line going from ¥100,000 to ¥120,000.
Once anomalies are identified, the system selects the objects that matter by amount and contribution, then drills down level by level:
| Drill-down level | Question to answer |
|---|---|
| Total bill level | Has overall cost deviated from the historical baseline? |
| Product level | Which cloud products drove most of the change? |
| Billing item level | Does the change come from storage, traffic, requests, compute, processing, or deductions? |
| Resource level | Which resources or instances contributed most of the increase? |
| Cause level | Is the cause usage growth, a unit price change, reduced deductions, or new resources? |
STAROps retains the cost change, anomaly contribution, and relative share at every level, so dozens of pages of line items converge into a handful of actionable checks. When SLS cost rises, for example, the analysis breaks it down further into billing items — storage, index traffic, read/write traffic, and data transformation — and cross-references them with specific projects, LogStores, resources, and tags to determine whether the main driver is usage growth or a shift in cost structure. Cost data becomes truly actionable only once you can pin it down to a specific billing item, resource, and cause.
User question: Analyze ECS cost for the last 7 days and find the low-utilization instances worth checking first.
Agent answer (sample data): Instance i-example01 cost ¥1,000 over 7 days, with CPU averaging 10% and peaking at 20% and memory averaging 10% and peaking at 20% — a low-utilization instance to check first. Instance i-example02 averages 40% CPU with an 80% peak and 60% memory on average, so it is not a low-utilization candidate for now. Optimization advice: first confirm i-example01's business purpose, peak cycle, SLA, and capacity requirements. If the low load is confirmed to be long-term, evaluate downsizing the instance. If it belongs to a test or staging environment that does not run continuously, evaluate scheduled start/stop as well. Before implementing, confirm data protection, dependencies, and the change window.
STAROps analyzes cost change, resource utilization, and business constraints together, taking users from "a cost anomaly was found" to "here is what to check and how to optimize".
The analysis covers:
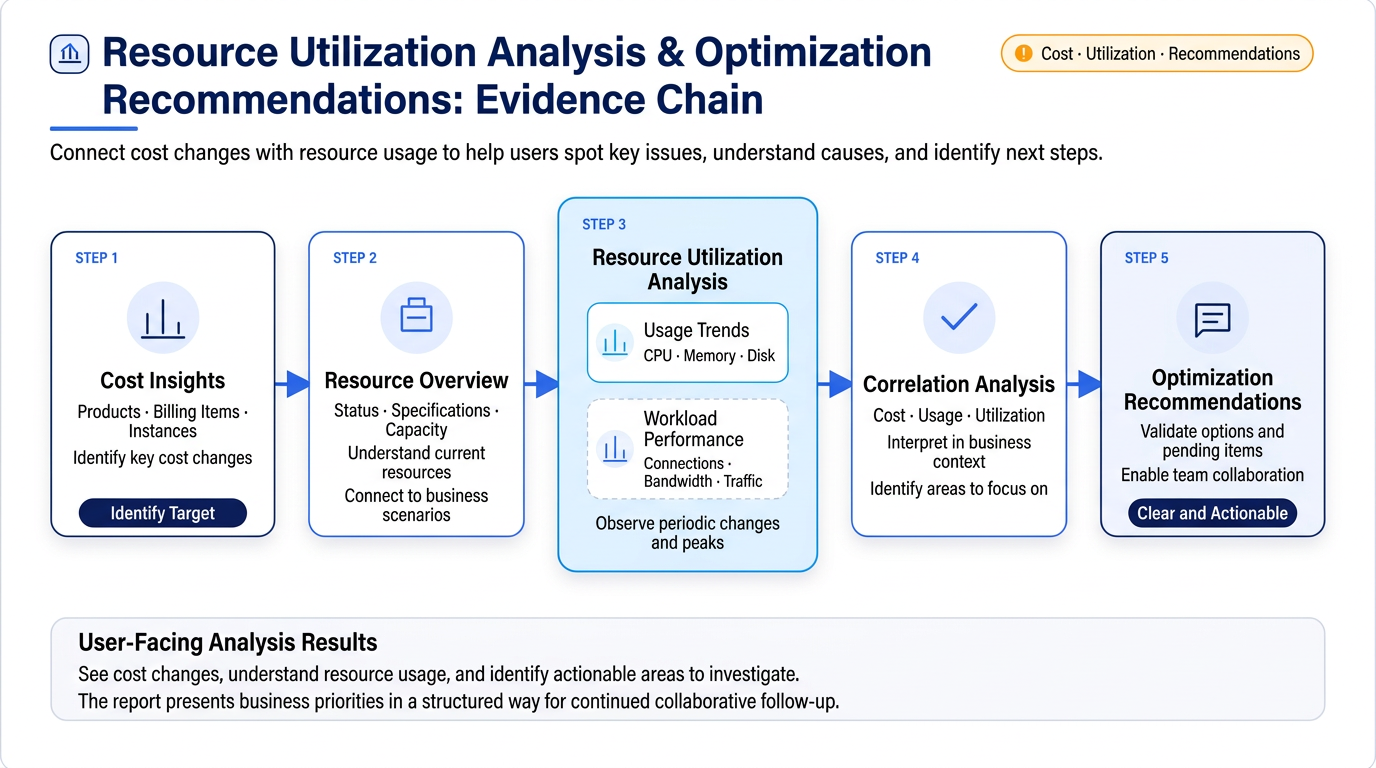
Users can read the results from several angles:
The results explain cost changes, resource utilization, which items to watch, and what still needs business confirmation.
If no Intelligent Utilization Analysis results are available, the report states the information gap explicitly and explains how to enable Intelligent Utilization Analysis.
If additional authorization is required, the report gives clear instructions so the user can complete the analysis.
User question: Every day at 9:00 AM, check the previous day's cost anomalies, cost allocation risks, and usage changes, and generate a report.
Agent answer (sample data): Today's inspection is complete: yesterday's total cost was ¥30,000, +10% versus the previous day; 2 key items were found — system disk cost +20%, and cost without an environment tag +10%. The report lists the main contributing resources and the owners to be confirmed. The next inspection will run tomorrow at 9:00 AM.
FinOps cannot rely on a month-end review. Effective cost governance has to keep running day to day.
For recurring cost inspections, STAROps uses its long-running task capability, Mission, to run multiple inspection tracks in parallel:
| Inspection area | What it finds |
|---|---|
| Cost anomalies | Whether total, product, and resource cost fluctuate abnormally |
| Cost allocation risks | Whether tag, project, department, and account ownership is missing or abnormal |
| Deduction changes | Compares changes in deducted usage under resource plans, billed usage, and total usage |
| Structural changes | Identifies new and disappearing products, plus shifts in cost distribution across dimensions such as region and resource group |
These tasks run in parallel and then roll up into a single inspection report. The report retains the analysis billing period, baseline period, current amount, baseline amount, change ratio, thresholds triggered, key dimensions, and suggested drill-down directions.
Mission suits exactly this kind of long-running, staged, resumable work: start with the total bill check, then branch out in parallel across product, resource, cost allocation, and usage; once something significant surfaces, keep drilling down.
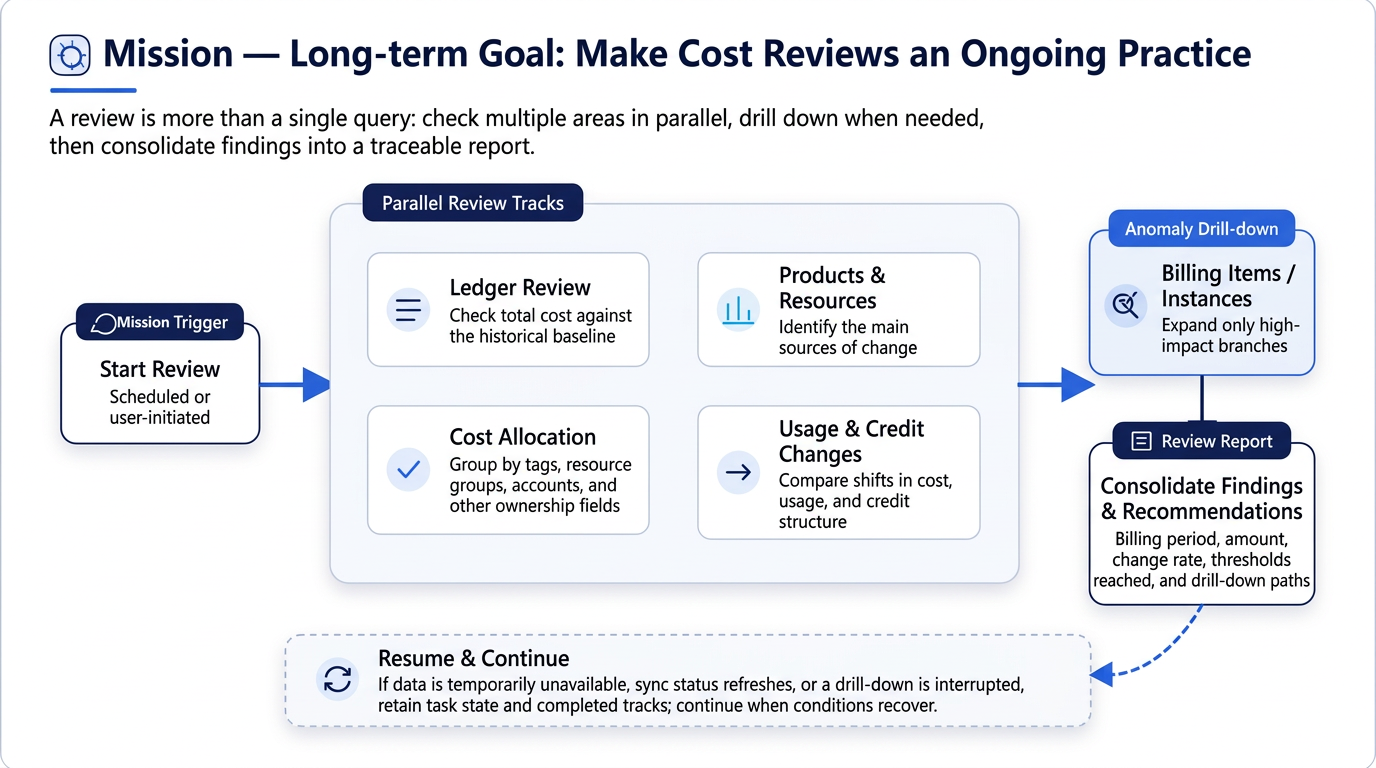
If an inspection hits temporarily unavailable data, a Cost Manager sync refresh, or an interrupted drill-down, STAROps records the task state and the branches already completed, then resumes once conditions allow. For a production environment, that is far closer to a genuinely long-running system than "fail and rerun by hand."
Before any cost analysis can run, the billing data has to be queryable.
When a user starts a cost analysis or inspection, STAROps first confirms that Cost Manager has finished syncing the bill. Cost Manager syncs cloud bills into SLS, and every natural language query, structured SQL query, and recurring inspection afterward runs on that billing data.
If the billing data is not ready, the system prompts the user in the STAROps chat to enable Cost Manager, sync billing data, or update the required fields. Once the data is ready, the original analysis continues and the recurring inspection can be triggered again. What the user gets is not "this isn't available right now" but a path forward.
STAROps is not just another billing report. Think of it as a cost-analysis entry point you can question, drill into, and run continuous inspections from.
| Common user problem | What STAROps changes |
|---|---|
| No idea why cost went up | Drills from the total bill down to products, billing items, resources, and usage changes |
| No appetite for writing SQL or learning complex billing fields | Starts the analysis in natural language; the system generates controlled queries |
| Worried that analysis definitions are inconsistent | Validates the time window, metric definitions, dimensions, and SQL structure |
| Too much detail, key items buried | Surfaces the key items using thresholds, Top N ranking, and drill-down results |
| Cost governance depends on someone remembering to check | Uses Mission to carry recurring inspections and task recovery |
| Billing data not ready yet | Guides you through enabling Cost Manager and syncing the bill in the STAROps chat, then returns to the analysis |
The bottom line: cost questions no longer wait for month-end. You can ask any time, let the system query automatically, and keep inspections running. Cost spikes surface earlier, root causes get explained faster, and governance actions are captured so nothing falls through the cracks.
As enterprise cloud architectures grow increasingly complex, cost governance will shift from after-the-fact analysis to real-time awareness. That is exactly the path STAROps is building — from visible data to explainable anomalies to governance that never stops running.
What Makes Alibaba Cloud’s Newly Released AgentCore Different?

779 posts | 60 followers
FollowMiles Brown - June 8, 2026
Alibaba Cloud Native Community - June 8, 2026
Alibaba Cloud Native Community - August 26, 2026
CloudNative - May 10, 2022
Alibaba Cloud Native Community - August 25, 2026
Alibaba Cloud Native Community - May 26, 2026
779 posts | 60 followers
Follow Financial Services Solutions
Alibaba Cloud equips financial services providers with professional solutions with high scalability and high availability features.
Learn More CloudMonitor
Automate performance monitoring of all your web resources and applications in real-time
Learn More AgentLoop
An Agent self-evolution platform designed to make your Agents progressively smarter and more attuned to users.
Learn More FinTech on Cloud Solution
This solution enables FinTech companies to run workloads on the cloud, bringing greater customer satisfaction with lower latency and higher scalability.
Learn MoreMore Posts by Alibaba Cloud Native Community

