By Wuzhe
With the continuous deepening of digitalization, observability has been a hot topic in recent years. Among the three pillars of observability which are Log, Trace, and Metric, log data is generally the most common. The first step for enterprises towards observability often begins with the collection and migration of log data to the cloud. After logs are collected, the most direct need is to retrieve and analyze valuable information from massive log data. As the volume of log data continues to grow, and the types of data continue to increase and evolve towards unstructured, multi-scenario, and multi-modal directions, traditional log search methods are increasingly insufficient for diverse and personalized analysis needs under different scenarios.
As one of the most fundamental data types in observability scenarios, log data has the following characteristics:
• Immutability: Log data is not modified once generated. It is a faithful record of the original event information and often does not have a fixed structure.
• Data Randomness: For example, anomalous event logs and user behavior logs are random and unpredictable by nature.
• Source Diversity: There are many types of log data, and it is difficult to have a unified schema for data from different sources.
• Business Complexity: Different business participants understand the data differently, making it difficult to anticipate future specific analysis needs when writing logs.
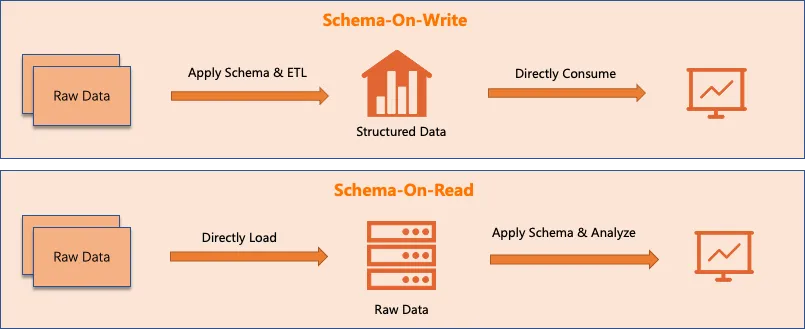
These factors mean that there is often no ideal data model for preprocessing log data during collection. Therefore, it is more common to directly collect and store raw log data, which can be called a Schema-on-Read approach or is known as the Sushi Principle (The Sushi Principle: Raw data is better than cooked, since you can cook it in as many different ways as you like).
Storing data in its raw form means that dynamic and real-time processing of the data is often required during analysis, such as JSON processing, extraction by using a regular expression, and mathematical calculations. Additionally, due to the lack of prior knowledge about data characteristics among different analysts, exploratory analysis of the data is usually necessary.
In other words, during the process of querying and analyzing logs, it is necessary to display the unstructured document structure while also providing rich operators for real-time processing. At the same time, it should ideally support convenient, cascading, and exploratory analysis methods.
Log data analysis can typically be divided into two main scenarios:
One type is query scenarios, also known as search or pure filtering scenarios. In these scenarios, unmatched logs are filtered out according to specific conditions, and for matched logs, their original log texts are output directly.
The other type is analysis scenarios. These scenarios primarily include aggregation analysis, such as sum and sort, and association analysis, such as joining multiple tables. These operations require more complex computations of the data, and the output is generally in tabular mode.
Here we focus on pure query and filtering scenarios. In SLS, you can use traditional search syntax like Key:XXX or use a WHERE statement in standard SQL, such as | select where Key like '%XXX%'. Both methods have their advantages but also come with their respective limitations.
For query syntax, it is naturally suited for filtering search scenarios. However, its expressive ability is limited. It only supports keyword matching and logical combinations of multiple conditions using AND, NOT, and OR, without support for more complex processing logic.
On the other hand, SQL syntax has the advantage of being highly expressive, but it operates on a tabular model, which makes viewing original log results inconvenient because it requires aligning fields, resulting in numerous NULLs for missing columns in the output. Moreover, for statements like SELECT *, it can only output fields with enabled field indexes.
Detailed comparison:
| Challenges in Pure Query Scenarios | Search Query Syntax | Standard SQL Syntax |
|---|---|---|
| Need for complex processing logic | Weak, mainly supports keyword matching | Strong, equipped with rich processing functions and operators such as regular expression match and JSON data extraction |
| Unstructured output content | Strong, outputs the original text, convenient for viewing | Weak, outputs in tabular mode and fills null values for missing columns, inconvenient for viewing |
| Pagination logic | Simple, you can click directly in the console and pass the offset + lines through the API | Complex, you need to use limit x,y in SQL and specify the sorting method |
| View the time distribution of results | Simple, histogram shows the distribution at different times | Complex, you need to group, sum, and sort by time in SQL, and then draw a line graph to view it |
| Output all the original text fields in the result | Outputs the original text, which naturally contains all fields | Complex, SELECT * can only output columns with enabled field indexes |
| Obtain part of the fields | Not supported | Specify the column in the SELECT clause |
| Calculate new columns | Not supported | Calculate new columns in the SELECT clause |
| Multi-level cascade processing capability | Unable to express | Achieves through the WITH statement or nested SQL statements, but it tends to be complex to write |
Since both methods have their strengths, can we combine the advantages of these two approaches to support a new query syntax? Ideally, this new syntax adheres to the document model, which means it can directly output the original log text that is not in tabular mode and does not require all output columns to be indexed. In addition, it supports various useful SQL operators and more convenient cascade processing without the need for complex statement nesting.
SPL, which stands for SLS Processing Language, is a unified data processing syntax provided by SLS for scenarios such as log query, streaming consumption, data processing, Logtail collection, and data ingestion.
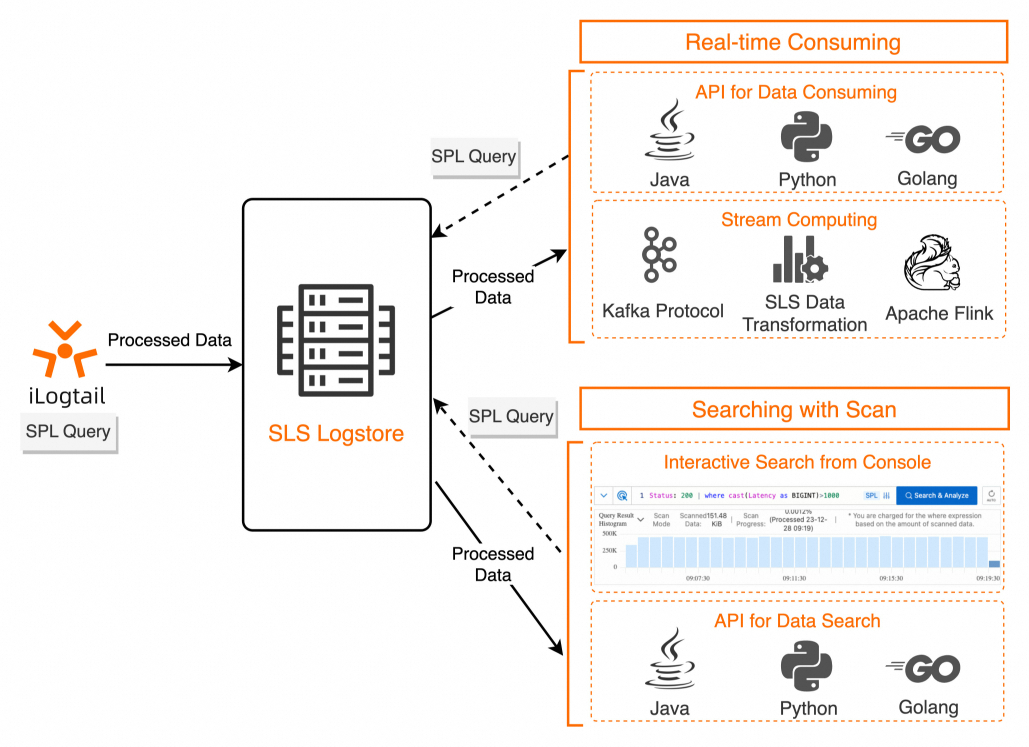
The basic syntax of SPL is as follows:
<data-source> | <spl-expr> ... | <spl-expr> ...Here, represents the data source. For log query scenarios, this refers to the index query statement. represents SPL instructions, which support various operations such as regular expression values, field splitting, field projection, and numerical calculation. For more details, see SPL instructions.
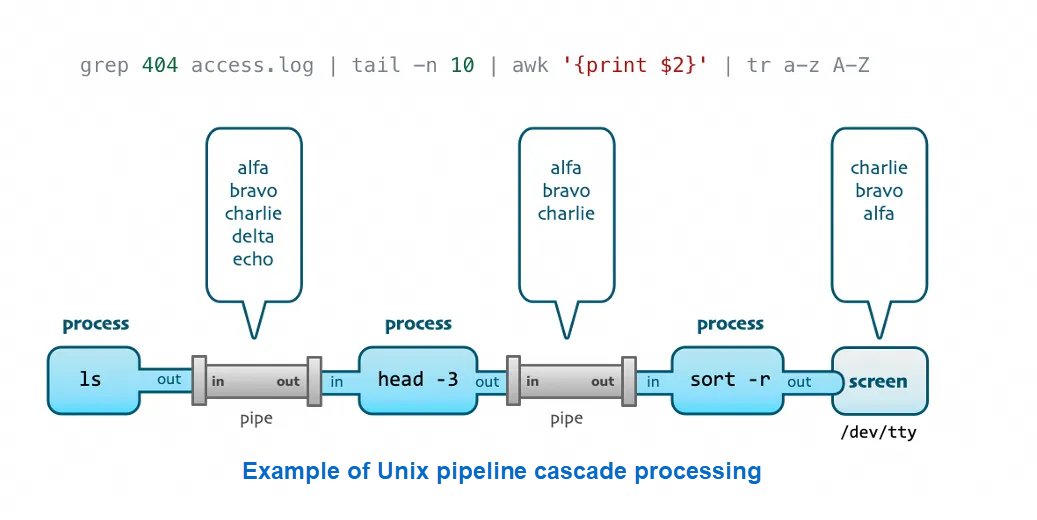
From the syntax definition, it is clear that SPL supports multiple SPL instructions to form a pipeline cascade. For log query scenarios, after the index query statement, SPL instructions can be continuously appended using the pipeline symbol as needed, providing an experience similar to Unix pipeline processing of text data, and allowing for flexible exploratory analysis of logs.
When querying logs, there is usually a specific goal in mind, meaning that only certain fields are of interest. At this point, the project instruction in SPL can be used to retain only the relevant fields. (Alternatively, you can use the project-away instruction to remove fields not needed.)
Through the Extend instruction, new fields can be extracted based on existing fields, with the ability to call rich functions (which are mostly compatible with SQL syntax) for scalar processing.
Status:200 | extend urlParam=split_part(Uri, '/', 3)You can also calculate new fields based on multiple fields, such as calculating the difference between two numeric fields. (Note: The field is considered as varchar by default, and the type must be converted through cast when calculating the number type.)
Status:200 | extend timeRange = cast(BeginTime as bigint) - cast(EndTime as bigint)You can also determine and filter this calculated value through the WHERE clause in the subsequent pipelines:
Status:200
| where UserAgent like '%Chrome%'
| extend timeRange = cast(BeginTime as bigint) - cast(EndTime as bigint)
| where timeRange > 86400SPL provides commands such as parse-json and parse-csv, which can fully expand JSON and CSV fields into separate fields, enabling direct operations on these fields. This method eliminates the overhead of writing the field extraction function, which is more convenient in interactive query scenarios.
SPL is available in scan-based queries in all regions. For more details, see Scan-based query. Scan-based queries can compute directly from the raw log data without relying on indexes. The example shown below demonstrates how SPL pipelines can perform multiple operations including fuzzy filtering, JSON expansion, and field extraction on raw log data.
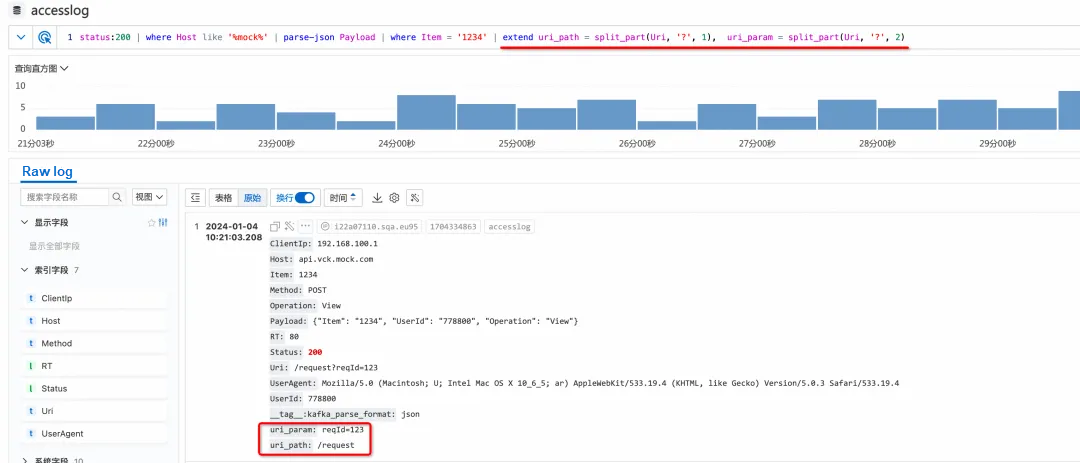
The scan mode offers great flexibility, but the biggest issue is its insufficient performance, especially when dealing with large-scale data, making it difficult to process data within a limited time. Existing scan-based queries are limited to scanning a maximum of 100,000 rows per session, and any additional scans require manual triggering through the console or an SDK-initiated call.
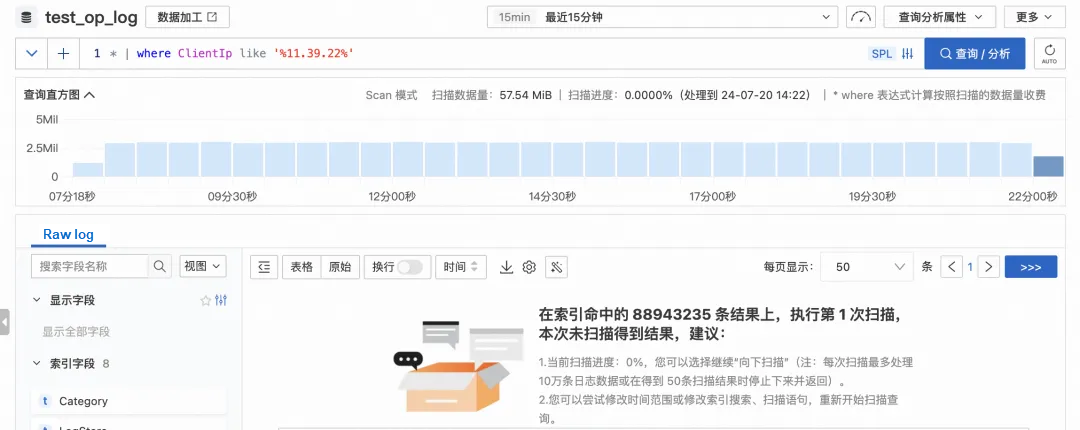
Due to these performance limitations, current SPL queries face the following issues:
• For queries with sparse filtering results, the amount of raw data scanned per session is too small to produce results within a limited time.
• The histogram displayed in the query interface shows the results after index filtering and also the scan progress but does not reflect the final distribution of results after SPL condition filtering.
• As random pagination for the final filtered results is unsupported, you can only scan pages continuously based on the offset of the scanned original text.
These constraints result in a poor user experience for SPL in scan mode when handling large amounts of log data, thus limiting its practical utility.
To fundamentally improve the execution performance of SPL queries and truly leverage the advantages of flexible computing, we have made significant optimizations across the computing architecture, execution engine, and IO efficiency.
First, we need to solve the problem of horizontal scaling at the architectural level. In the previous architecture, because storage nodes lacked the capability to handle complex expressions, all raw data had to be fetched to the compute nodes for processing. Therefore, the reading, transmission, and serialization of large-scale data is a great bottleneck.
In query scenarios, the actual number of final result rows needed per request is typically quite small, usually fewer than 100 rows and additional rows are obtained via pagination. The challenge arises when the SPL statement includes a WHERE condition, requiring the computing of the WHERE condition across a large dataset. To handle large volumes of data and reduce transmission overhead, we need to push down the computing of the WHERE condition to the storage nodes where each shard resides. Consequently, storage nodes must be able to efficiently process the rich set of operators in SPL.
To achieve this, we introduce a C++ vectorized computing engine on the storage nodes. After reading the raw data, the storage nodes can directly perform efficient filtering. Only logs that satisfy the WHERE condition undergo the remaining SPL computations, thereby outputting the final result.
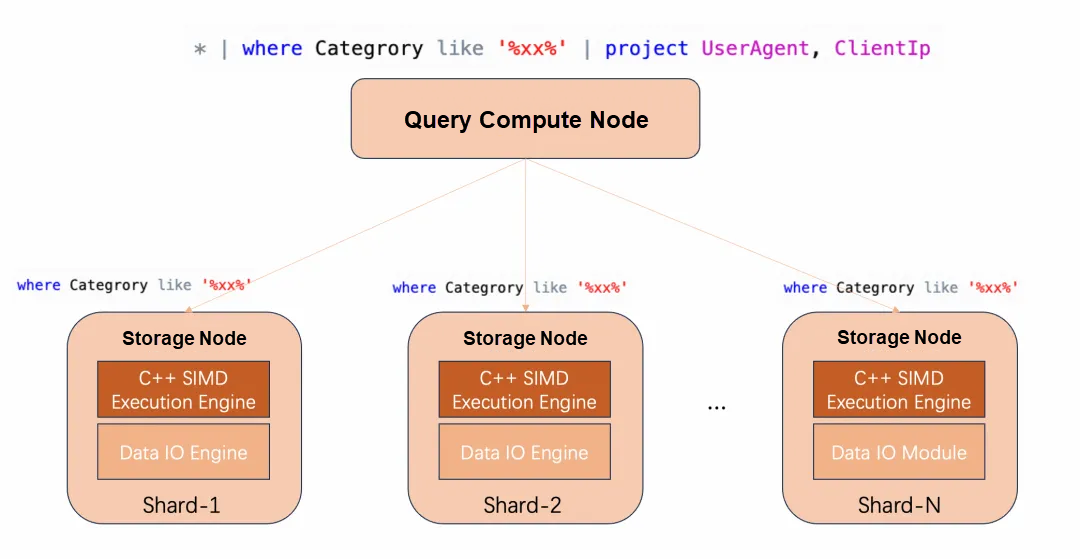
After pushing down the computing, the processing capacity can be scaled horizontally with the number of shards, significantly reducing the overhead of data transmission and network serialization between storage and compute nodes.
Pushing down computing solves the issue of horizontal scaling by shard. Next, we need to significantly enhance the processing capabilities on each shard.
The biggest performance bottleneck of SPL in scan mode lies in directly scanning and reading raw row data. This way of reading will lead to severe read amplification and low IO efficiency. Just as field indexes, along with statistics, need to be enabled for efficient reading and computation when using SQL analysis capabilities, SPL can also leverage field indexes for high-performance data IO, followed by high-performance computing based on SIMD vectorization technology, while minimizing additional computational overhead.
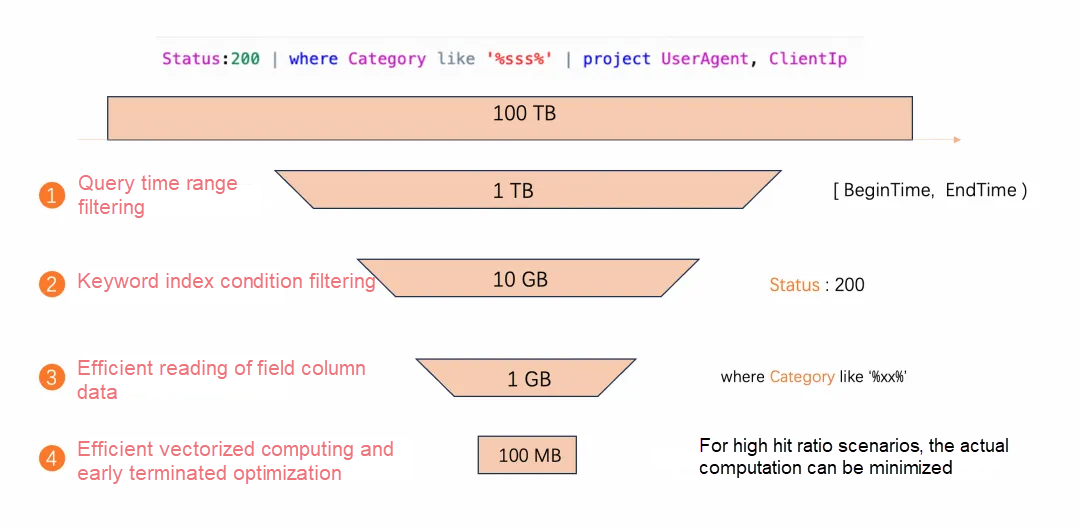
Take the SPL in the figure as an example. After being pushed down to the storage node, it goes through a multi-level acceleration:
• Filter by query time range, and when the amount of data is very large, choose the necessary time range for analysis.
• Process the first-level statement Status:200, using keyword index filtering conditions (this way is the fastest, so include the index filtering conditions if possible).
• Process the WHERE filtering condition in SPL to efficiently read the corresponding data based on field indexes (and enabled statistics).
• Leverage the high-performance vectorized computing to obtain the filtered results, and then compute the remaining sections of SPL to get the final result.
• During the computation process, if the number of filtered rows already meets the requirement, terminate the filtering in advance to avoid unnecessary computation, especially in cases with high hit ratios.
After these optimizations, the execution performance of high-performance SPL is significantly improved compared with that of SPL in scan mode.
To evaluate the performance of high-performance SPL, we use an example where a single shard processes 100 million rows of data. Create a Logstore in an online environment with 10 shards, containing one billion data points within the query time range. (data of service access logs)
We select the following typical scenarios:
Scenario 1: Filter after processing with string functions
SPL statement: * | where split_part(Uri, '#', 2) = 'XXX'
Scenario 2: Phrase query, fuzzy query
SPL statement: * | where Content like '%XXX%'
Scenario 3: Extract subfields by using JSON and then filter them
SPL statement: * | where json_extract_scalar(Params, 'Schema') = 'XXX'
In these statements, we choose different comparison parameters to create scenarios with varying hit ratios. For example, a 1% hit ratio means that out of the original one billion data points, 10 million meet the WHERE condition. We request the first 20 matching data points, with the API parameters corresponding to the Getlogs interface being offset=0 and lines=20, and test the average duration.
| Hit Ratio | Scenario 1 Duration | Scenario 2 Duration | Scenario 3 Duration |
|---|---|---|---|
| 1% | 52 ms | 73 ms | 89 ms |
| 0.1% | 65 ms | 94 ms | 126 ms |
| 0.01% | 160 ms | 206 ms | 586 ms |
| 0.001% | 1301 ms | 2185 ms | 3074 ms |
| 0.0001% | 2826 ms | 3963 ms | 6783 ms |
The following conclusions can be drawn from the preceding table:
• When the hit ratio is high, all scenarios show excellent performance, even approaching that of keyword index queries.
• When the hit ratio is low, the execution time is longer due to the need for real-time computation of a large amount of data. The actual performance is influenced by factors such as the length of the data fields, the complexity of the operators in the statement, and the distribution of the matching results in the raw data.
• Overall, high-performance SPL can complete computations on a billion-level log volume in just a few seconds.
With the significant improvement in computing performance in high-performance SPL mode, the console now displays a histogram that directly shows the distribution of results filtered by the entire SPL statement. (This also means that the data within the entire range has been fully computed.)
For example, if there are 10 million raw log entries, and the SPL statement is Status:200 | where Category like '%xx%', and 100,000 logs meet the Status:200 condition, with 1,000 of those also meeting the where Category like '%xx%' condition, the histogram on the query interface will show the distribution of these final 1,000 logs over time.
Correspondingly, the interaction in high-performance SPL mode is identical to that in pure index query mode, supporting random pagination and allowing users to click on the histogram to directly go to the query results within the corresponding range.

In high-performance SPL mode, when calling GetLogs to query logs through an SPL statement, the offset parameter directly represents the offset of the filtered results, significantly simplifying API calls. This means that it is fully aligned with pure index queries in terms of usage. You can simply paginate based on the offset of the final filtered results.
You do not need to explicitly specify the execution mode. When all columns involved in the WHERE condition calculations in the SPL statement have field indexes created (and statistics enabled), the high-performance mode will be automatically used; otherwise, the scan mode will be used.
In high-performance SPL mode, the query itself does not incur any additional charges.
🔔Note: If the query does not fully hit the indexed columns and falls back to SPL in scan mode, and the current Logstore is on a pay-by-feature model, you will be charged based on the amount of raw log data scanned during the query process.
If there are keyword index filtering conditions, use them as much as possible, placing them in the first level of the multi-level SPL pipeline. Index queries are always the most efficient.
Especially for fuzzy match, phrase match, regular expression match, JSON data extraction, and more complex pure filtering scenarios, you could only use SQL syntax (* | select * where XXX) before. Now, you can replace it with SPL syntax (* | where XXX). This can provide a better output of the original log text rather than that in tabular mode, with a more convenient view of the filtered result histogram distribution and a simpler input experience.
Currently, SPL is used only for pure query and filtering scenarios. In the future, in log query scenarios, SPL syntax will further support operations such as sorting and aggregation (with aggregated results output in tabular mode). This will enhance and complete the multi-level pipeline cascade capabilities of SPL, enabling more flexible and powerful query and analysis of logs.
After enterprise log data is migrated to the cloud, one of the most basic needs is to search for desired information from massive log data. SLS introduces the SPL query syntax, which supports cascading syntax similar to Unix pipelines and a wide range of SQL functions. Additionally, with optimizations such as computing pushdown and vectorized computing, high-performance SPL queries can process hundreds of millions of data points within seconds. High-performance SPL also supports features like histograms of the final filtered results and random pagination, providing an experience similar to that of pure index query mode. For fuzzy match, phrase match, regular expression match, JSON data extraction, and more complex pure filtering scenarios, it is recommended to use SPL statements for querying.
High-performance SPL is currently being rolled out regionally. If you have any questions or requirements, please consult with us through a ticket.

705 posts | 57 followers
FollowAlibaba Cloud Native - April 26, 2024
Alibaba Cloud Native Community - March 29, 2024
Alibaba Cloud Native Community - July 31, 2025
Alibaba Cloud Native Community - May 31, 2024
Alibaba Cloud Native Community - May 7, 2026
Alibaba Cloud Native Community - November 6, 2025

705 posts | 57 followers
Follow Simple Log Service
An all-in-one service for log-type data
Learn More Storage Capacity Unit
Plan and optimize your storage budget with flexible storage services
Learn More Cloud-Native Applications Management Solution
Accelerate and secure the development, deployment, and management of containerized applications cost-effectively.
Learn More Log Management for AIOps Solution
Log into an artificial intelligence for IT operations (AIOps) environment with an intelligent, all-in-one, and out-of-the-box log management solution
Learn MoreMore Posts by Alibaba Cloud Native Community