Your Electron application is published. Users are using the application, business is running, and everything looks good—until one day, customer service forwards a user feedback: "The application crashed suddenly, and nothing was saved."
You open the log and find that the main process is in silence. The window.onerror of the rendering process is configured, but those data are scattered in the network requests of various windows, and a complete fault link cannot be pieced together at all. What is more tricky is that the .dmp file left by the native crash requires a dedicated Symbol Table service to parse, and you have not even figured out where to transmit the crash data.
This is not an isolated case. Desktop applications with tens of millions of daily active users, such as Visual Studio Code (VS Code), 1Code, OpenCode, and Cherry Studio, are all built on Electron. However, when we talk about observability, our focus is often on the server-side and the browser side. The desktop side is almost a monitoring blind spot.
This article aims to solve this problem: how to use a set of SDK to transform an Electron application from a "black box" to "full-link observability", and make desktop Agent monitoring truly accessible.
Before discussing the solution, you can first understand the essence of the problem. The monitoring challenge of Electron is rooted in its unique dual-process architecture:
The first layer of difficulty: the main process and the rendering process are two worlds. The main process runs on Node.js, and is responsible for native Application Programming Interface (API), system interaction, and process management. The rendering process runs on Chromium, and carries User Interface (UI) and business logic. The two are bridged through inter-process communication (IPC). However, from a monitoring perspective, they are two independent runtime environments—the exception types are different, the performance metrics are different, and the data collection methods are also different. The traditional frontend Real User Monitoring (RUM) SDK can only cover the rendering process, and the monitoring of the main process is completely missing.
The second layer of difficulty: a native crash is a "black box". An Electron application may experience a native crash because of V8 engine bugs, Native module abnormalities, or system resource exhaustion, leaving a binary .dmp dump file. Parsing it requires a minidump Resolver and a Symbol Table service, which is a completely unfamiliar realm for most frontend teams.
The third layer of difficulty: the data reporting path is unreliable. The network requests of the rendering process may break because of page destruction or window shutdown. If each window reports data independently, it not only wastes resources, but also easily loses key events—especially at the moment when a crash occurs.
The fourth layer of difficulty: IPC communication lacks observability. More and more Electron applications adopt frameworks such as TypeScript Remote Procedure Call (tRPC) to implement type-safe communication between the main process and the rendering process. However, there are almost no off-the-shelf monitoring solutions for the performance, faults, and Tracing Analysis of such IPC invocations.
These pain points stack together, making Electron monitoring a realm where "everyone knows it should be done, but no one wants to be the first to step into the pit".
init(), Full-end ObservabilityOur solution is @arms/rum-electron—the Electron SDK of Alibaba Cloud CloudMonitor. The core design concept can be summarized in one sentence: a single line of init() invocation in the main process automatically covers the comprehensive monitoring of the main process and all rendering processes.
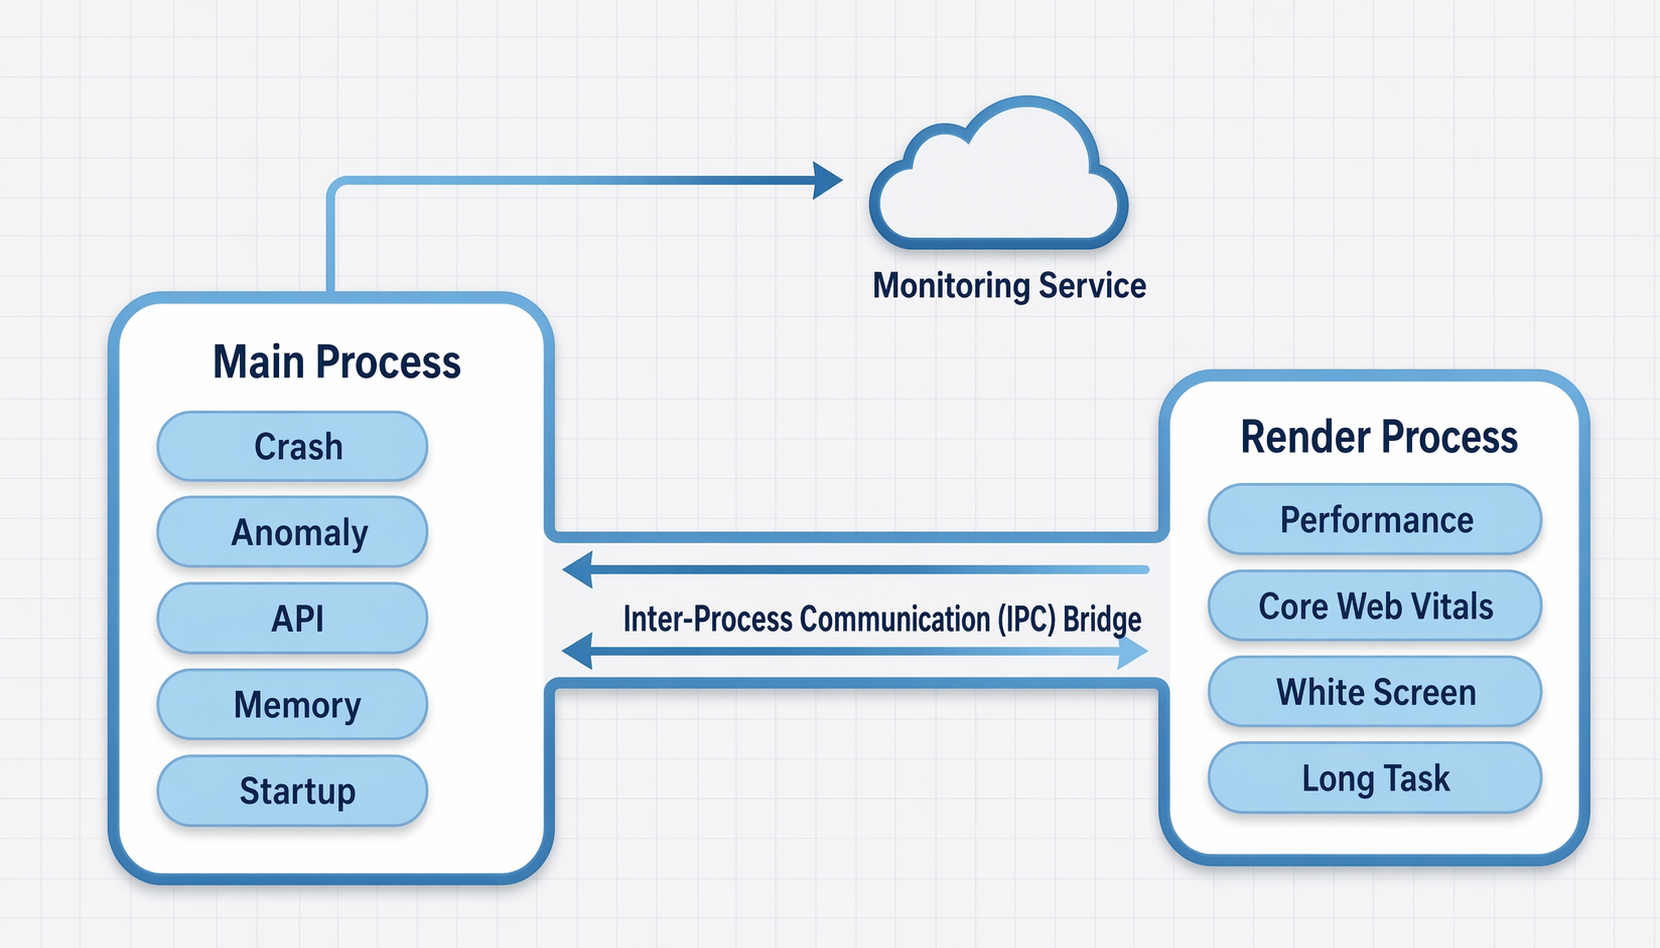
SDK dual-process architecture: the main process acts as the data convergence center, rendering process events backflow through the IPC Bridge, and are uniformly reported by the main process
This architecture has three key design decisions:
The main process acts as the data convergence center. All events—whether from the main process itself or the rendering process—ultimately converge to the main process, and are uniformly reported by ElectronReporter. The Browser SDK of the rendering process does not initiate any network requests, and events backflow to the main process through the arms:rum-bridge IPC channel. This ensures that data is still not lost in extreme scenarios such as window shutdown or page crash.
Zero-configuration automatic injection for rendering processes. The SDK acts as a listener for the web-contents-created event of Electron, and automatically injects the Browser SDK script and IPC Bridge at the dom-ready timing of each BrowserWindow. Developers do not need to modify the preload script, import the SDK in the rendering process, or manually configure anything.
Three-stage Build and single-package distribution. The Preload script, Browser SDK, and WebAssembly (WASM) crash parse engine are all embedded into the main package during the Build. Users can directly use the package after they run npm install @arms/rum-electron, without additional file download or configuration steps.
This is probably the part that you care about the most. The integration Code is as follows:
// main/index.ts —— Top of the file
import armsRum from '@arms/rum-electron';

armsRum.init({
  endpoint: '<your-endpoint>',
});
There is no second step. After the main process invokes init(), all BrowserWindows automatically obtain complete rendering process monitoring capabilities — page views (PVs), Performance, Web Vitals, Blank Screen Detection, API Requests, long tasks, and User interactions, without missing any.
The SDK automatically adapts to the contextIsolation security policy. When the contextIsolation security policy is Enabled, the SDK uses contextBridge.exposeInMainWorld() to safely expose the Inter-Process Communication (IPC) channel. When the contextIsolation security policy is shutdown, the SDK directly mounts the IPC channel to the window object. In scenarios where a Custom partition is used, you can pass an additional partition field when you invoke init.
When a native crash occurs in an Electron application, the System Generates a .dmp dump file. Traditional solutions (such as Sentry) upload this file to the server-side for symbol parse. Our approach is different — we moved the parse engine to the local client.
Specifically, we use the rust-minidump series of libraries based on Rust, compile them into WebAssembly by using wasm-pack, and directly complete crash stack trace and module parse locally after the application restarts. The WASM engine is embedded in the JS module with Base64 encoding (about 1.5 MB). You do not need additional file distribution or server-side symbol services, and the raw data of the crash does not leave the client.
The parse Result includes the following items: detection of the crash thread, the complete stack of all threads (module name, instruction address, offset, and frame reliability), the List of loaded modules (base address, size, and debug identifier), system info, and more. This means that your Security Compliance team can breathe a sigh of relief — sensitive crash stack Data is completely processed locally.
More and more Electron applications use electron-trpc to implement type-safe communication between processes. However, at the monitoring layer, the Performance, faults, and Tracing Analysis of invokes of tRPC procedures have always been a blind spot.
@arms/rum-electron easily solves this problem by using instrumentTRPC():
import { initTRPC } from '@trpc/server';
import armsRum from '@arms/rum-electron';

// Wrap a layer around t, and all procedures automatically include monitoring
const t = armsRum.instrumentTRPC(initTRPC.create());

export const appRouter = t.router({
greeting: t.procedure.input(...).query(...),// automatic monitoring
chat: t.procedure.input(...).mutation(...),// automatic monitoring
});
The bottom layer uses JavaScript Proxy to block the property access of t.procedure and automatically injects the monitoring middleware at runtime. The procedure definition on the business side does not need to be modified at all, and existing chained middleware (such as auth) is not affected. The collected data snaps to the OpenTelemetry RPC semantics conventions (rpc.system = 'trpc') and seamlessly achieves filter interaction with the backend application performance management (APM).
This is currently the only Electron SDK on the market that natively supports monitoring on the tRPC server side.
An Electron application is not an isolated island. It needs to invoke backend APIs, access AI inference services, and request third-party APIs. To connect the complete invocation chain from the client to the backend, distributed tracing is required.
The SDK supports five propagation protocols: W3C Trace Context, B3, B3 Multi, Jaeger, and SkyWalking. The fetch requests of the main process and the tRPC procedure share the same tracing decision. You can perform fine-grained control over the sampling policy by domain name:
armsRum.init({
  endpoint: '<your-endpoint>',
  tracing: {
    enable: true,
    sample: 10,                                   // global 10% sampling
    propagatorTypes: ['tracecontext', 'b3'],    // Optional: 'b3multi' | 'jaeger' | 'sw8'
    allowedUrls: [
      { match: /^https:\/\/api\.example\.com/, sample: 100 },  // core API 100%
      /^https:\/\/cdn\.example\.com/,                         // CDN 10%(use global)
    ],
  },
});
The tracing header is automatically injected into outbound requests, and the business code is completely unaware of it. This means that when user feedback indicates that "AI replies are too slow", you can trace all the way from the tRPC invocation of the Electron client to the Large Language Model (LLM) inference service of the backend, and accurately locate which step is slow.
The following is a complete chain from the frontend -> Agent -> MaaS.
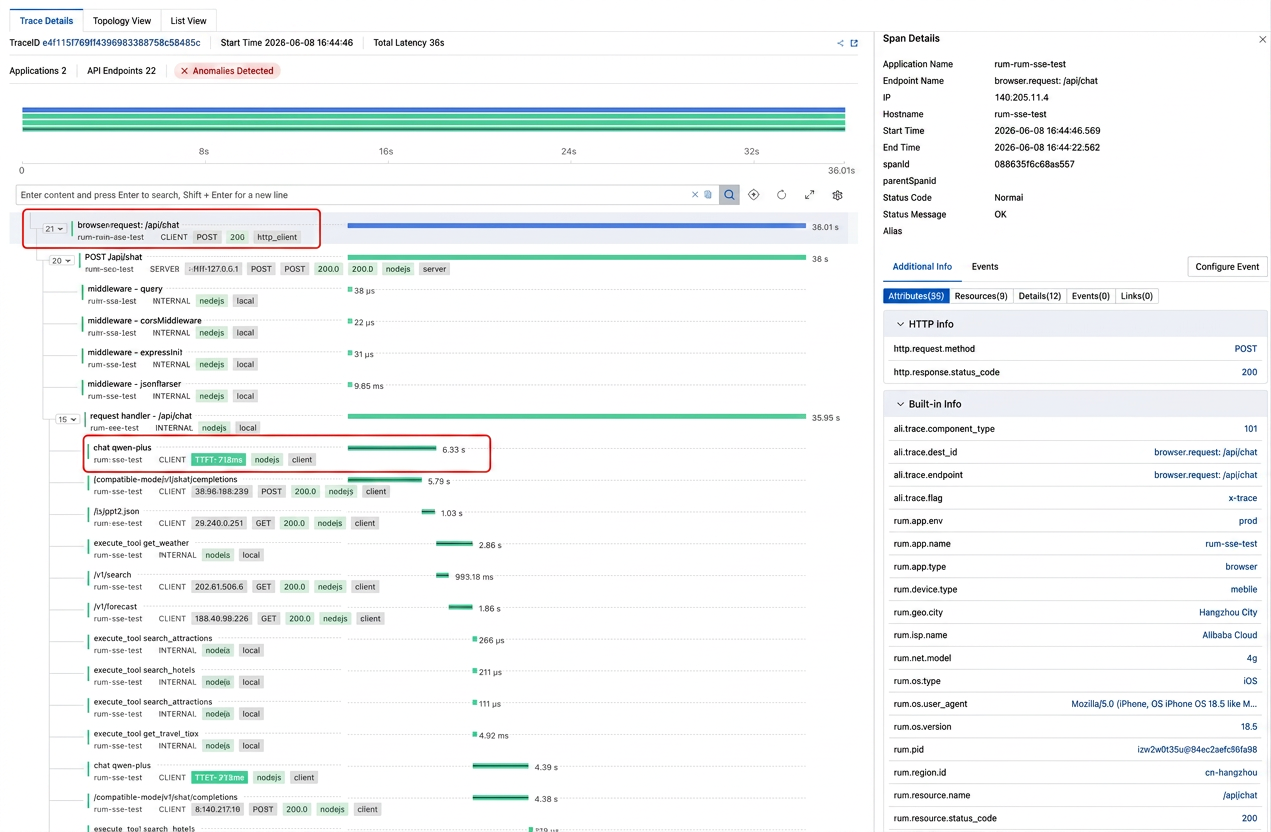
You can complete the integration of Tracing Analysis for both the frontend and backend simultaneously.
Electron desktop applications often run for a long time (such as IDEs, design tools, and IM clients), and a memory leak is the Sword of Damocles hanging over the head of every team.
We designed a memory monitoring solution of "high-frequency background sampling + low-frequency window Aggregation Reporting + event trigger fallback":
Every 10 seconds, you can perform synchronous sampling on app.getAppMetrics() and accumulate the data into the accumulator in the memory, with a CPU overhead < 0.1%.
Every 30 minutes, it Outputs two management events: memory_max (peak) and memory_avg (mean), with only about 5 management events per hour.
When a crash or exit occurs, the current memory state is immediately flushed. This ensures that out-of-memory Analysis is well-documented.
Cross-window mean trajectories track baseline drifts to detect memory leak Trends in advance.
The brilliance of this solution lies in the following aspect: it provides a memory profile with sufficient granularity at an extremely low overhead (5 management events per hour and < 0.1% Central Processing Unit (CPU)). When you detect that the memory_avg of a Version climbs window by window, it is highly likely a signal of a memory leak.
At the main process level, the SDK Builds a three-layer abnormal protection network: uncaughtException catches unhandled exceptions, unhandledRejection blocks Promise rejections, and console.error performs non-intrusive blocking. The three-layer fallback ensures zero omissions of main process faults.
At the rendering process level, the automatically injected Browser SDK covers scenarios such as frontend abnormalities, unhandled Promise rejections, and Blank Screen Detection. All anomalous activities Backflow to the main process through the Inter-Process Communication (IPC) Bridge for unified Reporting. Even if the rendering process crashes, the previously collected management events will not be lost.
All function blocks adopt a non-intrusive monkey patch design, which can be completely reverted after the SDK is uninstalled. It comes quietly and leaves without a trace.
Below, we will make an objective comparison between @arms/rum-electron, the Sentry solution that has the deepest investment in the Electron monitoring realm, and the Electron Support status of mainstream observability platforms in China:
Sentry is currently the vendor with the deepest investment and the most active community in the Electron monitoring realm. It has excellent capabilities such as the dedicated SDK @sentry/electron, an independent product page, session replay, and event loop block Detection. It has a very high degree of recognition in the Developer Group outside China. More than 75% of Electron developers have integrated Sentry in their production environments (official Data).
In terms of feature coverage, the differences between the two are mainly reflected in the following dimensions:
| Dimension | Sentry Electron | @arms/rum-electron |
|---|---|---|
| Crash parsing | Uploaded to the Sentry server-side for parsing. This requires the symbol service. | Local WebAssembly (WASM) parsing. Data does not leave the client. |
| tRPC monitoring | No native support | instrumentTRPC is out-of-the-box |
| Distributed tracing | Sentry proprietary protocol | Five protocols: W3C, B3, Jaeger, and SkyWalking |
| Rendering process injection | v4+ is simplified, but extra configuration steps are still required | Fully automatic zero-configuration injection |
| Session replay | Native support for Session Replay | Support |
| Memory monitoring | Basic memory information | High-frequency sampling + window aggregation + event trigger fallback |
| Data Sovereignty | Data is stored on Sentry servers outside China | Alibaba Cloud ARMS. Compliance and controllability are ensured. |
| Integration complexity | You must configure the main process and rendering process separately | The init() function in the main process handles everything |
Simply put, Sentry has obvious advantages in the ecosystem outside China and community Size. However, in dimensions such as Data compliance, tRPC monitoring, crash Data Sovereignty, and Tracing Analysis protocol coverage,@arms/rum-electron provides a solution that is more suitable for domestic enterprises and teams with Strict requirements for data security.
You may ask: Can I directly use a general frontend RUM SDK? It is technically possible, but the experience is completely different:
| Dimension | General frontend Real User Monitoring (RUM) SDK | @arms/rum-electron |
|---|---|---|
| Monitoring scope | Only the rendering process (frontend) | Full coverage of the main process and rendering process |
| Native crash | Not supported | Rust WASM local parsing |
| Inter-process communication monitoring | None | Inter-Process Communication (IPC) Bridge automatic aggregation |
| tRPC monitoring | Not supported | Out-of-the-box |
| Electron specialization | None. General Web solution. | Deep adaptation to the dual-process model |
| Integration complexity | You must configure the frontend and backend separately | A single init() provides full coverage |
Simply put, a general frontend RUM SDK can see half of the Electron application (the rendering process), while @arms/rum-electron gives you a panoramic view.
The following are the complete Integration steps:
Environment requirements: Electron >= 28 (The SDK uses the session.registerPreloadScript() API. Lower Versions automatically downgrade to session.setPreloads().)
Step 1: Install
npm install @arms/rum-electronStep 2: Main process entry initialization
import armsRum from '@arms/rum-electron';
import { app, BrowserWindow } from 'electron';

armsRum.init({
  endpoint: '<your-endpoint>',  // Obtained from the  CloudMonitor console
  env: 'prod',
  version: '1.0.0',
  // Optional: enable Tracing Analysis (put the tracing configuration directly in the init parameter)
  // tracing: {
  //   enable: true,
  //   sample: 100,
  //   propagatorTypes: ['tracecontext'],
  // },
});

app.whenReady().then(() => {
  const win = new BrowserWindow({
    webPreferences: {
      // No SDK-related configuration is required
    }
  });
  win.loadURL('https://your-app.com');
});
Step 3 (optional): enable TypeScript Remote Procedure Call (tRPC) monitoring
const t = armsRum.instrumentTRPC(initTRPC.create());It is that simple. You do not need to modify preload or import anything in the rendering process. Zero configuration, zero intrusion, and zero additional manual install.
The value of the monitoring SDK is to help Search for problems, not to become a problem itself. The following are the resource overhead Data of @arms/rum-electron:
| Metric | Data | Description |
|---|---|---|
| WASM crash parsing engine | ~1.5 MB (Base64 embedded) | Loaded only during the first crash parsing. This does not impact Start. |
| CPU overhead for memory Collection | < 0.1% | 10 s synchronous sampling and setTimeout self-descheduling. Callbacks are not stacked. |
| Memory event volume | ~5 entries/hour | 30 min aggregation window + crash/exit trigger |
| Maximum Session duration | 24 hours | Automatic expire and Renewal after 30 minutes of no Activity |
| evaluateApi timeout | 50 ms hard limit | Automatic backoff to the original event upon a timeout to avoid slowing down business Requests |
| Single Page Application (SPA) window period | 200ms | Frame redirection merge to avoid duplicate Page Views (PVs) |
| Propagation protocol | 5 types | tracecontext / b3 / b3multi / jaeger / sw8 |
The SDK follows the "principle of minimum interference" everywhere in its design. The memory Collection uses an accumulator with O(1) assign. The WebAssembly (WASM) initialization is delayed until it is first used. The Remote Configuration adopts the launch-first pattern and does not block the Application Start. All function blocks Support the restore revert, which ensures that the existence of the SDK does not become a burden on the application.
The scenarios that @arms/rum-electron targets include but are not limited to the following:
Enterprise-level Electron desktop applications. These applications include collaboration tools such as Slack, Discord, and Notion, and various internal enterprise tools and low-Code platforms. You can uniformly monitor health, Performance, and stability, and use Remote Configuration for dynamic adjustment of the sample rate.
AI desktop applications. These applications include AI chat assistants, AI programming tools, and AI design tools. The tRPC monitoring covers the AI infer invoke trace. The memory level tracking helps Search for the memory leak caused by Large Language Model (LLM) load. The distributed tracing connects the client to the AI backend.
Desktop applications with a long lifecycle. These applications include integrated development environments (IDEs), design tools, and trading platforms. You can use an aggregation window of 30 minutes to track baseline drift, immediately flush the memory site when a crash occurs, and Search for a memory leak in advance.
Industries with Strict requirements for data security. These industries include finance, government, and healthcare. The local parse of the crash stack is performed by WASM, and the raw data does not leave the client. Alibaba Cloud Application Real-Time Monitoring Service (ARMS) has its deployment in China to meet graded protection requirements.
Electron gives Web Developers the ability to Build cross-platform desktop applications, but it also introduces unique monitoring challenges such as dual-process architecture, native crash, and inter-process communication (IPC). In the past, these challenges were either ignored or required piecing together multiple sets of tools to barely cover them.
The Target of @arms/rum-electron is simple: Make the monitoring of Electron applications as simple as that of Web applications. These capabilities, including the out-of-the-box integration experience, full coverage of the main process and rendering process, local parse of crash Data, native Support for tRPC, and five-protocol Tracing Analysis, are integrated into one Node Package Manager (npm) package, which is ready to use after you install it.
Desktop Agent monitoring is now within reach.
Experience now: Go to CloudMonitor for the Creation of a Real User Monitoring application, and you can start the integration after you retrieve the endpoint.
Technical documents: See the complete configuration reference document.
Community communication: You can join the DingTalk group to communicate with the Alibaba Cloud observability team about Electron monitoring practices.
When AI Coding Agent Becomes Infrastructure: Why We Open-Sourced LoongSuite Pilot

781 posts | 60 followers
FollowAlibaba Clouder - April 16, 2018
Alibaba Clouder - April 17, 2018
Alibaba Clouder - April 18, 2018
Alibaba Cloud Big Data and AI - July 9, 2026
ApsaraDB - September 2, 2026
Alibaba Cloud Community - August 31, 2026
781 posts | 60 followers
Follow Application Real-Time Monitoring Service
Build business monitoring capabilities with real time response based on frontend monitoring, application monitoring, and custom business monitoring capabilities
Learn More CloudMonitor
Automate performance monitoring of all your web resources and applications in real-time
Learn More Real-Time Livestreaming Solutions
Stream sports and events on the Internet smoothly to worldwide audiences concurrently
Learn More Managed Service for Prometheus
Multi-source metrics are aggregated to monitor the status of your business and services in real time.
Learn MoreMore Posts by Alibaba Cloud Native Community

