When hundreds of thousands of store terminals fire checkout and payment requests at the same time during business peaks, a single moment of jitter anywhere on the path turns into queues at the counter and failed transactions. For Lemeng, a digital services provider for the food retail industry, O&M is not a back-office support function but a front-line business activity that directly shapes the in-store experience and the brand's reputation. Absorbing peak traffic from a vast store network while keeping its multi-tenant SaaS stable through frequent release cycles is the challenge the company has to meet.
Zhejiang Lemeng Information Technology Co., Ltd. ("Lemeng") is a software and information technology service provider focused on digitalization for the food retail industry. Under the Lemeng brand, the company delivers integrated retail digital-intelligence solutions for supermarkets, chain stores and trade distributors, with a product matrix that covers the full range of store operations: a retail POS suite in single-store, chain, supermarket and overseas editions, chain-store ERP, trade distribution and inventory management, a warehouse management system (WMS), a fund and accounting system (aggregated payment and split settlement), omni-channel membership CRM, and a WeChat mini-program new-retail mall, plus extended capabilities such as fresh-produce delivery, visual merchandising and AI smart scales. Its industry solutions cover twelve verticals — supermarkets, snacks, fruit, fresh produce, cooked food, roasted nuts, bakery, tea drinks, catering, meat, alcoholic beverages and trade distribution. To date the company serves more than 200,000 stores in more than 200 cities nationwide, has been chosen by more than 15,000 retail brands and more than 100 leading regional enterprises, and provides 24/7 human support.
Lemeng's business model makes its O&M far more complex than that of a typical SaaS provider. Huge numbers of store terminals generate checkout and payment requests all at once during business peaks; the product line spans checkout, ERP, WMS, payment and split settlement, mini-programs and more; and observability data sits in different technology stacks. As business lines and store numbers keep growing, that complexity has climbed to a new order of magnitude.
Fragmented alert governance, with real anomalies buried in storms
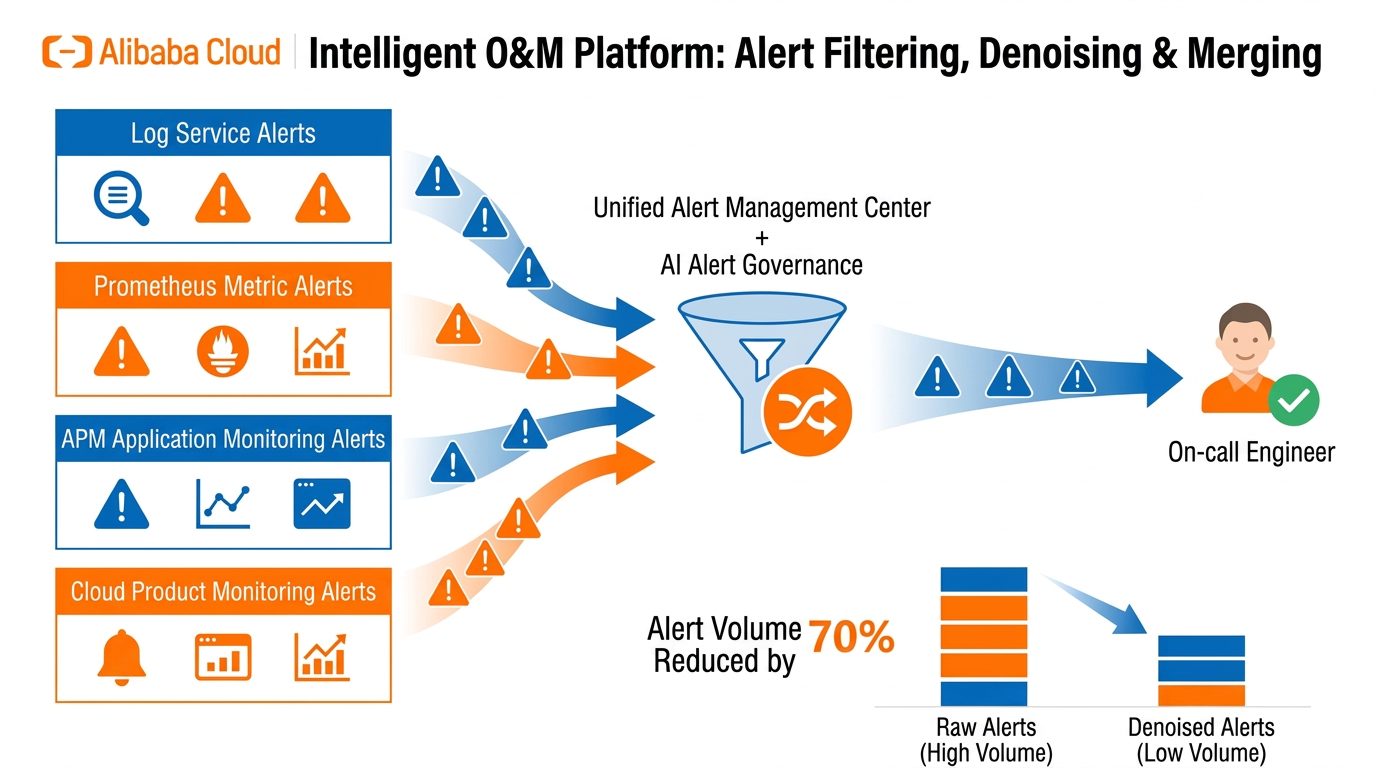
Checkout SaaS, chain ERP, WMS and payment accounting each relied on a different observability system — Simple Log Service (SLS), Prometheus metrics, application performance management (APM) and cloud service monitoring — so alert rules had to be configured and maintained in separate consoles. As the business expanded, rule counts ballooned. Misconfigurations and omissions were easy to introduce and hard to detect, and traffic peaks during sales promotions and holidays set off alert storms in which engineers on duty struggled to pick out the issues that genuinely needed action.
Observability data hard to produce, hard for the business to consume
Reporting needs across internal R&D, customer success and regional operations teams vary widely, yet all of them matter: API success rates, latency distribution and resource load on the system side; store online rate, checkout transaction volume, payment success rate and split-settlement timeliness on the business side. Building such dashboards usually meant writing complex queries across several kinds of observability data — slow and error-prone. For business users, query syntax was another barrier. Observability stayed in the hands of a few experts, and response times could not keep pace with the business.
Manual monitoring before failures, manual digging after them
On the prevention side, engineers logged in and checked the container clusters and cloud service resources behind the multi-tenant business item by item. There was no reusable inspection SOP and no systematic way to spot resource bottlenecks and latent risks before a failure. On the diagnosis side, a single failed checkout in a store could originate in the store network, the POS terminal, the SaaS application, the database or the payment channel. Cross-system troubleshooting meant switching between platforms again and again and correlating data by hand, and the process leaned heavily on the experience of senior engineers. Every additional minute spent diagnosing the payment path directly affects store operations and financial compliance.
What Lemeng needed was not another monitoring tool, but an artificial intelligence for IT operations (AIOps) system that would unify the alert entry point, lower the barrier to consuming data, move the line of defense forward, and let AI handle cross-system diagnosis.
After evaluation, Lemeng chose Alibaba Cloud's Cloud Monitor 2.0 (CMS) together with STAROps, Alibaba Cloud's full-domain AIOps platform, as the core of this upgrade. Lemeng had already accumulated logs, metrics, traces and other observability data on the Alibaba Cloud observability stack, and STAROps uses the UModel observability model to unify them into an end-to-end digital twin that alert governance, automated inspection, root cause analysis and other capabilities then consume. The platform needs no separate activation — it is enabled by default through the STAROps entry point in the CMS 2.0 or SLS console — so it slots smoothly into Lemeng's existing observability setup. The upgrade delivered four layers of capability to address the three challenges.
(1) Unified Alert Governance: Consolidating Alerts from Multiple Systems into a Single Entry Point
With the Alert Management Center in CMS 2.0, Lemeng brought alert rules that had been scattered across SLS, Prometheus metrics, application monitoring and cloud service monitoring into one platform, so engineers no longer jump between systems to configure them separately. Lemeng also brought in the alert rule governance Skill built into STAROps: it inspects existing alert rules automatically and issues governance recommendations, flagging duplicate rules, rules with unsound thresholds and stale rules that have not fired in a long time. Combined with alert and event analysis, it consolidates alerts during peak periods, significantly reducing the drain of alert storms on on-duty efficiency.
(2) Natural-Language Observability: Generating Dashboards with a Single Sentence
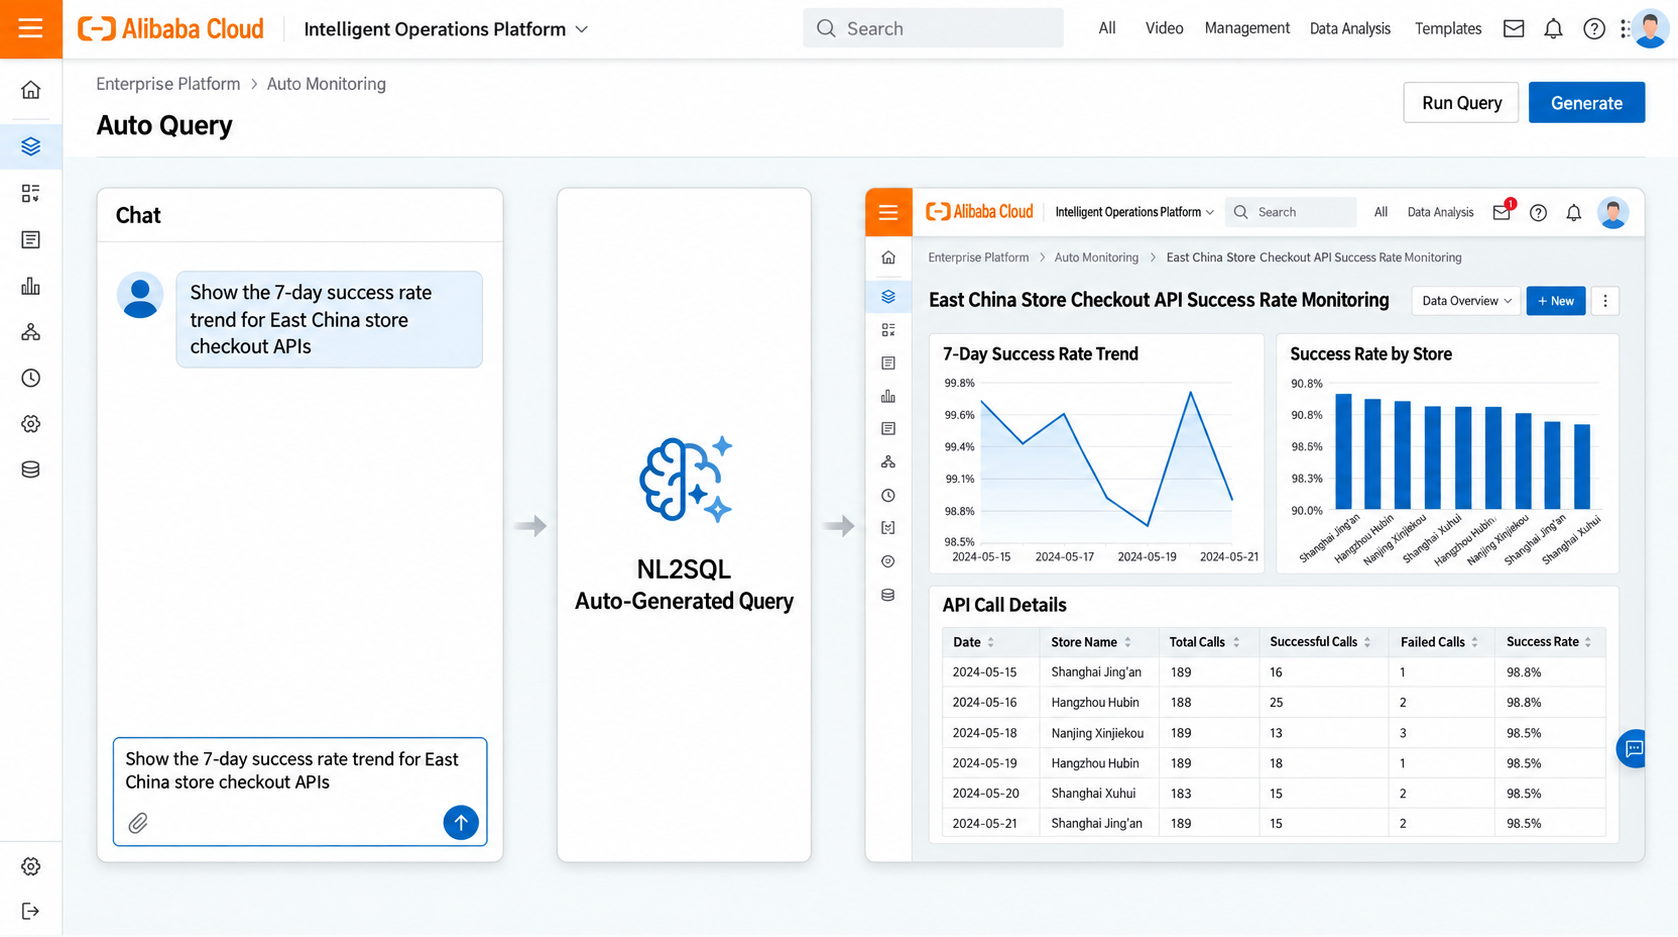
Using the natural-language-to-SQL (NL2SQL) capability in STAROps, Lemeng's developers and operations staff describe what they want to observe in plain language, and the platform generates the matching queries and dashboards. Typical uses include checking the trend in checkout API success rates for stores in a given region; comparing latency distribution across payment channels during sales promotions; tallying delay distribution and failure details for split-settlement jobs; and summarizing alert handling and acknowledgment status by line of business. Producing a dashboard has collapsed from a multi-step process — file a request, wait for scheduling, write the query — into a single conversation, so observability data arrives quickly and business roles can use it directly.
(3) Scheduled Intelligent Inspection: Delegating Repetitive Checks to Digital Employees
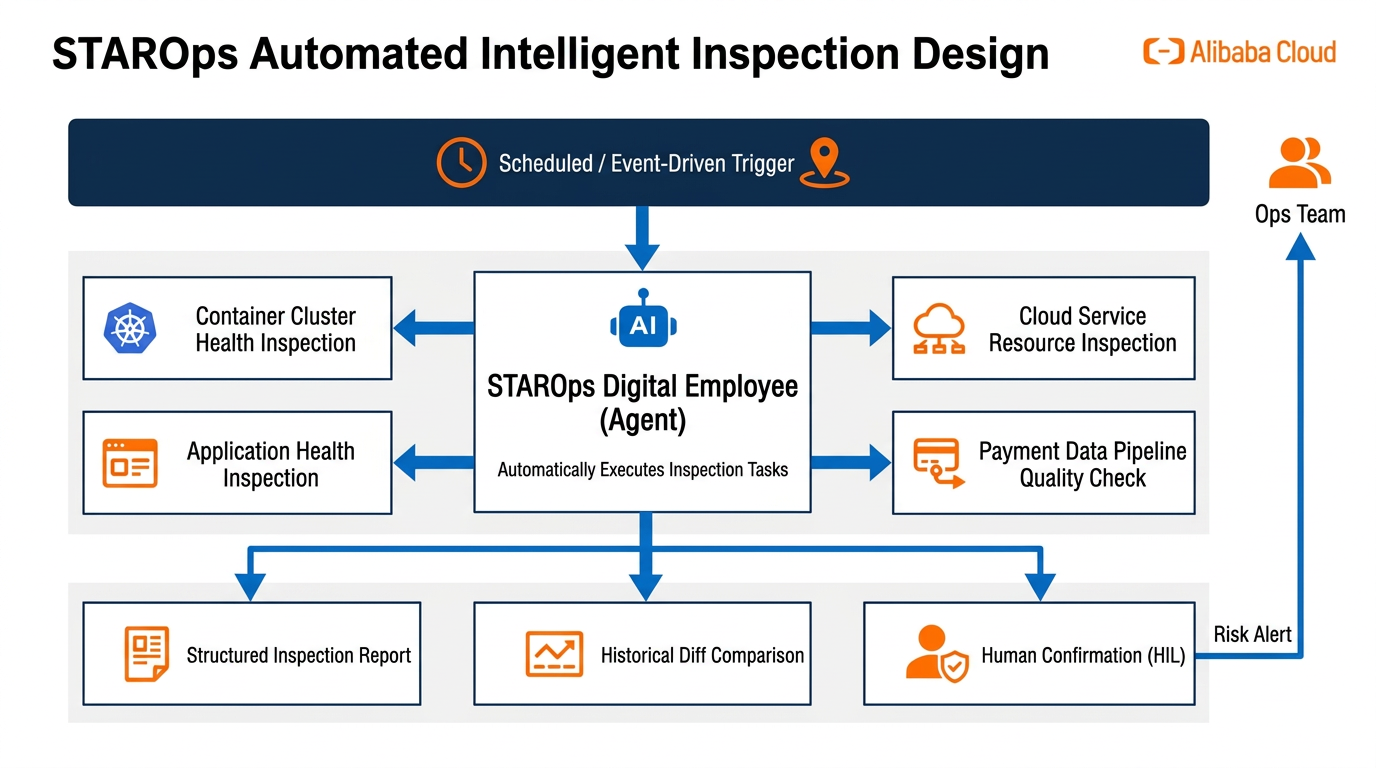
Through the STAROps long-running task (Mission) mechanism, Lemeng lets digital employees (Agents) run inspections, analyses and change operations on their own, either on a schedule or event-driven, turning repetitive checks that once depended on people into reliable automated flows. The inspection scenarios in production include container cluster health inspection, application health inspection, cloud service resource health inspection, and quality checks on the payment and split-settlement data pipelines. Inspection results are captured as structured reports and can be compared against historical results, so resource bottlenecks and configuration drift surface before they turn into failures. For high-risk actions such as scaling and configuration changes, the human-in-the-loop (HIL) mechanism built into Mission prompts for manual confirmation, raising the level of automation while holding the safety line on changes. This layer upgrades the line of defense from manual item-by-item checking to automated protection.
(4) Dedicated O&M Digital Employee: Rapidly Narrowing Root Causes Across Systems
By combining default rules, Skills and Model Context Protocol (MCP) tools, Lemeng customized the general-purpose digital employee into a dedicated SRE agent fitted to its own business, configuring that agent's responsibilities, permissions and callable tools along its own system boundaries. When an alert fires on the checkout or payment path, the digital employee can trigger rapid root cause analysis from the alert context or from an engineer's natural-language question: using the O&M digital twin built with UModel, it correlates applications, services, resources, topology, alerts and changes in one view, and with AI analysis operators such as metric anomaly detection, log clustering, trace analysis and change retracing, it performs causal inference across systems. Troubleshooting that once relied on senior engineers' experience becomes reusable automated analysis, which directly addresses the problem of long fault-localization chains.
(1) Alert Governance: From Fragmented Manual Work to Unified Standard Actions
Before, each of the four observability systems had its own alert entry point. Rule configuration depended on individual experience, misconfigurations and omissions went unnoticed, alerts flooded the screen at peak times, and engineers on duty had to sift real anomalies out of the noise.
Now, a unified Alert Management Center plus the rule governance Skill turns adding, reviewing and optimizing rules from manual work driven by individual experience into a standard, tool-supported process. Peak-time alerts are consolidated as needed, and alert storms no longer disrupt on-duty judgment. Alerts have been reduced by 70%.
(2) Data Access: From Request-and-Schedule to a Dashboard in One Conversation
Before, a business observability dashboard went through filing a request, waiting for scheduling and writing complex queries — slow to build and error-prone — and business users who did not know the query syntax could only wait for an expert to get back to them.
Now, with NL2SQL and conversational data retrieval, developers, customer success staff and operations teams get core application observability metrics and store-operations data in natural language, without knowing any query syntax. Observability has spread from a handful of experts to a much wider set of business roles, and response times are now measured in minutes.
(3) O&M Posture: From Reactive Response to Proactive Protection, with AI-Assisted Troubleshooting
Before, resource inspection meant checking items by hand, with no guarantee of coverage or consistency, and fault localization meant switching between platforms and correlating data manually, so mean time to repair (MTTR) was hard to bring down consistently.
Now, with a release every two weeks, scheduled Mission inspections keep producing structured reports and comparisons against history, configuration drift is caught early, and automated inspection provides a steady safety net for release quality. When a failure occurs, the dedicated digital employee triggers rapid root cause analysis straight from an alert or a question, and uses the digital twin topology together with AI analysis operators to narrow the search across systems — cutting the time engineers spend switching between consoles and correlating data by hand. MTTR on the checkout and payment paths has been steadily reduced to a matter of minutes.
Unified alert governance, natural-language observability, automated inspection and intelligent root cause analysis are now running on the core paths. Next, Lemeng and Alibaba Cloud will deepen the work in three directions.
(1) From "Core-Path Pilot" to "Full Business-Line Coverage"
Lemeng will widen the digital employee's remit from the checkout and payment paths to more systems — chain ERP, WMS, mini-program new retail and others — and reuse the proven alert governance, inspection and root cause analysis capabilities as the standard configuration for every product line, so that AIOps becomes standard practice across all business lines.
(2) From "Technical Metric Observability" to "Business Continuity Measurement"
Building on NL2SQL cross-data-source querying, Lemeng will connect technical metrics such as API success rate and latency with business metrics such as store online rate, checkout transaction volume and split-settlement timeliness, building a measurement framework centered on business continuity so that the value of O&M can be expressed directly in business language.
(3) From "Human-Machine Collaboration" to "Higher-Level Autonomous O&M"
Within the safety frame of the human-in-the-loop mechanism, Lemeng will gradually widen the range of scenarios the digital employee closes out on its own, and keep converting the experience gathered in inspection, diagnosis and change into reusable skill assets — so that O&M know-how evolves from individual capability into an organizational asset.

781 posts | 60 followers
FollowAlibaba Cloud Native Community - August 25, 2026
Alibaba Cloud Native Community - August 26, 2026
Alibaba Clouder - May 20, 2020
Alibaba Cloud Native Community - June 8, 2026
ray - April 16, 2025
Iain Ferguson - November 26, 2021
781 posts | 60 followers
Follow Simple Log Service
An all-in-one service for log-type data
Learn More CloudMonitor
Automate performance monitoring of all your web resources and applications in real-time
Learn More AgentLoop
An Agent self-evolution platform designed to make your Agents progressively smarter and more attuned to users.
Learn More Log Management for AIOps Solution
Log into an artificial intelligence for IT operations (AIOps) environment with an intelligent, all-in-one, and out-of-the-box log management solution
Learn MoreMore Posts by Alibaba Cloud Native Community

