By Yuanyi
Alibaba Cloud Log Service (SLS) strives to develop itself into a DevOps data mid-end that provides rich capabilities including host data access, storage, analysis, and visualization. This article describes how SLS supports the Prometheus solution to provide a cloud-native Prometheus engine that features high performance, high availability, and zero O&M.
Cloud-native technologies have been booming and flourishing across the world in recent years, and Cloud Native Computing Foundation (CNCF), one of the most influential projects in the IT field, is the strong support behind cloud-native technologies. As a non-profit organization under Linux Foundation, CNCF manages a dozen projects related to cloud-native technologies, among which the best known is Kubernetes, the de-facto standard in the container orchestration field.
Prometheus is the second CNCF graduated project, and has become the most popular one apart from Kubernetes. It is no exaggeration to say that Prometheus has become a de-facto standard of cloud-native monitoring. If the first step of enabling cloud native is to build a Kubernetes environment, then Prometheus is the first step to implement cloud-native monitoring.
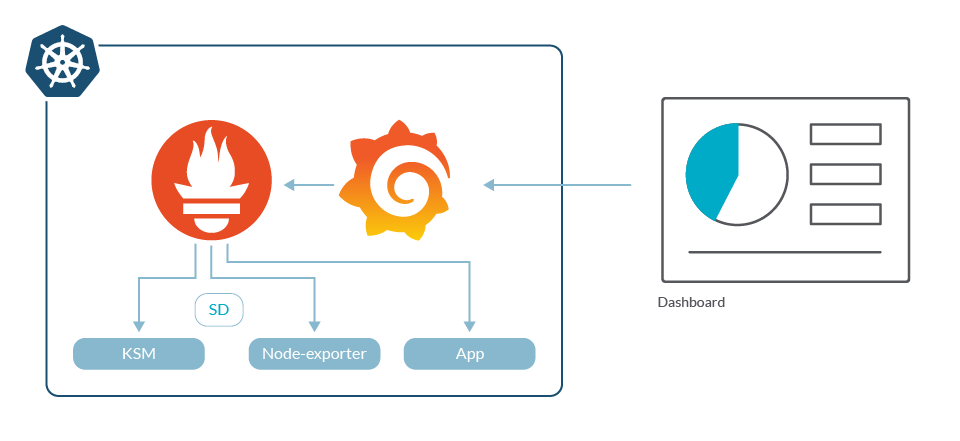
After you deploy apps in Kubernetes, you will find it necessary to check the running statuses of the cluster and the apps. However, some of the monitoring methods in the virtual machine (VM) environment are no longer applicable. Although there are several alternatives to Prometheus, it is the best choice for many applications due to these advantages:
When we first move an app and related monitoring methods from a test environment to an online cluster, everything goes smoothly, the app runs properly and the monitoring metrics looking normal. However, when more and more apps are deployed in the production environment and the access pressure gradually increases, we will gradually realize some of the pain points of Prometheus:

Alibaba Cloud Log Service (SLS) strives to develop itself into a DevOps data mid-end that provides rich capabilities such as host data access, storage, analysis, and visualization. It provides an all-in-one platform where you can easily handle data-related tasks in DevOps scenarios and quickly build your enterprise's observable platform.
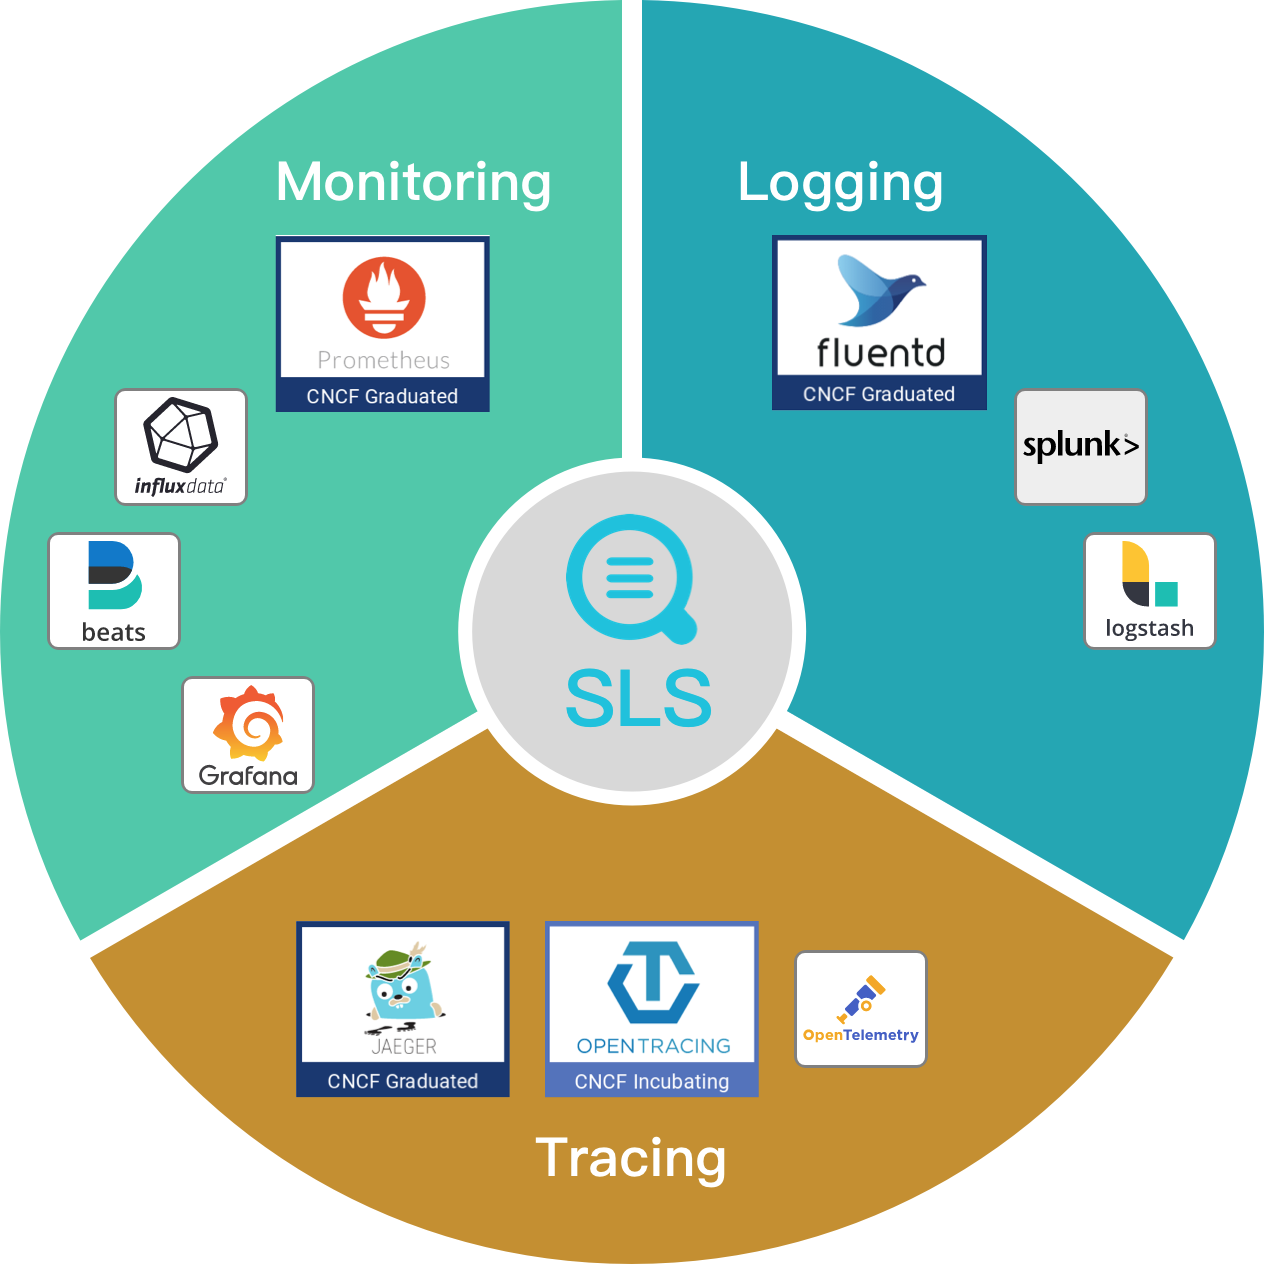
SLS provides a wide range of data access methods and supports many data access approaches related to cloud-native observability. The preceding figure shows the projects that are supported by SLS for data access in the CNCF landscape. The monitoring, logging, and tracing features all support CNCF graduated projects, such as Prometheus, Fluentd, and Jaeger. The main reasons for using SLS to store Prometheus monitoring data include:
The SLS MetricStore provides native support for PromQL. All data is distributed to multiple hosts for distributed storage as shards. The computing layer integrates a Prometheus QueryEngine module to separate storage and computing, so that massive data processing can be carried out easily.
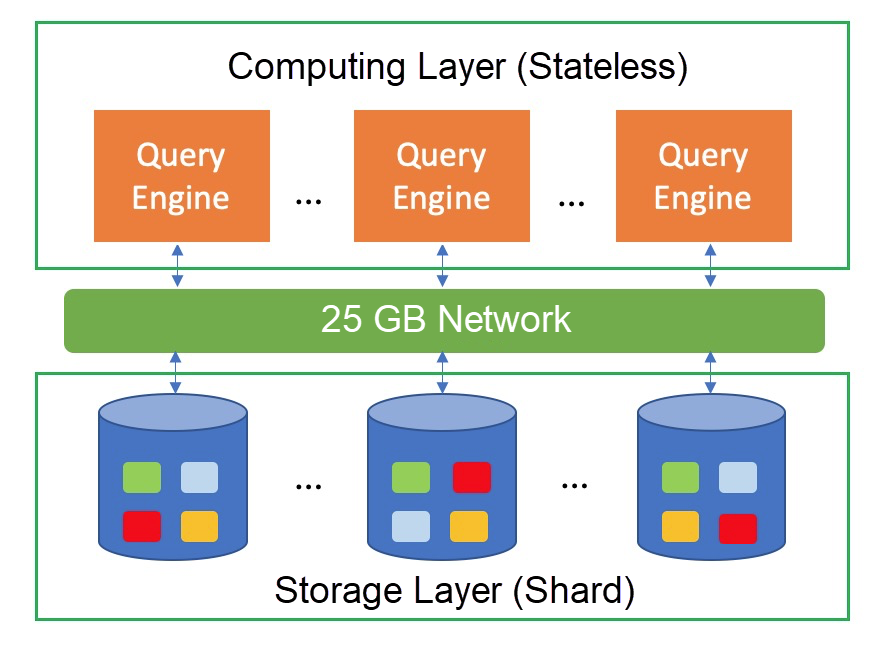
Compared with the community-provided Prometheus distributed extensions, such as Cortex, Thanos, M3DB, FiloDB, and VictoriaMetrics, the SLS's distributed implementation solution is closer to the community's goal of solving the restrictions on the use of native Prometheus.
In addition to supporting these requirements of the community, SLS can provide the following advantages for Prometheus:
As cloud-native monitoring software, Prometheus provides sound native support for Kubernetes. In Kubernetes, almost all components provide Prometheus metrics interfaces. Therefore, Prometheus has become a de-facto Kubernetes' monitoring implementation standard. The next section describes how to deploy Prometheus monitoring for Kubernetes and how to use SLS MetricStore as the storage backend.
We recommend that you register a cluster to connect an independently built Kubernetes to Alibaba Cloud. After the registration is complete, you can follow the Alibaba Cloud Kubernetes installation procedure to install the cluster.
If you opt for other connection approaches, see the official instructions of Helm package for installation. Before the installation, you need to create a secret and change the default configuration. For more information, see the following description of installing Alibaba Cloud Kubernetes.
If you use Alibaba Cloud Kubernetes, you can install and configure Prometheus in the app directory to store data to SLS. The configuration procedure is as follows:
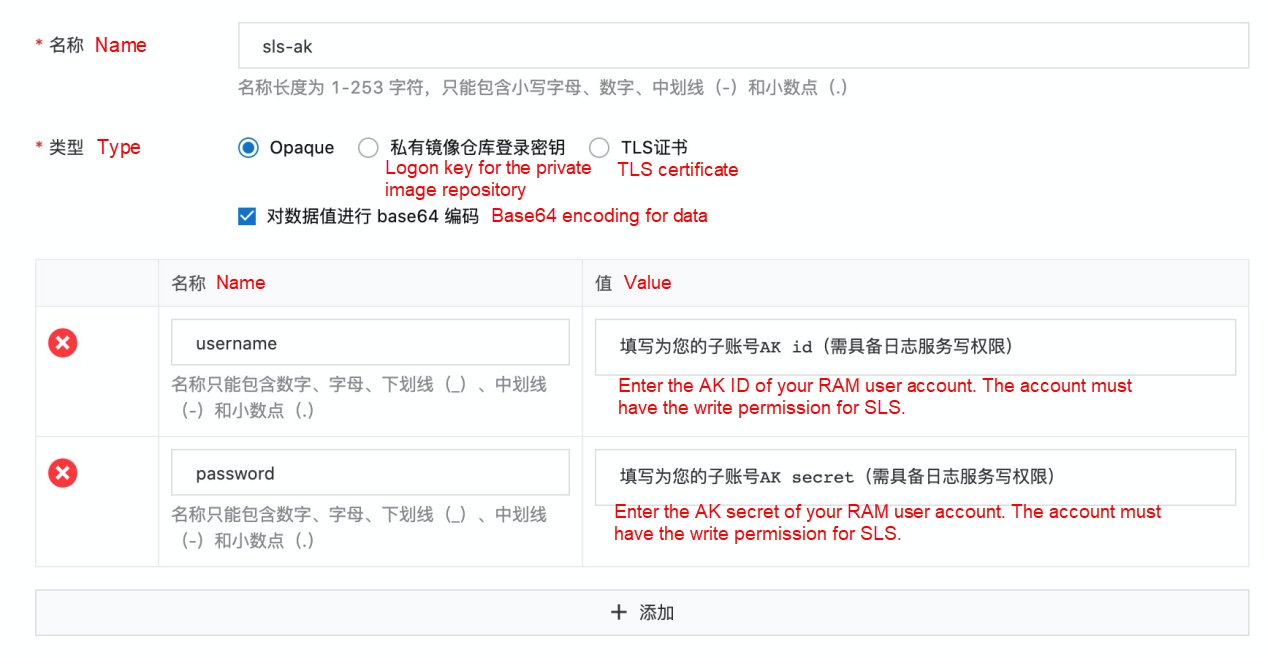
In the pop-up installation page, click the Parameters tab and modify the configuration items. Major modifications include the following.
retention under prometheusSpec. The value 1d or 12h is recommended.prometheusSpec to true, and add the remoteWrite configuration. Modify the URL parameters as well. remoteWrite:
- basicAuth:
username:
name: sls-ak
key: username
password:
name: sls-ak
key: password
queueConfig:
batchSendDeadline: 20s
maxBackoff: 5s
maxRetries: 10
minBackoff: 100ms
### The URL is https://{sls-enpoint}/prometheus/{project}/{metricstore}/api/v1/write.
### For the sls-endpoint settings, see https://help.aliyun.com/document_detail/29008.html.
### Replace project and metricstore values with your own project and metricstore.
url: https://cn-beijing.log.aliyuncs.com/prometheus/sls-zc-test-bj-b/prometheus-raw/api/v1/write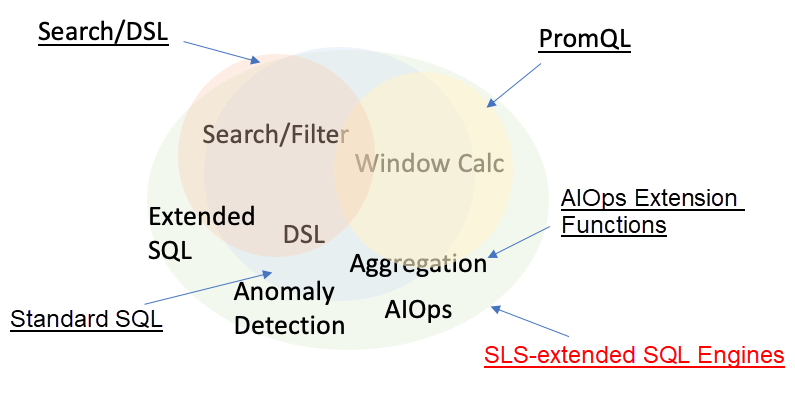
SLS provides three time-series data modes. SQL plays a dominant role in time series data queries, and SQL's support for calling PromQL ensures both easier syntax and powerful functionality. In addition, SLS supports directly calling PromQL to support the open-source ecosystem, such as the integration with Grafana.
SLS supports the Prometheus remote write protocol for data writes in MetricsStore implementation and supports PromQL queries by calling Prometheus APIs. This enables Prometheus to act as a data source of Grafana, so that Prometheus can be compatible with open-source ecosystems. If your data is written by using Prometheus, SLS will be very suitable for your scenarios.
Prometheus MetricsStore reuses the underlying architecture of SLS, so it is designed to support SQL queries. For example, the long SQL statements in the preceding example are pure SQL queries. Nevertheless, pure SQL queries require a lot of optimization to handle time series data with ease, which is time-consuming. In view of this, SLS offers a third solution.
SLS encapsulates PromQL into several functions, which can serve as subqueries to support nesting complete SQL statements at the outer layer. The following shows an example.
Pure PromQL queries:
SELECT promql_query('up') FROM metrics
SELECT promql_query_range('up', '1m') FROM metrics
PromQL as subqueries:
SELECT sum(value) FROM (SELECT promql_query('up') FROM metrics)Complicated SQL queries with PromQL as subqueries:
select ts_predicate_arma(time, value, 5, 1, 1 , 1, 1, true) from ( SELECT (time/1000) as time, value from ( select promql_query_range('1 - avg(irate(node_cpu_seconds_total{instance=~".*",mode="idle"}[10m]))', '10m') as t from metrics ) order by time asc ) limit 10000Currently, SLS supports the following frequently used APIs in PromQL: query(varchar), query_range(varchar, varchar?), labels(,label_values(varchar), and series(varchar).
Specifically, query_range also supports an automatic step when the second parameter is empty.
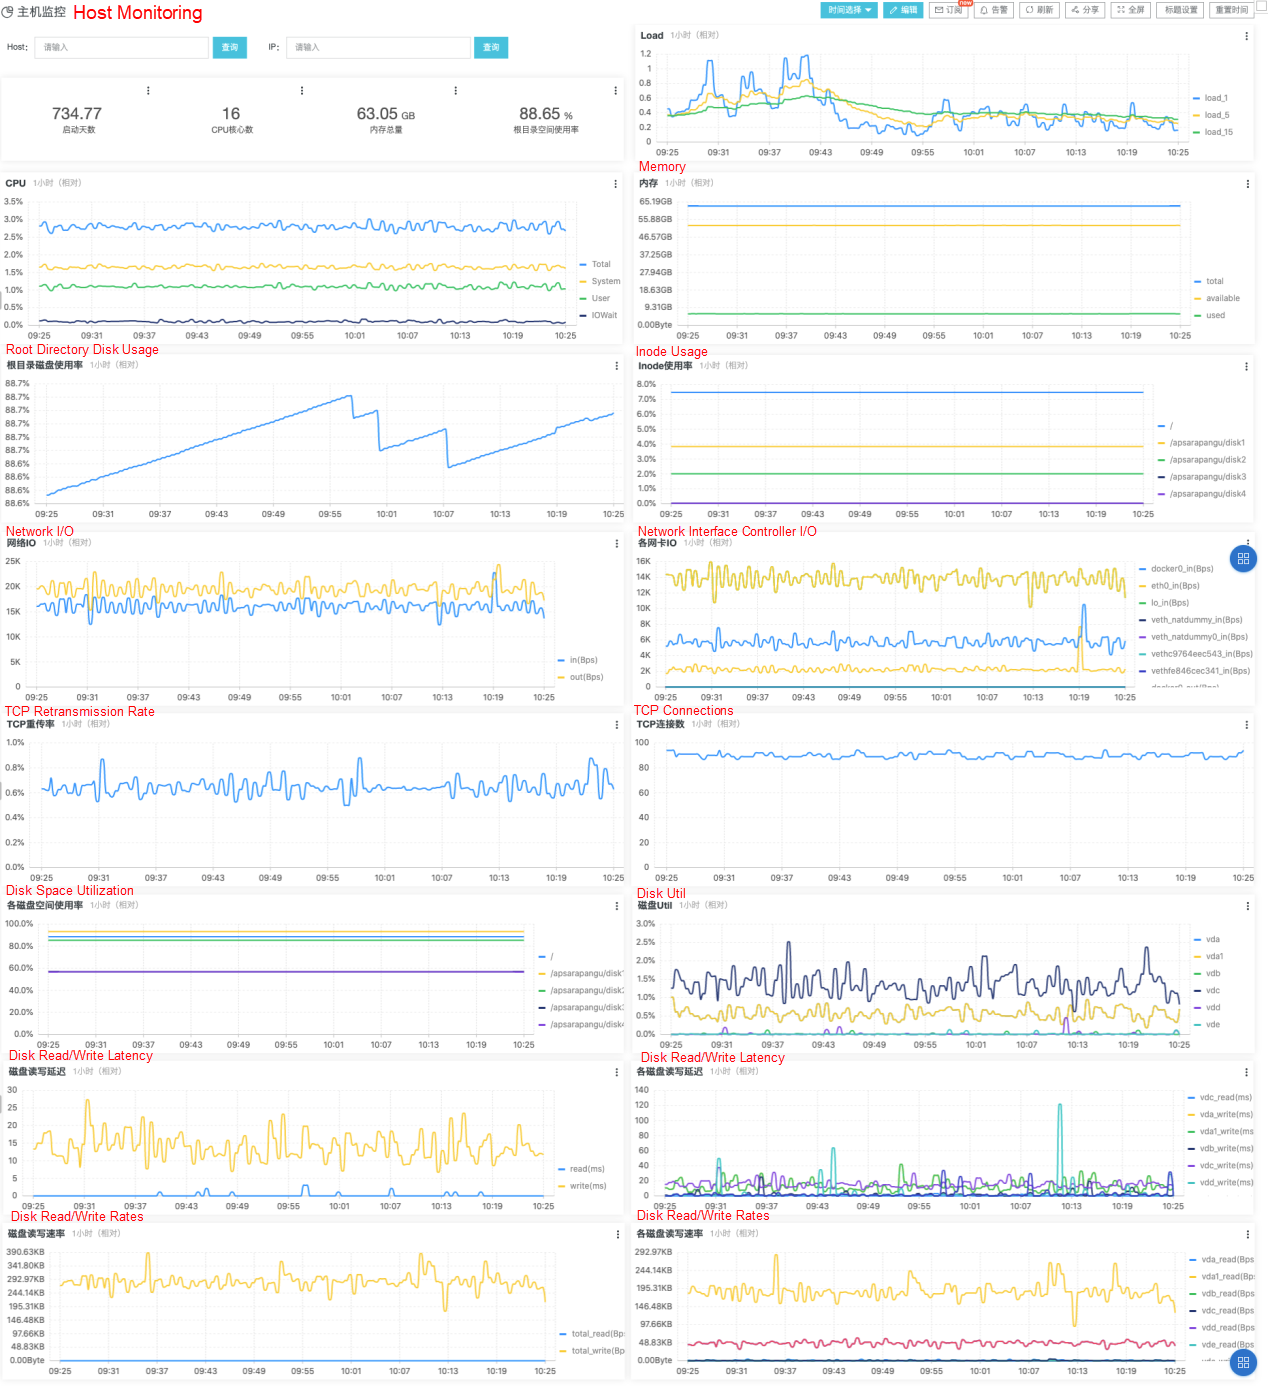
SLS provides multiple visualization features for time series scenarios by default, and supports analysis in the standard SQL and the PromQL + SQL modes. For more information about SLS visualization, see Log Service Visualization Dashboard.
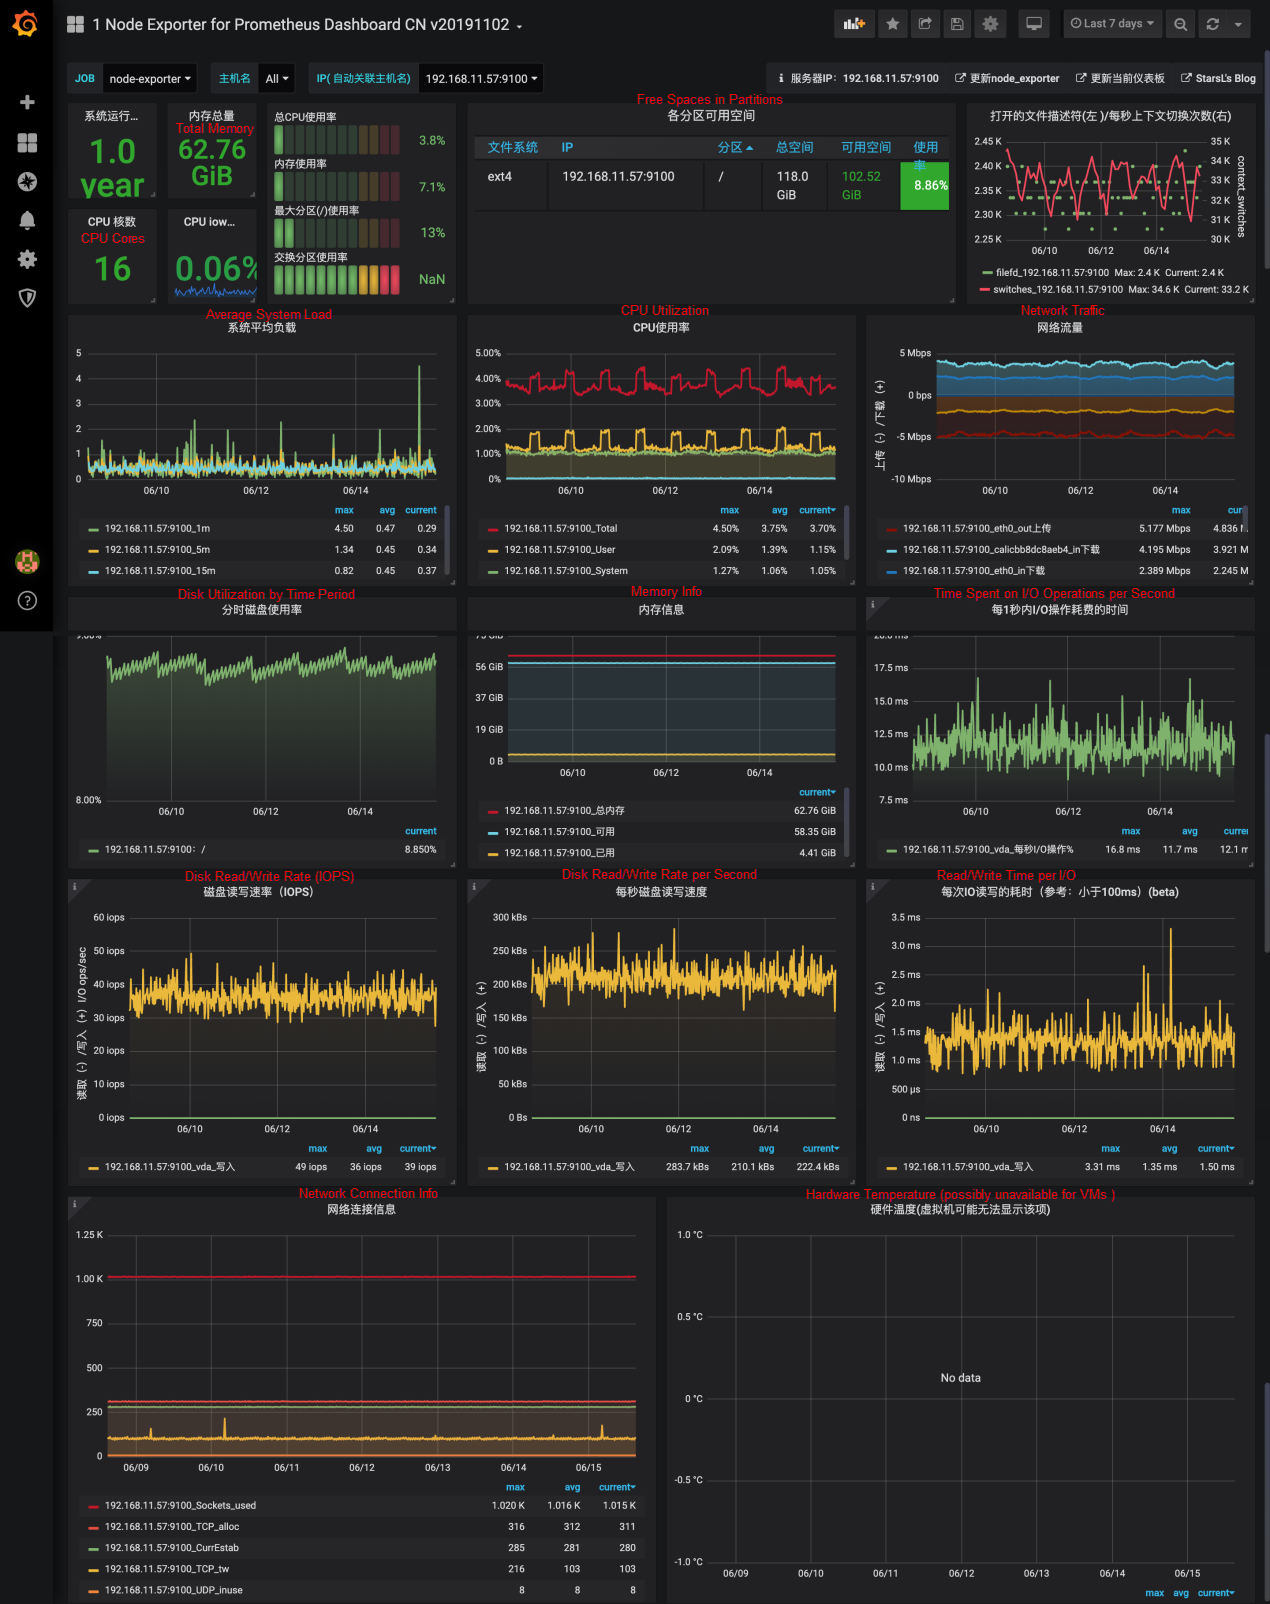
In addition to native visualization features, SLS also supports access to time series data in Grafana by connecting SLS to Grafana as a Prometheus data source. In this way, SLS is compatible with all Prometheus dashboard templates.
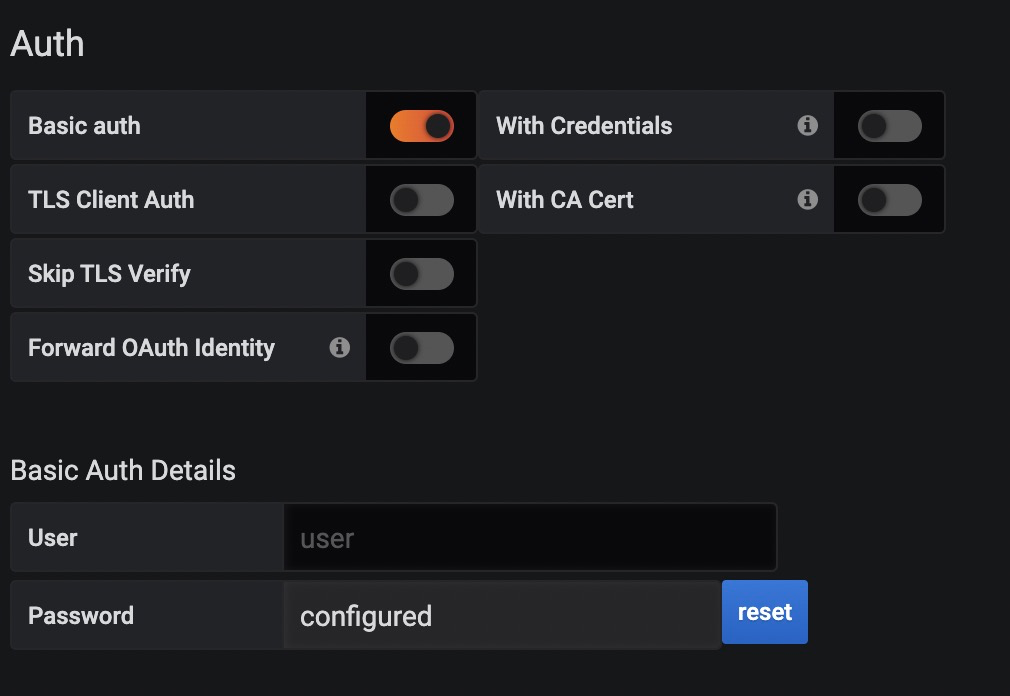
Prometheus has no authentication mode. Unlike Prometheus, the Prometheus interface provided by SLS supports the HTTPS protocol and requires BasicAuth authentication, making data more secure.
Note: Make sure you are using HTTPS.
| Information | Description | Example |
| Entrance (Endpoint) | https://endpoint/prometheus/{project-name}/{logstore-name} |
https://cn-beijing.log.aliyuncs.com/prometheus/sls-prometheus-test/prometheus |
| BasicAuth | The username is AK ID, and the password is AK Secret. The RAM user account AK is recommended to grant only the read-only permission to this project and LogStore. |
1. Add a data source, and select Prometheus.

2. Configure the URL.

Enter the aforementioned URL.
3. Enable Basic Auth, and enter the AK information.
| Information | Description | Example |
| Entrance (URL) |
https://{endpoint}/prometheus/{project-name}/{metricstore-name}Specifically, endpoint is the domain name of the region for SLS. For more information, see Service endpoint. |
https://cn-beijing.log.aliyuncs.com/prometheus/sls-prometheus-test/prometheus |
| BasicAuth | The username is AK ID, and the password is AK Secret. The RAM user account AK is recommended to grant only the read-only permission to this project and MetricsStore. |
12 posts | 1 followers
FollowAlibaba Clouder - April 12, 2021
Alibaba Cloud Native Community - March 30, 2026
DavidZhang - January 15, 2021
Alibaba Cloud Serverless - September 29, 2022
Alibaba Cloud Native Community - December 6, 2022
Alibaba Cloud Native Community - July 26, 2022
12 posts | 1 followers
Follow Simple Log Service
An all-in-one service for log-type data
Learn More Quick BI
A new generation of business Intelligence services on the cloud
Learn More Managed Service for Prometheus
Multi-source metrics are aggregated to monitor the status of your business and services in real time.
Learn More Application Real-Time Monitoring Service
Build business monitoring capabilities with real time response based on frontend monitoring, application monitoring, and custom business monitoring capabilities
Learn MoreMore Posts by DavidZhang