With the development and popularization of microservice technology, complex monolithic applications are now divided into multiple services. Moreover, the continuous disassembly of various application systems has expanded the services and increased the complexity of call relationships between services. Due to the complex nature of call relationships and massive service scale, enhancing the performance of tasks like troubleshooting and optimization has become a challenge for both R&D and O&M staff.
Google published a paper titled "Dapper, A Large-Scale Distributed Systems Tracing Infrastructure" in 2010. The paper proposed the concept of distributed tracing analysis. It states that each request generates a unique ID and passes this ID to the opposite end during cross-instance request, and records each method's start and end time. Finally, this request is connected in series by tracing ID to form a directed acyclic graph. Each node in the graph indicates a method while the relationships in the graph indicate the execution order and relationships of the methods.
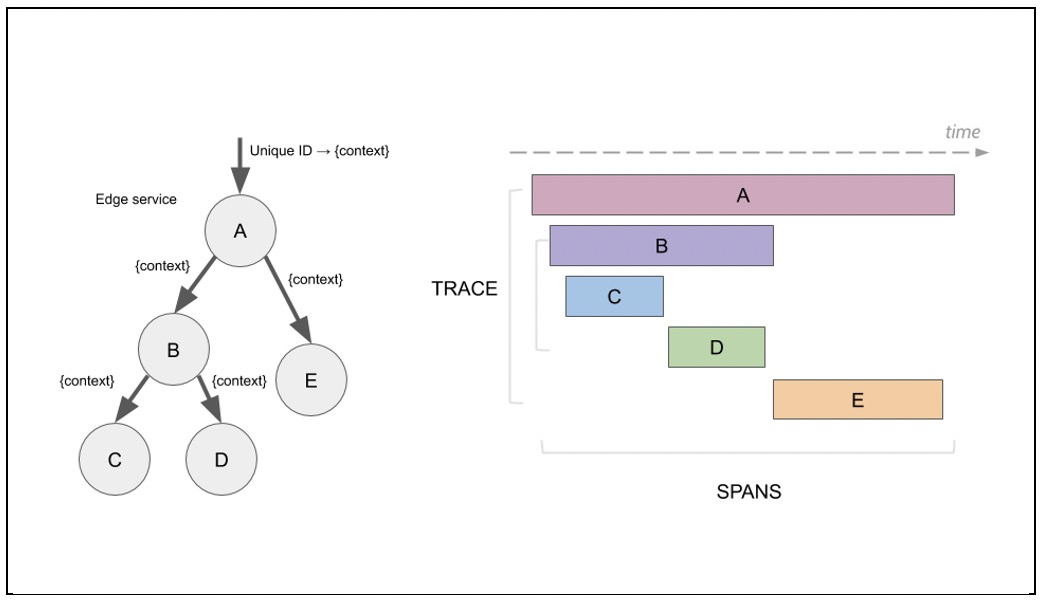
As shown in the figure, the left side indicates the execution process of the subsequent microservice request, whereas the right side indicates the final Trace diagram. With the help of this diagram, developers or O&M staff can clearly view the lifecycle and the path of the request, such as applications, methods, and call relationships from which a request has been traversing. It helps teams to locate business faults and performance bottlenecks quickly. The monitoring system is crucial for rapidly finding and analyzing problems. Many open-source and commercial solutions have emerged, such as Jaeger, Open Telemetry, Apache SkyWalking, Zipkin, etc. APM (Application Performance Monitoring) vendors such as LightStep, AppDynamics, and New Relics also provide reliable monitoring services.
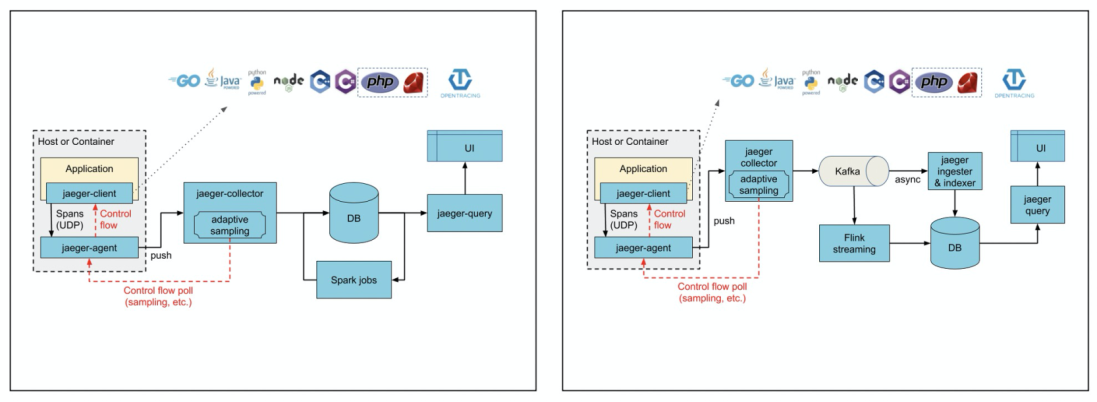
Jaeger is a distributed tracing system developed by Uber. It became open source in April 2017 and was accepted as a CNCF incubation project in September of the same year. In October 2019, it graduated from CNCF and became a top-level CNCF project. The following figure shows the Jaeger architecture. The two architecture diagrams are roughly the same, except that Kafka is added in the second architecture between collector and DB as a buffer to tackle the peak traffic overload. Jaeger supports a variety of backend storage. Currently, the supported data storage includes memory, Badger, Cassandra, Elasticsearch, and gRPC plug-ins.
As an observability/monitoring system component, Jaeger is a critical data source for development and operation staff to locate and discover business system problems. As the Site Reliability Engineer (SRE), we must ensure that monitoring systems live longer than business systems. Monitoring is worthless once the monitoring system is down before the business system. Monitoring is the last barrier to business exception analysis. Compared with other systems, it is more sensitive to high availability and performance.
As an open-source project, Jaeger does not provide evaluation solutions for the deployment scale and solutions that can tell how to ensure the high availability of services. O&M staff needs to give specific deployment solutions based on their experience and research in the business system scale to ensure the high availability of services. It is essential to answer important questions: How to provide high-availability and high-performance back-end services in this situation? Who will provide the last layer of protection for the monitoring system?
First of all, let's analyze the aspects where the Jaeger system's high availability needs to be optimized from the deployment architecture perspective (Here, we take the example of the latest solution in the community as shown on the right side of the above figure):
As compared to the simple deployment of a set of Jaeger, the work mentioned above requires a lot of effort and continuous investment of manpower in subsequent O&M and management of this system. Therefore, the simplest way is to use service-oriented products directly.
The core part of Jaeger's high availability is the Jaeger backend, including Collector, Kafka, Flink, DB, Query, and UI. The best practice is to find a backend system compatible with Jaeger while providing high reliability and performance.
The Trace service released by Alibaba Cloud Log Service (SLS) recently can meet this requirement perfectly. SLS's most prominent features are high performance, elasticity, and O&M-free, allowing users to tackle surging traffic and inaccurate scale assessment. The SLS service provides availability of 99.9% and data reliability of 99.999999999%.
In general, we want to replace Jaeger's backend in two different ways:
The Trace service of SLS provides backend services that are easy to access through various open-source software, unified data models, and performance analysis capabilities for various open-source Tracing Analysis. SLS is fully compatible with the deployment mode of Jaeger. Currently, SLS provides two access methods to meet the preceding two types of requirements:
The native Jaeger access method uses a hybrid mode, with the Jaeger UI as the frontend and SLS as the storage backend. Users accustomed to Jaeger page operations have one more access method to select.

Here are the steps for accessing native Jaeger. For more detailed information about parameter configurations and container deployment methods, see GitHub.
./agent-darwin --collector.host-port=localhost:14267export SPAN_STORAGE_TYPE=aliyun-log-otel && \
./collector-darwin \
--aliyun-log.project=<PROJECT> \
--aliyun-log.endpoint=<ENDPOINT> \
-- aliyun-log.access-key-id=<ACCESS_KEY_ID> \
-- aliyun-log.access-key-secret=<ACCESS_KEY_SECRET> \
-- aliyun-log.span-logstore=<SPAN_LOGSTORE> \
-- aliyun-log.init-resource-flag=falseexport SPAN_STORAGE_TYPE=aliyun-log-otel && \
./query-darwin \
--aliyun-log.project=<PROJECT> \
--aliyun-log.endpoint=<ENDPOINT> \
-- aliyun-log.access-key-id=<ACCESS_KEY_ID> \
-- aliyun-log.access-key-secret=<ACCESS_KEY_SECRET> \
-- aliyun-log.span-logstore=<SPAN_LOGSTORE> \
-- aliyun-log.span-dep-logstore=<SPAN_DEP_LOGSTORE> \
--aliyun-log.init-resource-flag=false \
--query.static-files=./jaeger-ui-build/build/The following table is a detailed description of each parameter:
| Parameter Name | Description |
| PROJECT | Specify the project used to store spans |
| ENDPOINT | Specify the endpoint where the project used to store spans exists. Its format is ${project}.${region-endpoint}${project} is the name of the Log Service project. ${region-endpoint} is the endpoint of the project. You can access Log Service by using an endpoint of the Internet, the classic network,or a VPC. |
| ACCESS_KEY_ID | Your Access Key ID |
| ACCESS_KEY_SECRET | Your Access Key Secret |
| SPAN_LOGSTORE | Specify the Logstore used to store spans. The name is {instance-id}-traces. |
| SPAN_DEP_LOGSTORE | Specify the Logstore used to store service call relationships. The name is {instance-id}-traces-dep. Default value: jaeger-traces-dep. |
The simplified version provides two data access methods: Jaeger direct transmission and Jaeger forwarding method. The direct transmission method is simple to deploy and requires each agent to connect to SLS. The forwarding method supports more advanced features like flow control. We will talk about the two methods respectively in this section.
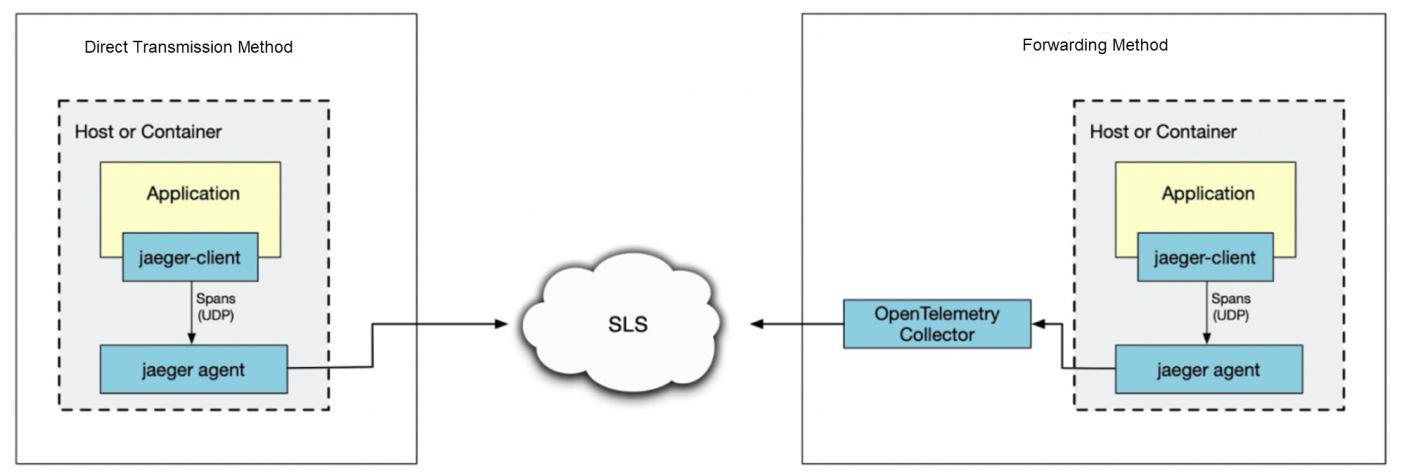
The direct transmission is to directly send trace to the SLS backend by configuring the SLS address on the jaeger agent end. The biggest advantage of this method is that you don't have to deploy the Jaeger Collector instance. The following is the startup parameter command in direct transmission.
./jaeger-agent --reporter.grpc.host-port=${ENDPOINT} --reporter.grpc.tls.enabled=true --agent.tags=sls.otel.project=${PROJECT},sls.otel.instanceid=${INSTANCE},sls.otel.akid=${ACCESS_KEY_ID},sls.otel.aksecret=${ACCESS_SECRET}The following table is a detailed description of each parameter:
| Parameter | Description |
| ACCESS_KEY_ID | The AccessKey ID of your Alibaba Cloud account. We recommend that you use the AccessKey pair of a RAM user that has only the write permissions on the Log Service project. An AccessKey pair consists of an AccessKey ID and an AccessKey secret. |
| ACCESS_SECRET | The AccessKey secret of your Alibaba Cloud account. We recommend that you use the AccessKey pair of a RAM user that has only the write permissions on the Log Service project. |
| PROJECT | The name of the Log Service project. |
| INSTANCE | The name of the trace instance. |
| ENDPOINT | The access address, in the format of ${project}.${region-endpoint}:10010. ${project} is the name of the Log Service project. ${region-endpoint} is actually the endpoint of the Log Service project. You can access Log Service by using the public or internal endpoint of the project. An internal endpoint is used for access over the classic network or a VPC. |
The forwarding method uses the OpenTelemetry Collector to collect the incoming span data from the jaeger-agent and sends the trace data to the backend. Here are the deployment steps for the forwarding method:
OpenTelemetry Collector download address: https://github.com/open-telemetry/opentelemetry-collector-contrib/releases/tag/v0.30.0
Add the configuration file config.yaml and modify the configuration content based on the actual situation. For detailed parameter descriptions in the configuration, see the parameter explanation in the direct transmission method above.
receivers:
 jaeger:
   protocols:
     grpc:
       endpoint: 0.0.0.0:6831
     thrift_binary:
       endpoint: 0.0.0.0:6832
     thrift_compact:
       endpoint: 0.0.0.0:6833
     thrift_http:
       endpoint: 0.0.0.0:6834
exporters:
 logging/detail:
   loglevel: debug
 alibabacloud_logservice/sls-trace:
   endpoint: "{ENDPOINT}"
   project: "{PROJECT}"
   logstore: "{LOGSTORE}"
   access_key_id: "{ACCESS_KEY_ID}"
   access_key_secret: "{ACCESS_KEY_SECRET}"

service:
 pipelines:
   traces:
     receivers: [jaeger]
     exporters: [alibabacloud_logservice/sls-trace]
     # for debug
     #exporters: [logging/detail,alibabacloud_logservice/sls-trace]
Run the following command to start Collector:
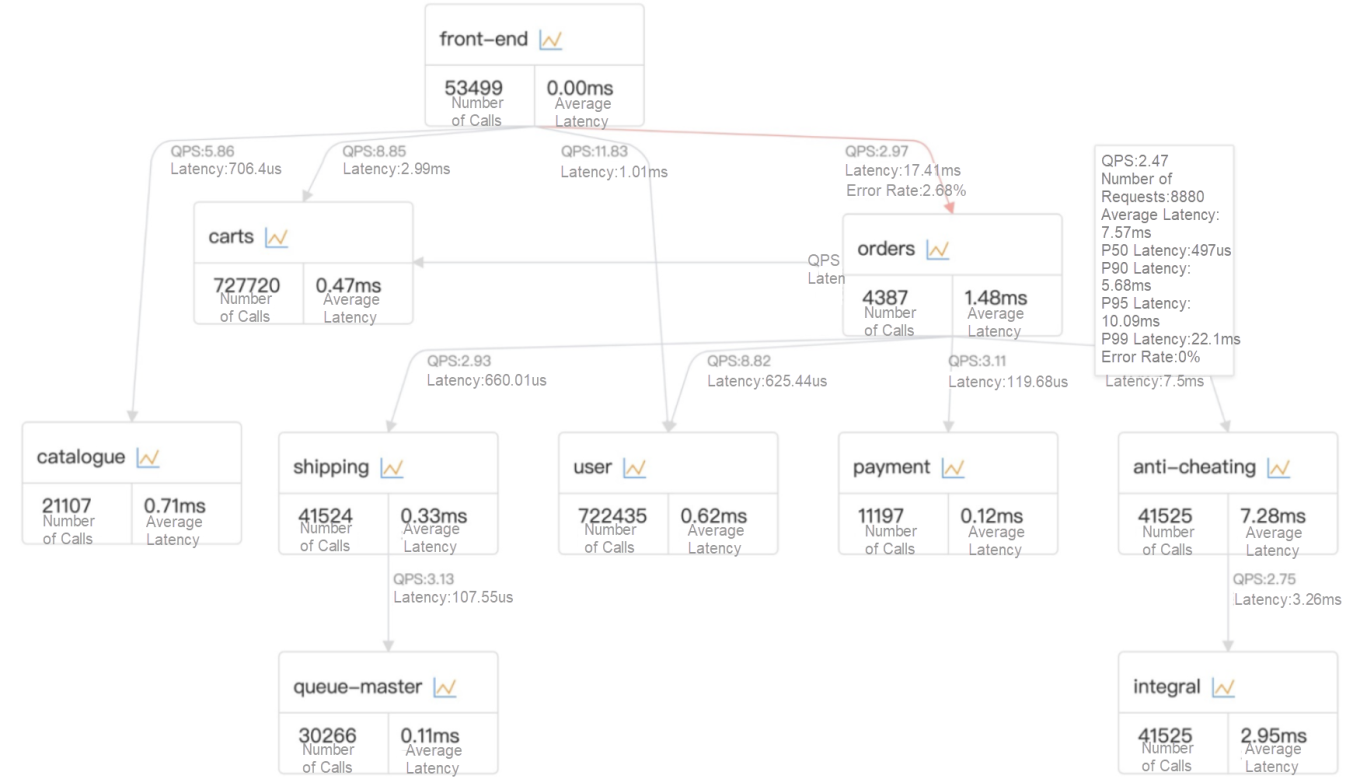
./otelcontribcol_linux_amd64 --config="PATH/TO/config.yaml"Trace dependency analysis can automatically calculate and generate the dependency topology of traces. Compared with Jaeger, it adds a lot of metric calculations, including QPS, error rate, average latency, and PXX latency.
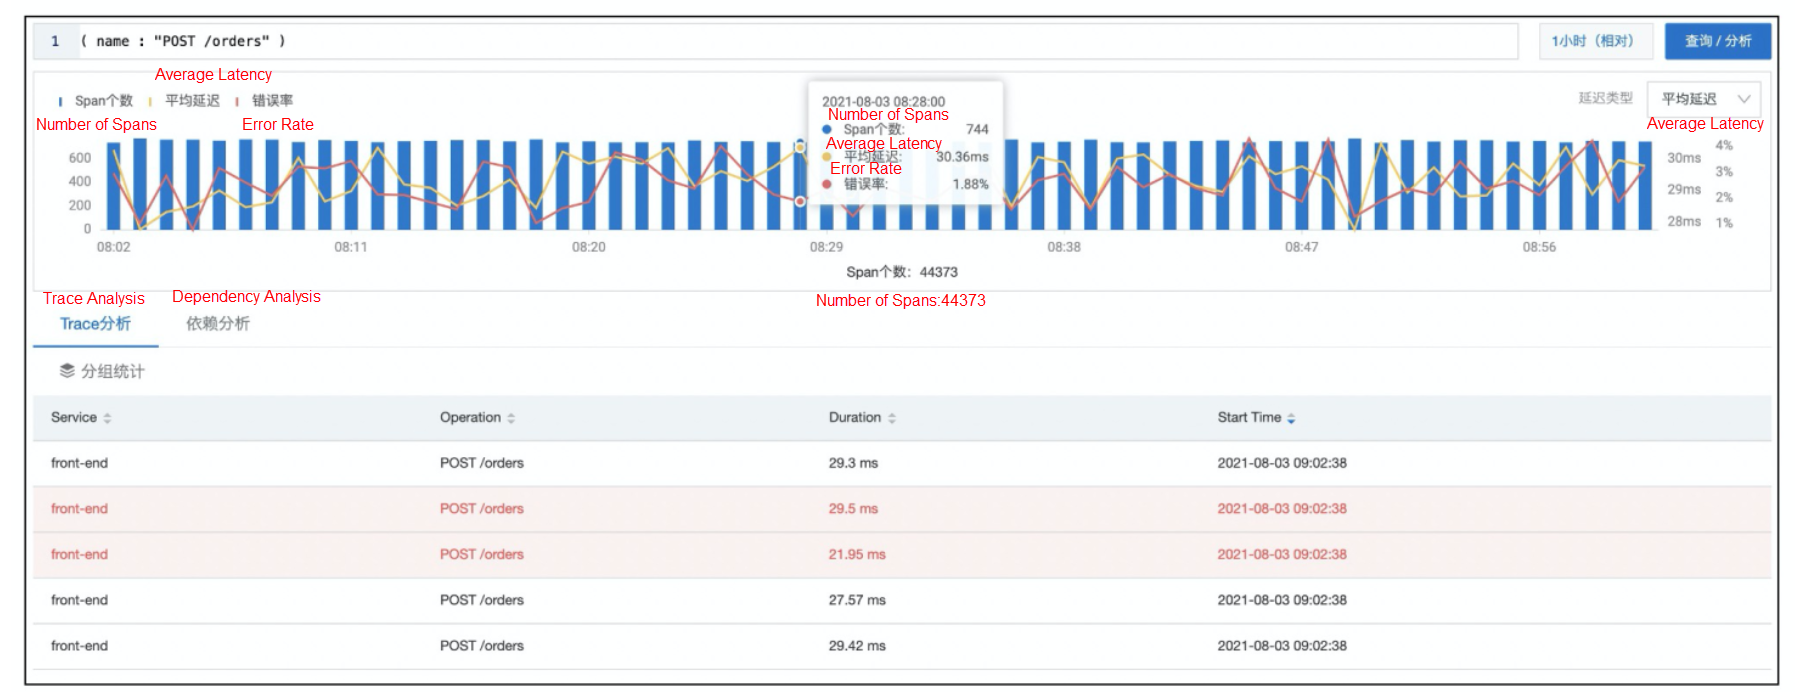
The Trace list displays the overview information of the uploaded span. In addition, the search box supports combination search based on the attributes, tags, latency of the span, and other conditions.
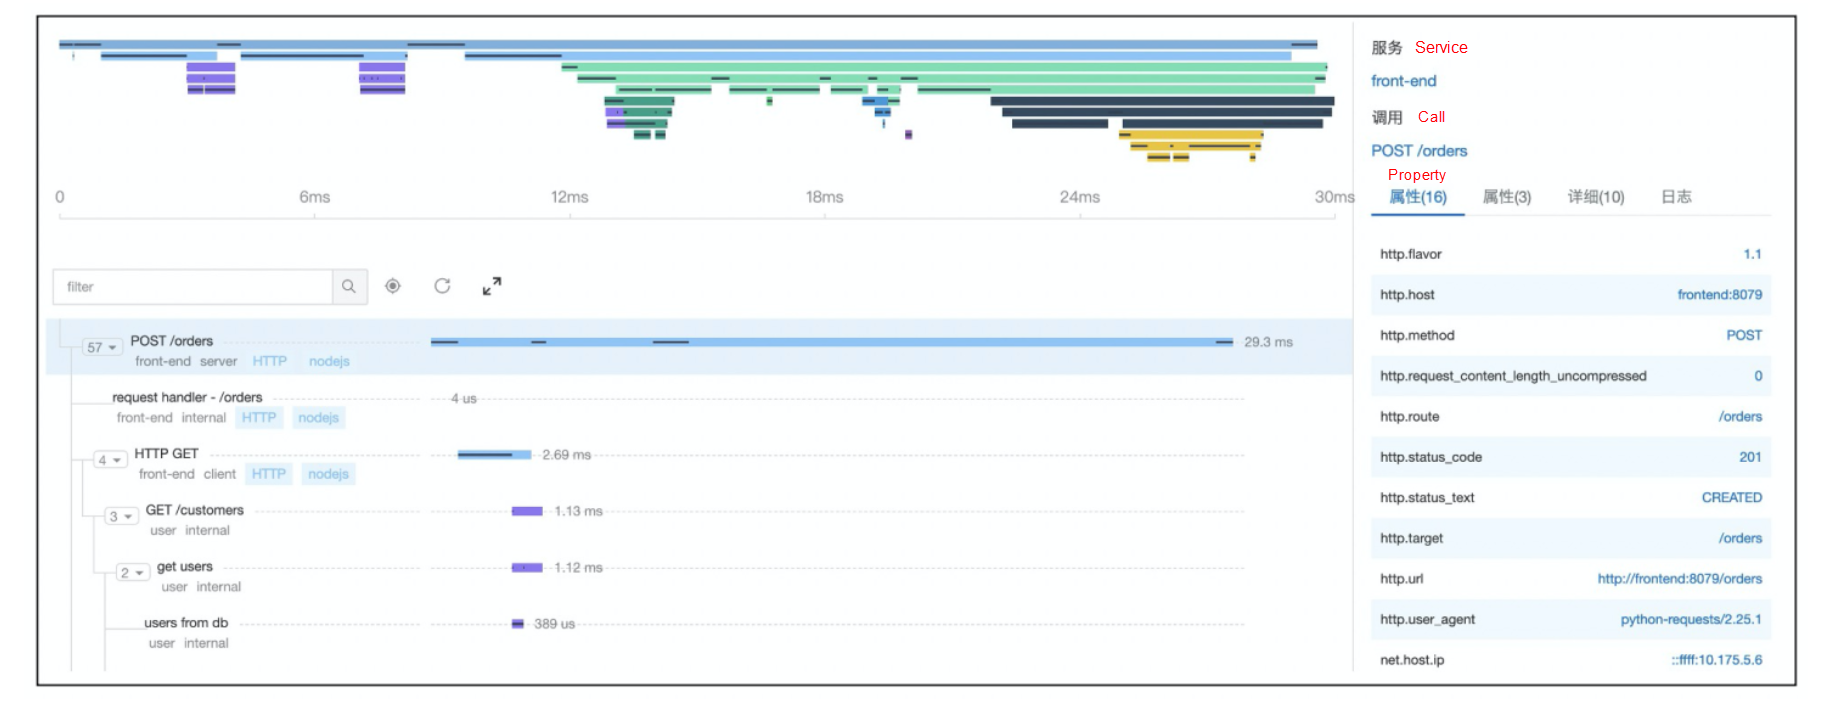
The Trace detail page displays the execution duration, call relationships, and span information of each method.
Both the preceding methods can complete the access and use of Jaeger Trace data. Let's summarize some similarities and differences between the two methods.
| Native Jaeger Access Method | Simplified Jaeger Access Method | |
| Reliability | Strong, need to ensure the stability of Query UI services | Strong |
| Data Processing Capability | Strong | Strong |
| Deployment Complexity | Relatively low, need to deploy an additional set of Query UI service | Low, no need to deploy any components except access |
| Capability to Locate and Detect Faults | Average (can also use the Trace UI provided by SLS) • Support simple query capabilities • Topology diagram discovery |
Strong • Support combination query of multiple conditions such as tags, attributes, and delay time based on Span • Support service and span-level metrics • Automatic topology diagram discovery |
| User Habits | Retain Jaeger's pages, no need to adjust user habits | Need to adjust user habits |
Overall, the simplified version of jaeger access works better. If we look at it as a monitoring system, it helps users quickly locate faults. By looking at service metrics and span level and using multi-condition query capability based on Span attributes, we can quickly filter and locate abnormal services, spans, and traces.
As a representative implementation of the OpenTracing protocol, Jaeger is also a popular top-level project in CNCF. However, suppose your company is building a new trace system. In that case, it is not recommended to use the Jaeger solution because OpenTracing has recently merged with OpenCensus to form OpenTelemetry, and the unified standard for the subsequent trace is OpenTelemetry. Therefore, we recommend that you use the native Trace of OpenTelemetry.
12 posts | 1 followers
FollowDavidZhang - June 14, 2022
Alibaba Cloud Native Community - August 30, 2022
Alibaba Cloud Native - August 14, 2024
DavidZhang - January 15, 2021
Alibaba Cloud Storage - June 19, 2019
Alibaba Cloud Native Community - February 8, 2025
12 posts | 1 followers
Follow Managed Service for Grafana
Managed Service for Grafana displays a large amount of data in real time to provide an overview of business and O&M monitoring.
Learn More Bastionhost
A unified, efficient, and secure platform that provides cloud-based O&M, access control, and operation audit.
Learn More Simple Log Service
An all-in-one service for log-type data
Learn More Data Lake Storage Solution
Build a Data Lake with Alibaba Cloud Object Storage Service (OSS) with 99.9999999999% (12 9s) availability, 99.995% SLA, and high scalability
Learn MoreMore Posts by DavidZhang