Monitoring has always been the core component of IT systems. It is responsible for discovering and assisting in positioning problems. Whether it is traditional O&M, SRE, or DevOps, developers need to pay attention to the monitoring system and participate in its construction and optimization. From the mainframe operating system and Linux basic indicators initially, the monitoring system began to appear and gradually evolved. Now, there are over hundreds of monitoring systems that can be divided into different categories from different points of view, such as:
There are many options for the construction of a monitoring system platform for internal use, whether it is self-built with open-source solutions or commercial SaaS products. However, irrespective of whether it is an open-source solution or a commercial SaaS product, in the actual implementation, we need to consider how to pass the data to the monitoring platform or how the monitoring platform can obtain the data. This involves the selection of data acquisition methods: Pull or Push.

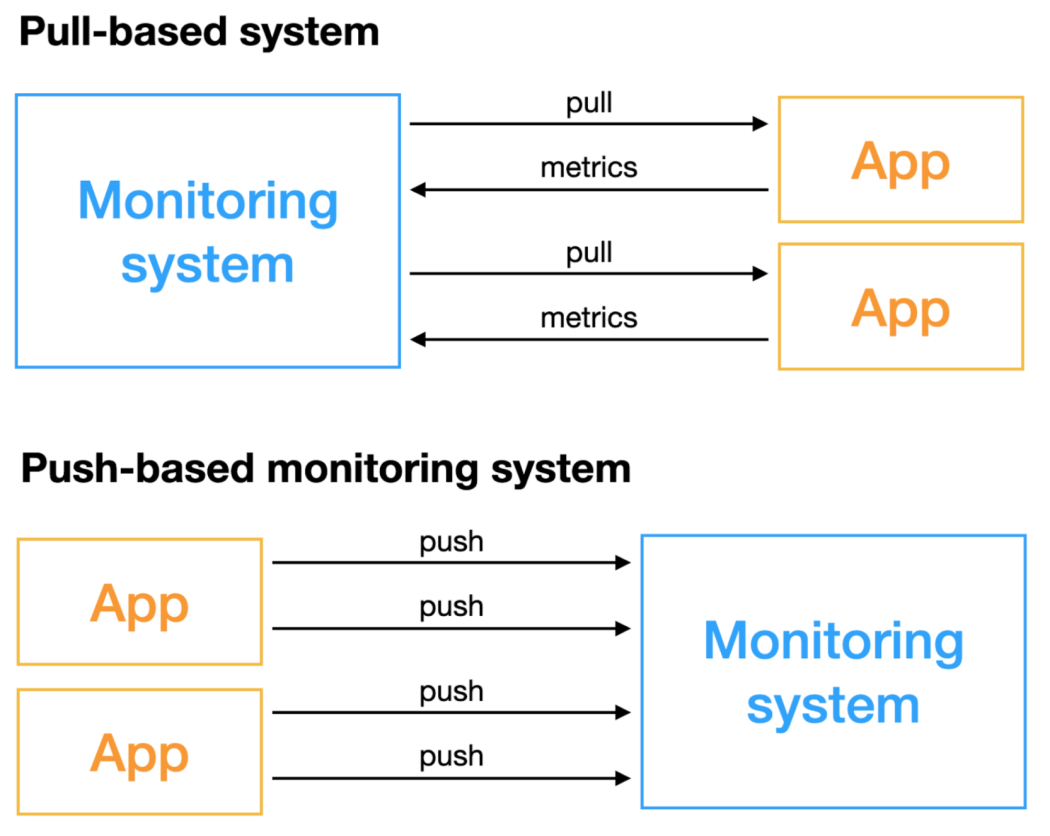
The Pull-based monitoring system, as the name implies, is a monitoring system that actively obtains indicators, and the objects that require monitoring need to have the capability to be accessed remotely. Push-based monitoring systems do not actively obtain data, but the monitored objects actively push indicators. There are differences between the two methods in many aspects. For the construction and selection of monitoring systems, we must understand the advantages and disadvantages of these two methods in advance and choose the appropriate scheme for implementation. Otherwise, the subsequent maintenance cost of ensuring the stability of the monitoring system and the cost of deployment and O&M will be huge.
The following table summarizes the different aspects of Pull and Push monitoring systems for subsequent discussion. The details will be elaborated on later.


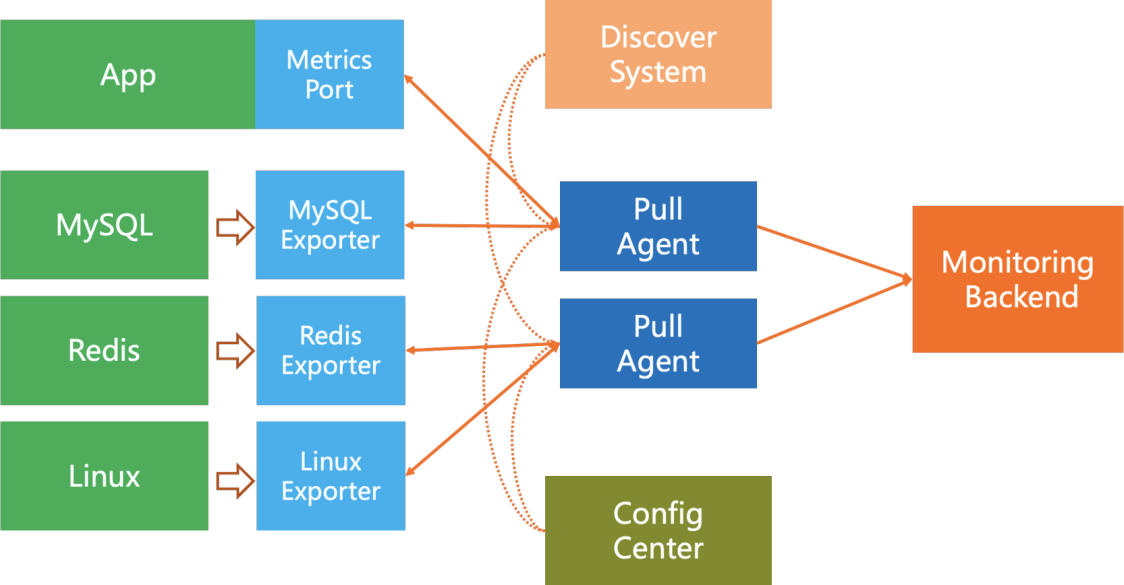
As shown in the figure above, the core of the Pull model's data acquisition is the Pull module, which is generally deployed together with the monitoring backend, such as Prometheus. The core components include:
The Push model is simple, and can be described as follows.
The Pull model's deployment method is too complicated for monitoring middleware and other systems, and the maintenance cost is also high. While Push mode is relatively convenient, the application's cost to provide a Metrics port or proactively push for deployment is almost the same.

In terms of scalability, Push data acquisition is natively distributed. When the monitoring backend capability supports, it is scalable horizontally without limit. In contrast, the Pull scalability method is more troublesome and requires:
As you might have seen, there are still some problems with this distributed method:
Survivability is the first and most basic work required for monitoring. In the Pull mode, monitoring target survivability is relatively simple to detect. At the center of Pull, we can ascertain whether we can request the target indicators. If a failure occurs, we will get notifications for simple errors such as network timeout and peer rejection of connection.
The Push mode is more troublesome. If the application does not report, it may be an application breakdown, a network problem, or the application may be migrated to other nodes. Since the Pull module can perform filter interaction with service discovery in real-time and the Push mode cannot do this, we can only know the specific cause of failure after the server interacts with service discovery.
The concept of data completeness is rather crucial in the large-scale monitoring system. For example, when monitoring the QPS of a transaction application with 1,000 copies, we need to combine this indicator with 1,000 pieces of data. Suppose, in the absence of data completeness; the QPS is configured to trigger an alarm with a 2% reduction. In such a scenario, when the data reported by more than 20 copies is delayed by several seconds due to network fluctuations, a false alarm will be triggered. Therefore, it is necessary to consider the data completeness while configuring the alarm.
The calculation of data completeness also depends on the service discovery module. The Pull method is to pull data one round after another, so the data is complete after one round of pull. Even if some pull fails, the percentage of incomplete data is known.
While in the Push mode, each Agent and application proactively performs Push. The Push interval and network latency of each client are different. According to the historical situation, the server needs to calculate the data completeness, bringing huge costs.
In actual scenarios, there are many short-lifecycle/serverless applications. In particular, in cost-friendly cases, we will use a large number of jobs, elastic instances, and serverless applications. For example, an elastic computing instance is started after a rendering task arrives. On completion, it will be immediately destroyed and released. The situation is the same in machine learning training jobs, event-driven serverless workflows, and jobs that are executed regularly (such as resource cleanup, capacity checks, and security scans). These applications usually have a short life cycle (maybe within seconds or milliseconds). Pull's regular model is difficult to monitor. Generally, we need to use Push to make applications proactively push monitoring data.
For managing such short-life cycle applications, pure Pull systems will provide an intermediate layer (such as Prometheus Push Gateway) to accept proactive Push from applications and then provide Pull ports to the monitoring system. But this leads to the management and O&M costs of an additional intermediate layer. Since this mode is achieved by Pull simulating Push, the reporting latency will increase, and these metrics that disappear immediately need to be cleaned up in time.
In terms of flexibility, the Pull mode has the advantage. We can configure the indicators we want in the Pull module and do some simple calculations and secondary processing on the indicators. However, this advantage is not overwhelming. Push SDK/Agent can also configure these parameters. With the help of the configuration center, configuration management is simple.
The coupling degree between the Pull model and the backend is low. It only needs to provide an interface that the backend understands. It is unnecessary to know which backend is connected and which indicators the backend needs. The division of labor is clear. Application developers only need to expose indicators of applications, and Site Reliability Engineer (SRE) can obtain these indicators. The Push model has a higher coupling degree. The application needs to configure the backend address and authentication information. However, by relying on the local Push Agent, the application only needs to push the local address, which will not bring a huge cost.
In terms of overall cost, there is a slight difference between the two approaches, but considering the cost distribution:
In terms of O&M, the cost of the Pull mode is higher. Pull mode's components responsible for O&M include various exporters, service discovery, Pull Agent, and monitoring backend. While the Push mode only needs to perform O&M for Push Agent, monitoring backend, and configuration center (optional, deployment is generally completed together with monitoring backend).
One thing to note here is that in the Pull mode, since the server proactively initiates requests to the client, cross-cluster connectivity and network protection ACL on the application side need to be considered on the network. Compared with Push, the network connectivity is simple, and it only requires the server to provide a domain name/VIP that each node can access.
Among the current open-source solutions, the representative of the Pull pattern is the Prometheus family solution (referred to as family mainly because the default single point's Prometheus extensibility is limited. Prometheus has many distributed solutions in the technical community, such as Thanos, VictoriaMetrics, and Cortex). TICK (namely Telegraf, InfluxDB, Chronograf, Kapacitor) solution of InfluxDB represents the Push pattern. Both solutions have advantages and disadvantages. Against the backdrop of cloud-native, Prometheus begins to thrive with the popularity of CNCF and Kubernetes. Therefore, much open-source software has already started to provide Pull ports in Prometheus mode. However, many systems have had difficulty giving Pull ports since the beginning of their design. The Push Agent method is more appropriate for monitoring these systems.
There has been no conclusion about whether the application should use Pull or Push. The specific selection still needs to be based on the actual scenarios within the company. For example, if the network cluster of the company is very complex, it is simple to use Push. Many applications with a short life cycle need to use Push. Mobile applications can only use Push. The system itself uses Consul for service discovery. It is easy to implement after exposing the Pull port.
Therefore, for the monitoring system within the company, having the capabilities of both Pull and Push is the optimal solution:
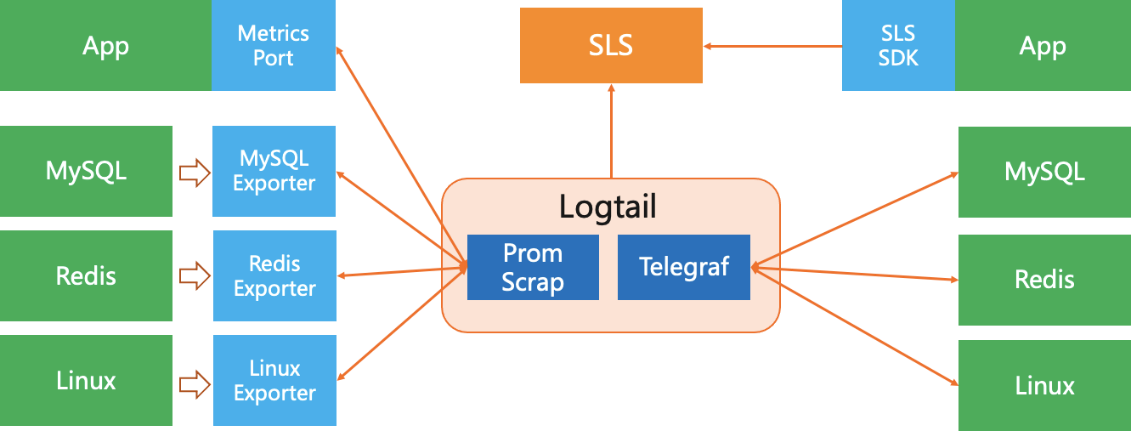
Alibaba Cloud Log Service (SLS) supports unified storage and log analysis, time-series monitoring, and distributed tracing analysis. The time series monitoring solution is compatible with the format standards of Prometheus and provides the standard PromQL grammar. Hundreds of thousands of SLS users have various application scenarios. It is impossible to use Pull or Push alone to meet all customer needs. Therefore, SLS does not select only Pull or Push but is compatible with both Pull and Push models. In addition, for open source communities and agents, SLS's strategy is to be compatible with the open-source ecosystem rather than creating a closed ecosystem.

Compared with Pull Agents such as VMAgent, Prometheus, and native Telegraf, SLS provides the most urgent agent configuration center and monitoring capabilities. SLS can manage the collection configuration of each agent and monitor the running status of these agents on the server, minimizing the O&M management costs.
Therefore, using SLS for building monitoring solution will be very simple in practice. We just need to take the following steps:
This article introduces the Pull or Push selection in the monitoring system. The author compared Pull and Push from various aspects based on several years of practical experience accumulated in multiple customer scenarios. It would be helpful in the monitoring system construction process. We would like to hear your thoughts and queries on this topic.
References
Using Log Service Trace to Implement a Reliable Deployment Solution for Jaeger
12 posts | 1 followers
FollowAlibaba Cloud Native Community - February 2, 2026
Alibaba Cloud Storage - February 27, 2020
Alibaba Cloud Native Community - May 23, 2023
Alibaba Clouder - July 31, 2019
Alibaba Cloud Storage - May 8, 2019
Farah Abdou - February 5, 2026
12 posts | 1 followers
Follow Managed Service for Grafana
Managed Service for Grafana displays a large amount of data in real time to provide an overview of business and O&M monitoring.
Learn More Simple Log Service
An all-in-one service for log-type data
Learn More Bastionhost
A unified, efficient, and secure platform that provides cloud-based O&M, access control, and operation audit.
Learn More Managed Service for Prometheus
Multi-source metrics are aggregated to monitor the status of your business and services in real time.
Learn MoreMore Posts by DavidZhang