By Yihao Zhang, Head of Message Queue in Xiaohongshu

The following figure shows the overall scale of RocketMQ and Kafka. The peak TPS 8000 w/s generally occurs after work at night. The write volume reaches 50GB/s, 2-3PB of data is added every day, and the number of nodes is over 1200.

Although RocketMQ and Kafka have similar performances, they are different in use. The rich business features of RocketMQ make it suitable for online business scenarios, while the high throughput of Kafka makes it inclined for offline and near-line business. There will be cross-use in practical applications. Sometimes online businesses will use Kafka to decouple, and some stream processing data will use RocketMQ to store.
The following figure shows the overall business architecture. The content of business logs and APP user behavior dots are sent to Kafka. Database incremental logs, online business, and online data exchange are sent to RocketMQ. Some of the data in Kafka and RocketMQ flows into Flink to build real-time warehouses, offline data warehouses, and some data products (such as reports and monitoring). Another part of the data in RocketMQ is used for the asynchronous decoupling of online business apps.
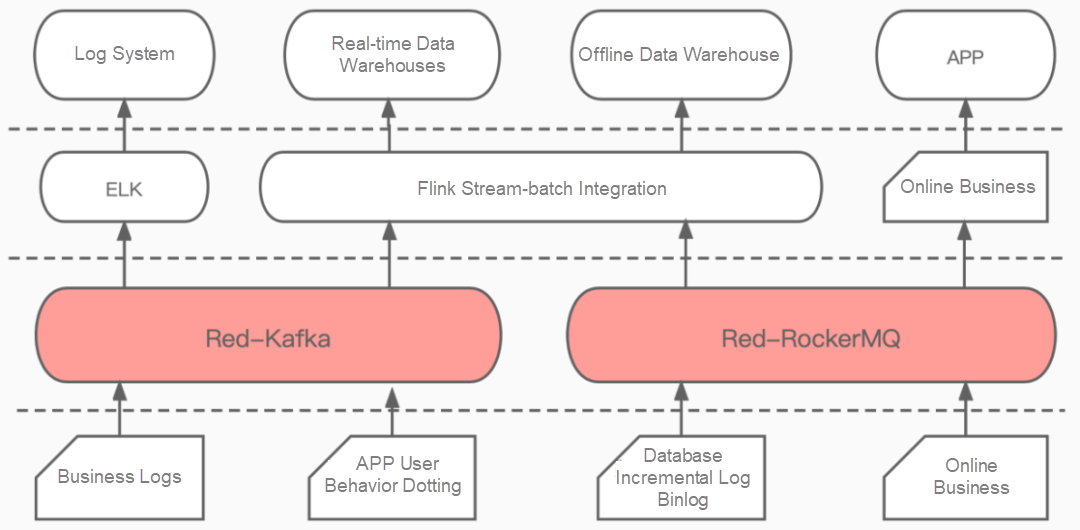
Message Queue Business Architecture
1) Background
The overall convergence message component of Xiaohongshu was launched late. The biggest goal of the company's technical architecture is to improve system stability.
2) Challenges
The existing message components are used often, but there is no stability guarantee. Also, they face dilemmas with manpower shortages, tight time, and a lack of in-depth understanding of MQ principles.
3) Strategies
Monitoring and enhancing the observability of the cluster is the most efficient way to understand its health.
In addition to monitoring alerts, we have done the following transformation work in stability governance:
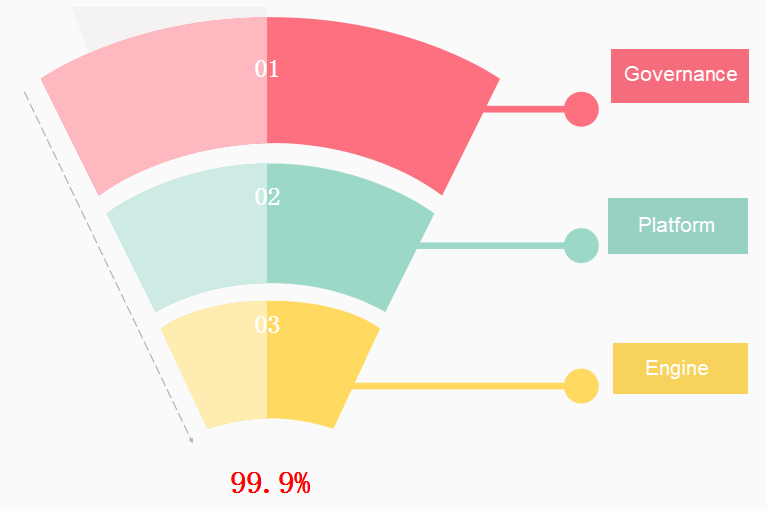
1) Engine: Resource isolation, new monitoring and dotting.
2) Platform: Work order review, authority control, and business traceability
3) Governance: For the construction of cluster visualization capabilities and cluster O&M capabilities
The following figure shows the message queue architecture built on Prometheus Grafana:

Message Queue Monitoring Architecture
The figure contains three monitoring dimensions: hardware, service, and business. Over 150 items of monitoring metrics are collected cumulatively.
How can we define the monitoring metrics of these three dimensions?
1) Hardware: It mainly includes network bandwidth, CPU utilization, disk capacity/IO, TCP packet loss/latency, and other resource metrics.
2) Service: It mainly refers to the metrics of running status, such as downtime monitoring, JVM metrics, read and write latency, request queue, etc.
3) Business: It refers to user-oriented metrics concerning customers, such as consumption latency/backlog, QPS, topic throughput, Offset, etc.
Since the company internally stipulates that a node can only use one port for Prometheus, and most of the monitoring metrics are collected separately, the metric aggregation service (MAS) is designed to bring all the metrics together while adding some metadata to help further troubleshoot the problem. MAS is equivalent to a proxy layer of metric, which can be added according to the actual situation.
The following figure lists some alert information that occurred when the monitoring system was first established. At that time, there were about 600-700 alerts every day. The alert problems were varied and could not be handled at all, resulting in a useless monitoring system being.
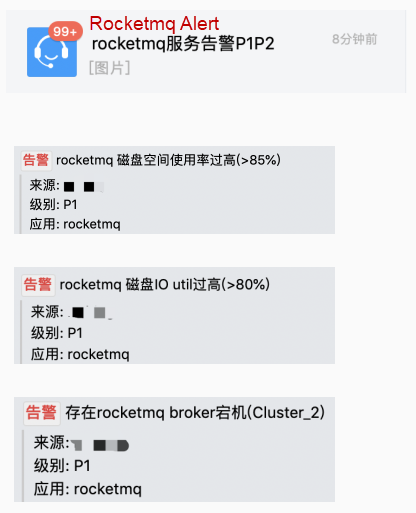

Given the situation, we put quality before quantity in terms of monitoring. There is no difference between too many alerts and no alerts. According to this principle, a series of strategies have been formulated:
According to our experience, there will be no alerts such as service unavailable in the later stage. Most of the alerts are early warnings. If the early warning can be intervened in time, it can be ensured that the problem can be solved before the problem is expanded further.
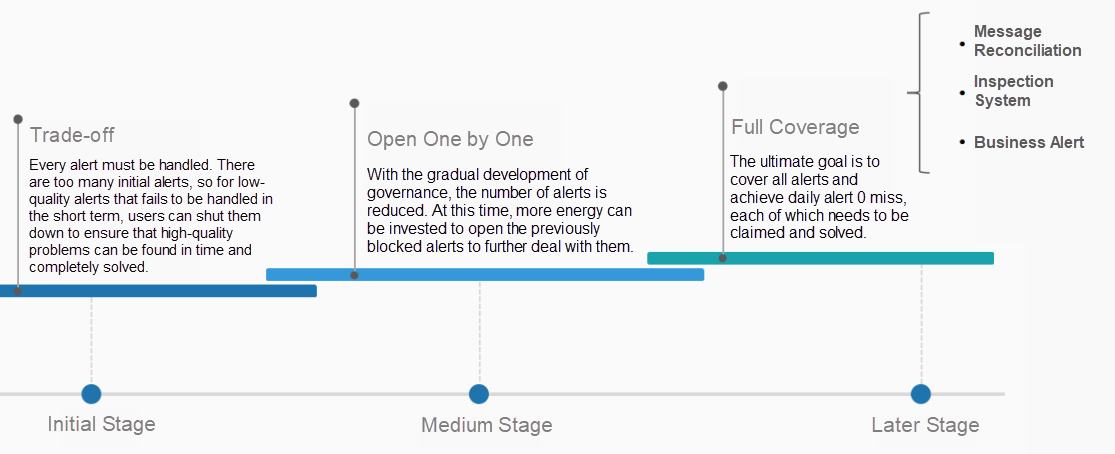
Alert Processing Phased Policy
RocketMQ services and business metrics monitoring are based on open-source RocketMQ-exporter to solve problems (such as metrics leakage and partial metric collection deviation).
Here are two important transformations:
Cause: As shown in the following figure, every time a new client is connected, the port value will increase. Due to the failure to clean up the offline client metrics in time in the exporter implementation, the client port continues to increase, resulting in system alerts.
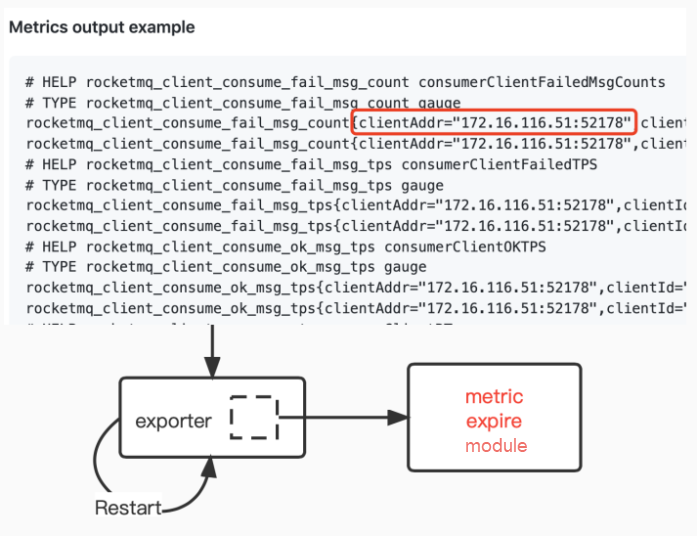
Improvement: Add the metric expire module to the exporter
Result: The time taken by the curl interface is reduced to two seconds.
Cause: Export only provides the rocketmq_group_diff of the group dimension. If there is no broker dimension, an additional calculation is required.
Improvement: Add computational logic to the broker and calculate the lag first
Result: As shown in the following figure, the message backlog value is restored to a stable value from the jitter of 6K.

Improvement: Add a metric to calculate the maximum value to the broker in five minutes
Result:
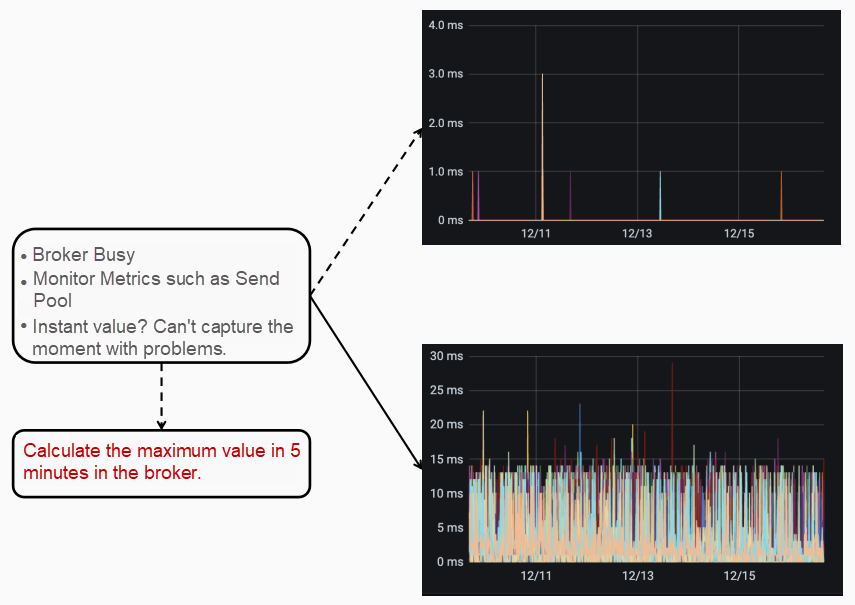
Improvement: Optimize to five minutes and P99/P999 equal quartiles
Result: The accurate message writing time is obtained.

There is a difference between the inspection system and the monitoring system. The monitoring system is a response to instantaneous problems, with fast change. It needs to be discovered and processed in time, and the presentation is relatively fixed. The inspection system is long-term work supervision. Changes are less for the static environment and configuration, and the presentation form is free.
As governance continues, how can a cluster be confirmed to be healthy?
1) Deploy clusters in strict accordance with the deployment standards, including hardware configurations, running parameters, and zones. Regularly inspect all clusters and produce reports that reflect the cluster status.
2) A total of over 20 items of core standards have been formulated, and the inspection results are presented in the form of tables, as shown in the following table:


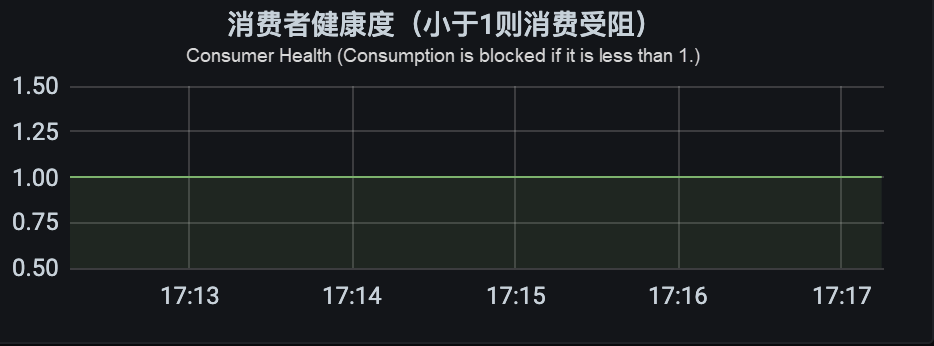
3) Since there are too many metrics to judge the problem, the cluster health score system is set. Based on the idea that the availability of the cluster can only be reflected by a unique metric, a weight is set for each metric. The final score determines whether the cluster has problems, as shown in the following figure:

When designing alerts, there will be some unconsidered alert items. The solution here is a message reconciliation system, which can effectively monitor message latency, loss, and cluster health.
The advantage of the message reconciliation system is that it provides end-to-end monitoring, including multiple monitoring effects. Its self-driving force can replace the alert items that have not been considered, and the discovery and location of faults are independent.
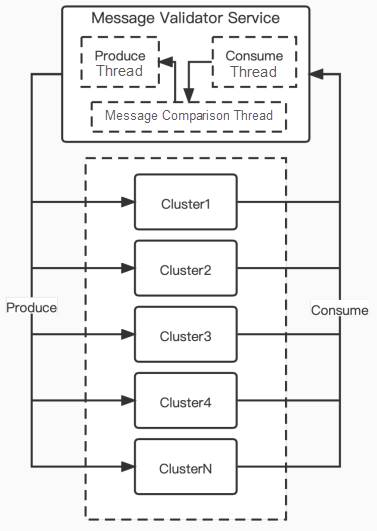
Message Reconciliation Monitoring System
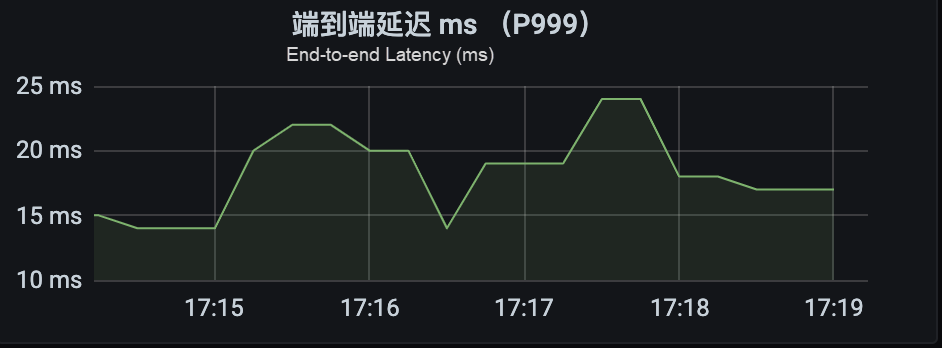

The corresponding Kafka Monitor component is provided in the Kafka community. We transform this component into a service to provide the ability to automatically add new cluster monitoring to reduce the pressure on O&M.
The construction of O&M capability is achieved through automation. Its fundamental purpose is to release manpower.
The following figure shows a topic migration tool that is transformed from RocketMQ and Kafka.
1) RocketMQ
2) Kafka
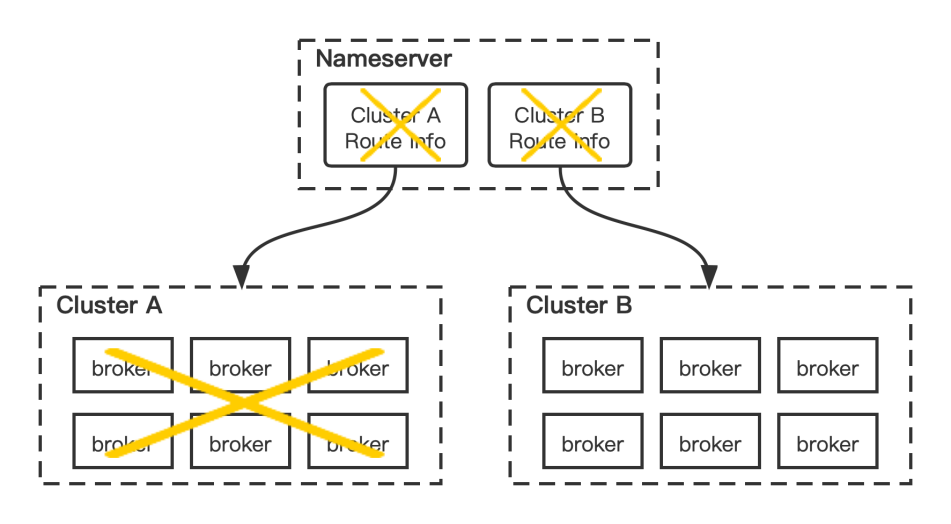
Topic Migration Tool
The overall cloud-native of the message field has deepened in recent years. For example, RocketMQ 5.0 has introduced the storage separation design and raft mode. Another example is Kafka 3.0 has introduced the tiered storage mode and raft mode. The newly emerged Pulsar has begun to adopt cloud-native architecture in recent years. In the future, functional iteration can be introduced to meet specific business requirements to maximize the value of components.
When RocketMQ Meets Elastic Stack | RocketMQ Makes Real-Time Log Analysis Easier
Storage Enhancements for Apache RocketMQ 5.0 in Stream Scenarios

701 posts | 57 followers
FollowAlibaba Cloud Native Community - January 25, 2024
Alibaba Cloud Native Community - January 5, 2023
Alibaba Cloud Native Community - February 1, 2023
Alibaba Cloud Native - June 11, 2024
OpenAnolis - March 10, 2026
Alibaba Cloud Native Community - February 15, 2023

701 posts | 57 followers
Follow ApsaraMQ for RocketMQ
ApsaraMQ for RocketMQ is a distributed message queue service that supports reliable message-based asynchronous communication among microservices, distributed systems, and serverless applications.
Learn More Bastionhost
A unified, efficient, and secure platform that provides cloud-based O&M, access control, and operation audit.
Learn More Managed Service for Grafana
Managed Service for Grafana displays a large amount of data in real time to provide an overview of business and O&M monitoring.
Learn More AliwareMQ for IoT
A message service designed for IoT and mobile Internet (MI).
Learn MoreMore Posts by Alibaba Cloud Native Community