Disclaimer: This is a translated article, all rights reserved to the original author. The views expressed herein are for reference only and don't necessarily represent the official views of Alibaba Cloud.
An international Alibaba Cloud customer recently built its full-stack observability system based on Alibaba Cloud Application Real-Time Monitoring Service (ARMS), Prometheus, and Grafana. However, due to historical reasons, they wanted to write Alibaba Cloud's monitoring metrics to Datadog as well. After researching, they found that Datadog only supports a limited number of integration components of Alibaba Cloud products and does not support other cloud products. Additionally, Datadog's observable data is in a specific format and is incompatible with open-source standards. However, it supports writing Prometheus data to Datadog through the Observability Pipeline. Fortunately, Alibaba Cloud's observability services are fully compatible with the open-source OpenTelemetry and Prometheus data specifications, and Alibaba Cloud Prometheus can access cloud product monitoring metrics. Users can use this best practice guide to convert Alibaba Cloud's monitoring metrics to open-source Prometheus data standards and write them to Datadog Metrics through the Alibaba Cloud Prometheus monitoring service.
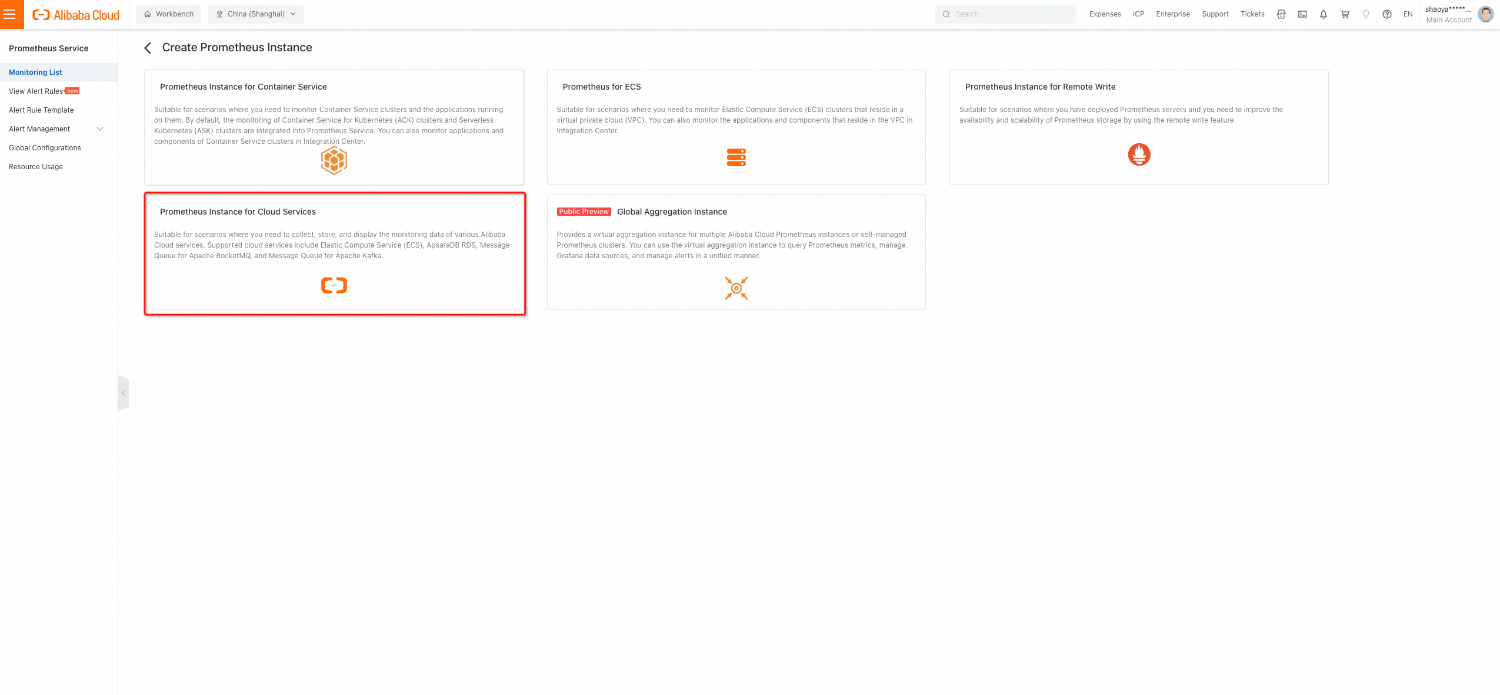
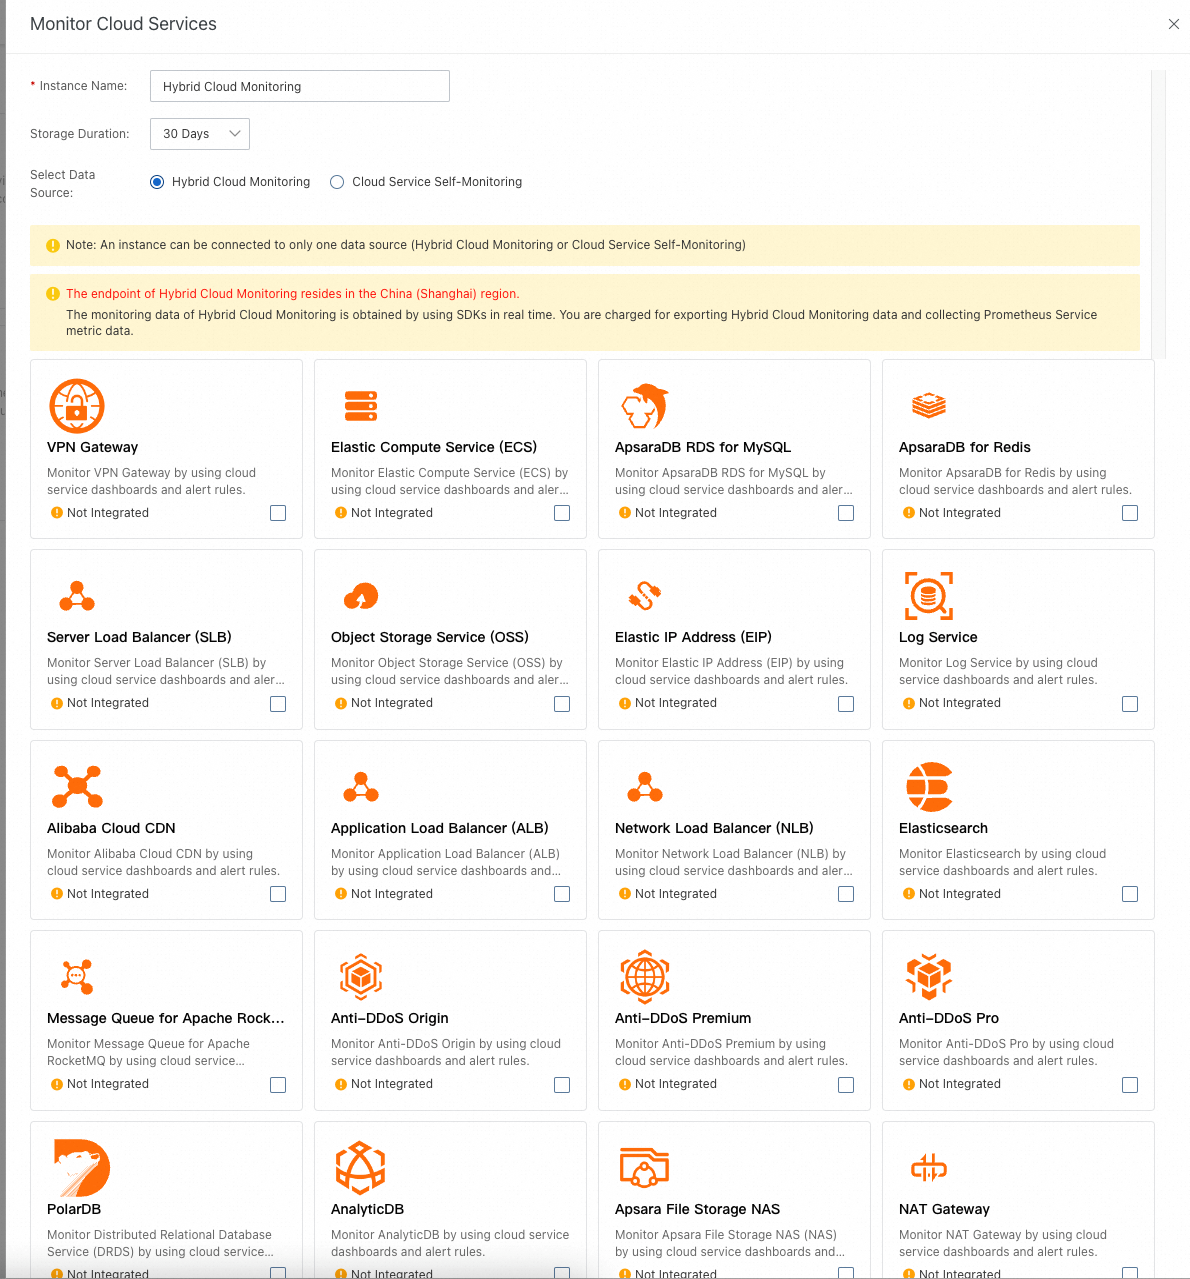
To select the cloud product to connect, for Alibaba Cloud products, Prometheus supports two data sources: Enterprise Cloud Monitor and Cloud Service Self-Monitoring. However, the current best practice only supports data from Enterprise Cloud Monitor. The following example demonstrates how to connect Alibaba Cloud ECS monitoring data.
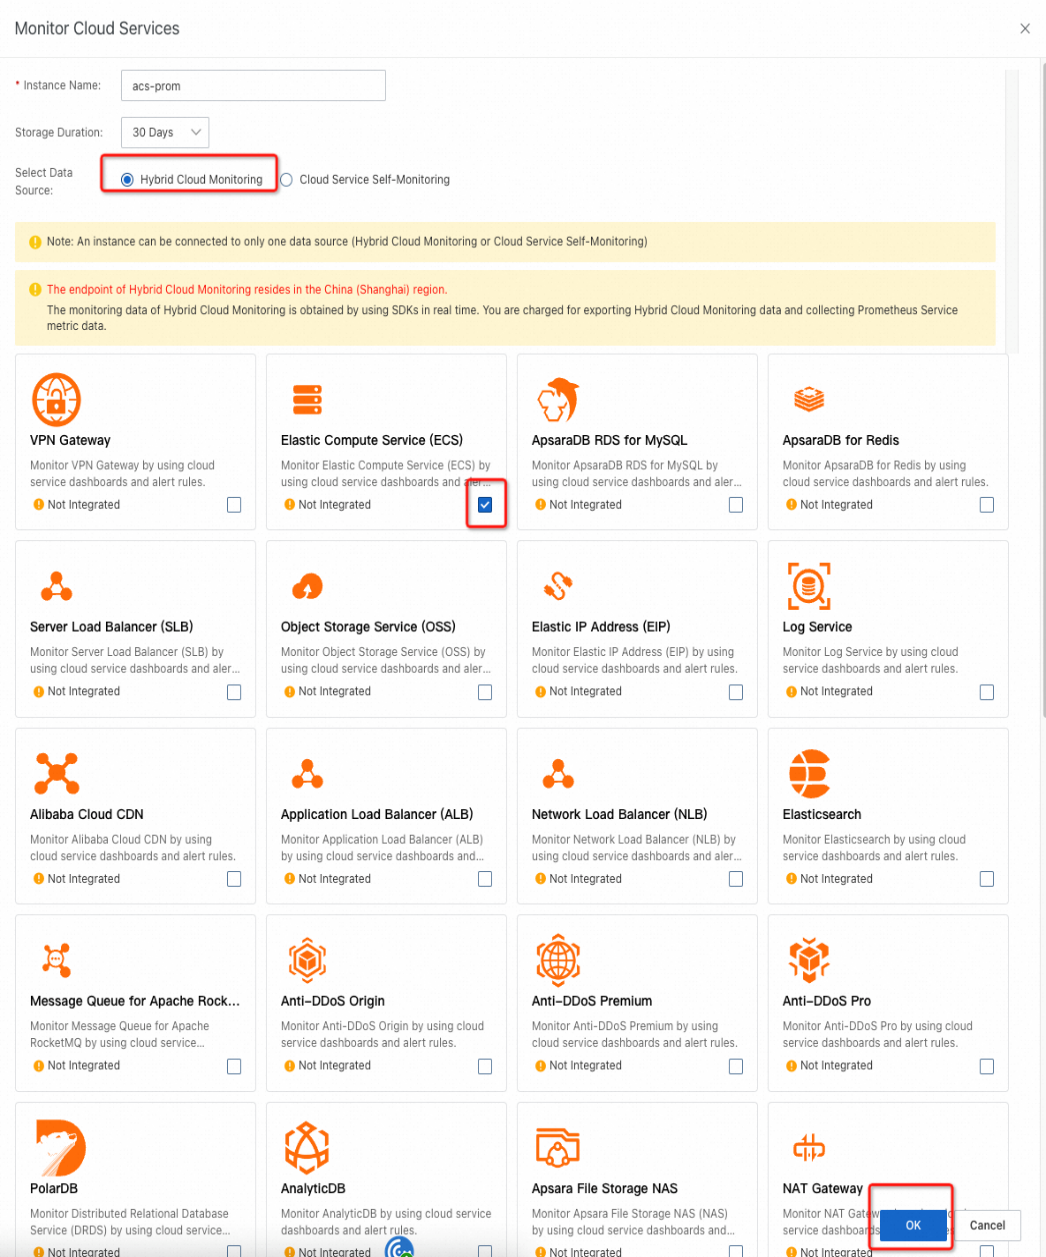
Enter the instance name, select Enterprise Cloud Monitor, select Alibaba Cloud ECS, click OK, and wait for the operation to complete.
Once the operation is complete, go to the Prometheus monitoring list and click the instance name that was just created. Then, go to the instance details and click Dashboard List. Click any dashboard and confirm that the cloud product monitoring metrics have been written to Prometheus. (There may be a 1-2 minute delay for the data to be written.)
Activate an ECS instance in the Singapore region of Alibaba Cloud to deploy the Observability Pipeline service later.
Go to the Alibaba Cloud ECS service console, select the Singapore region, create an ECS instance with 4C8G memory, and allocate a public IPV4 address. Other operating systems can be used, but this example uses Ubuntu.
Note: This tutorial only describes the deployment of Datadog Pipeline single instance to quickly achieve metric writing. It does not consider high availability. Datadog Pipeline also supports high availability. You can hang two ECS instances (both with Datadog Pipeline Worker deployed) after the Alibaba Cloud load balancing service (please refer to the Datadog official website documentation for details) for request load balancing.
After the ECS is successfully set up, log in to the Datadog console to obtain the Observability Pipeline Worker deployment script.
Log in to the Datadog console and navigate to Integrations - Observability Pipelines and click Create Pipeline to create a new pipeline:
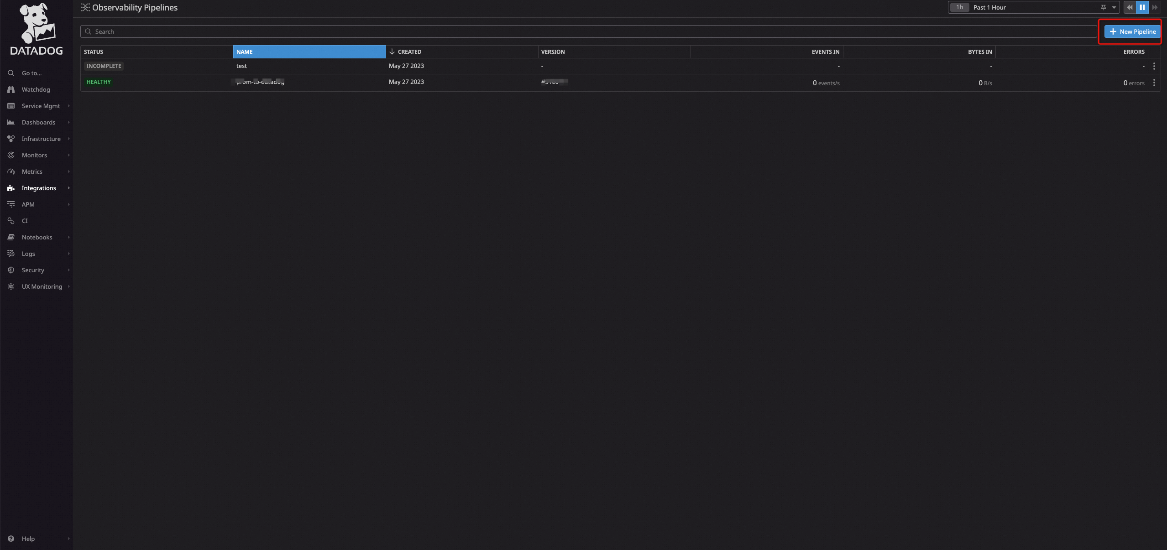
After creating the pipeline successfully, click Add Sources on the Pipeline page and select Prometheus Remote Write:
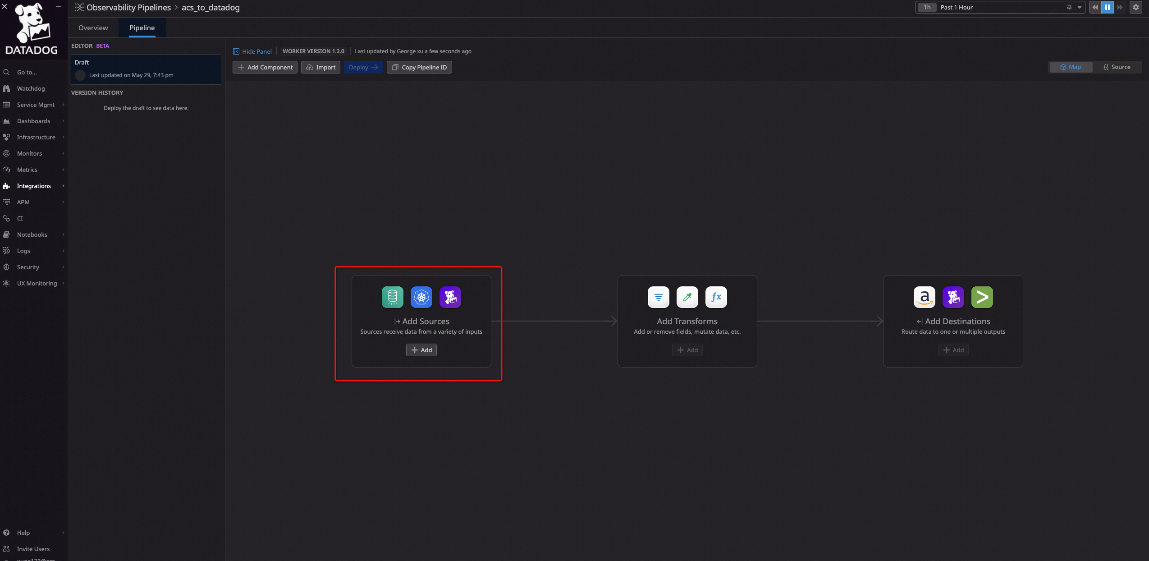
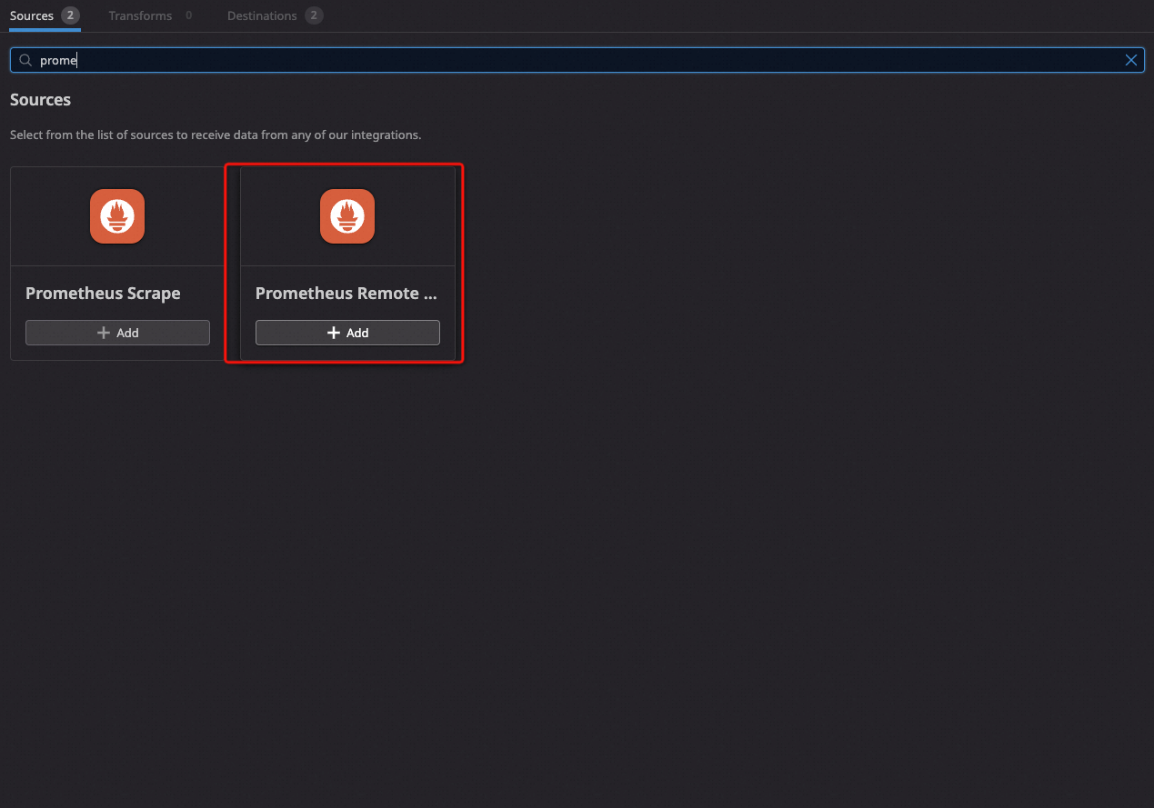
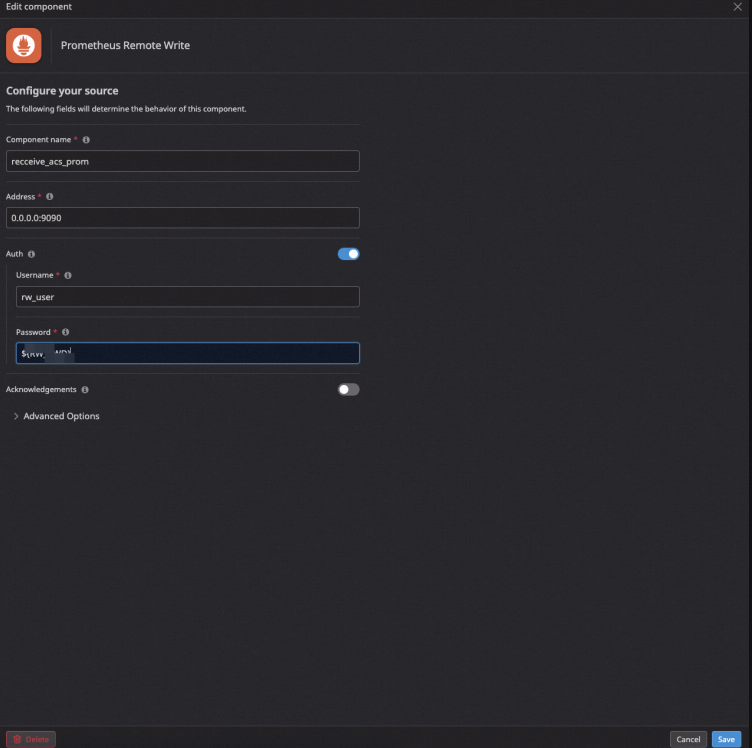
Enter the component name and listening address. (We recommend using 0.0.0.0, and the port can be customized.) We recommend enabling Auth authentication configuration to ensure data security. Click Save to save the configuration.
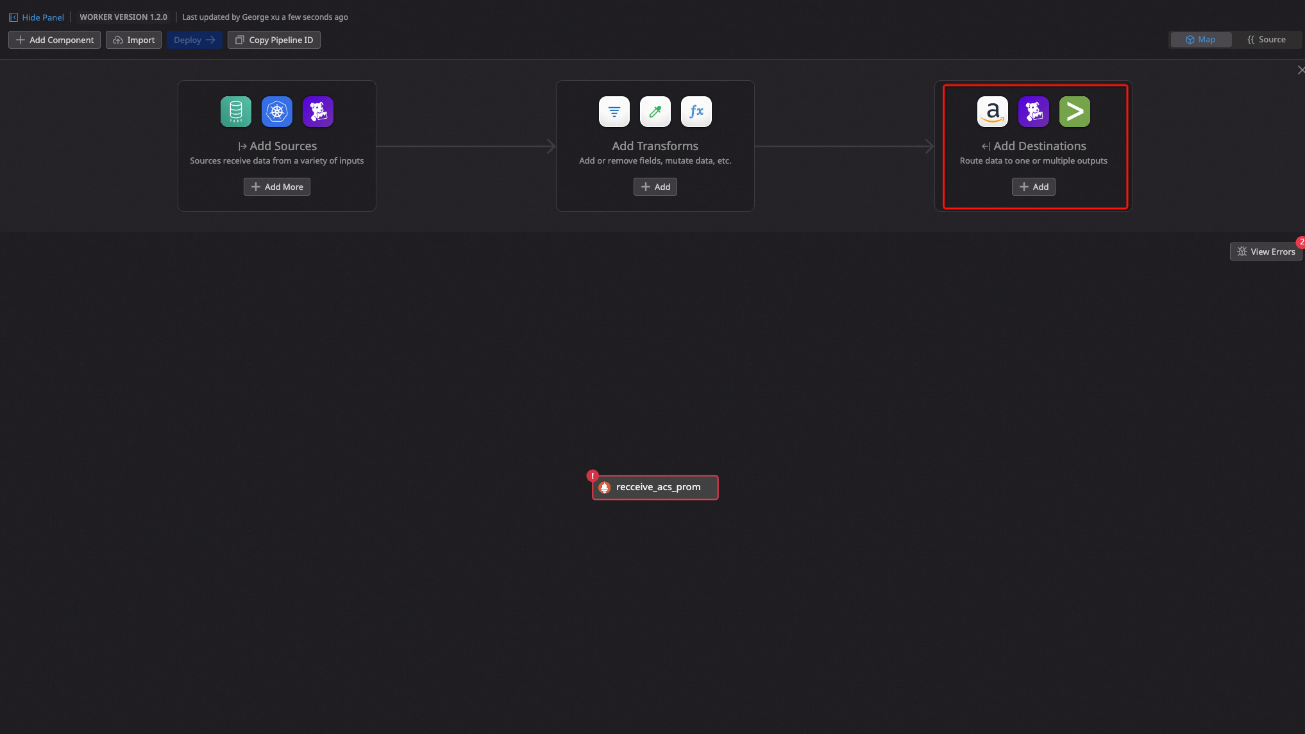
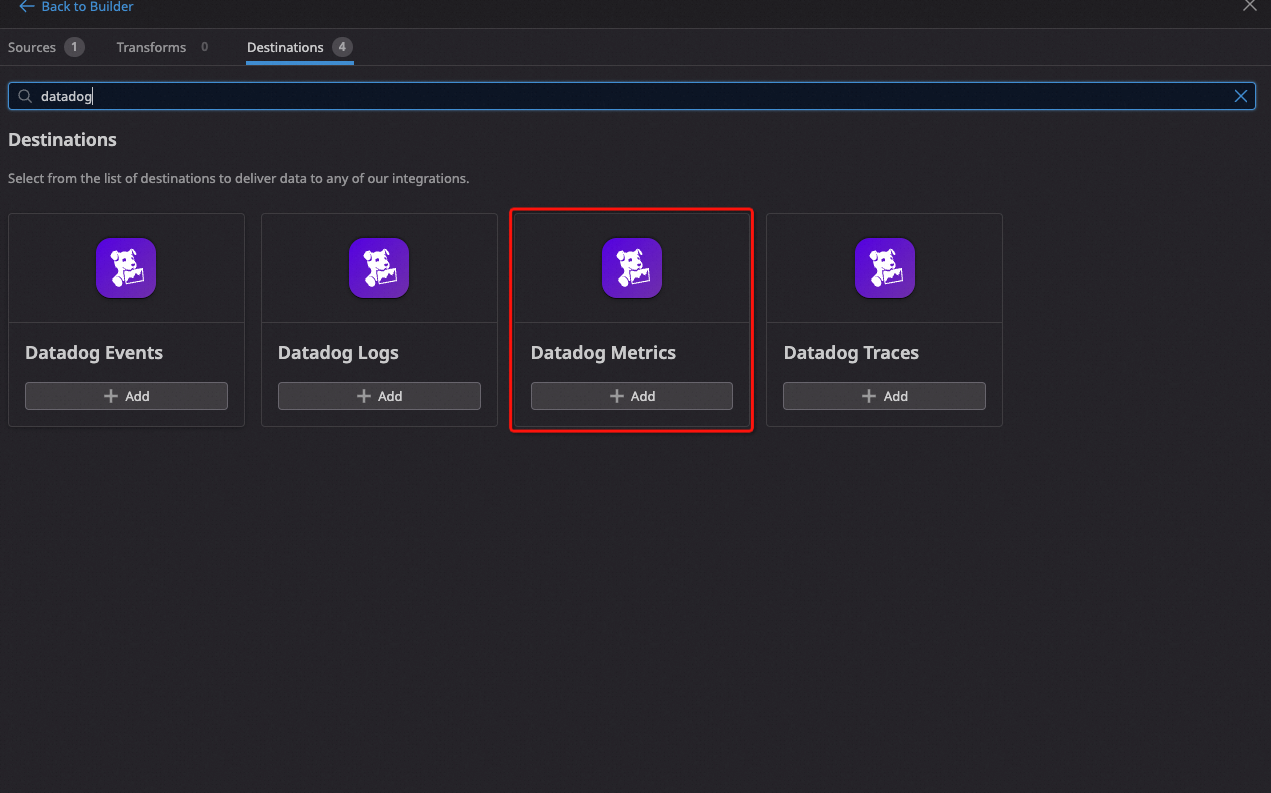
Click Add Destinations to add a destination source. Select Datadog Metrics:
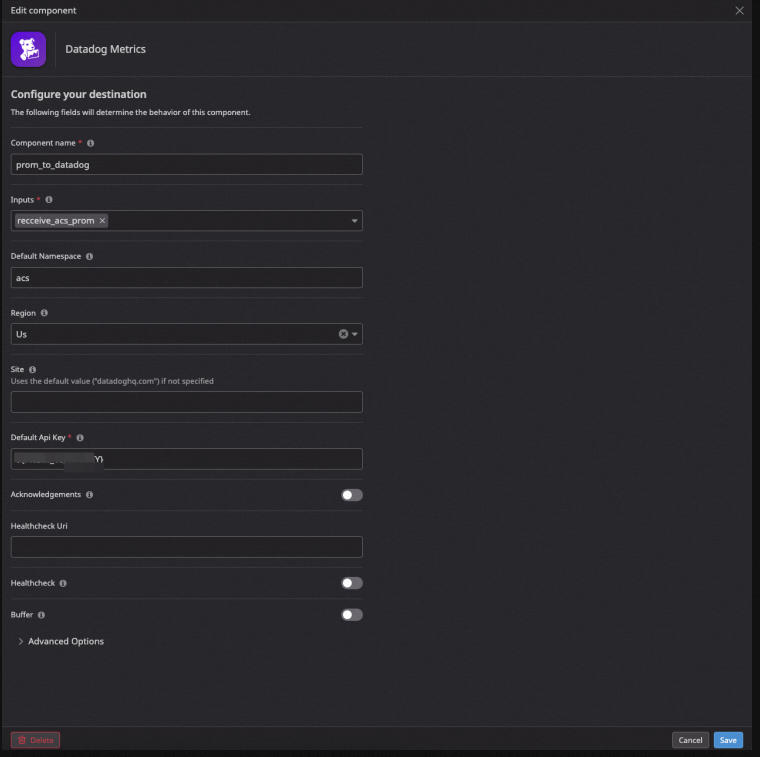
Enter the component name and select the source that was configured in the previous step. Set the metric namespace (we recommend using alicloud), choose the region where the data will be written to the Datadog service, and set the Default API Key. (You need to create a Datadog API key and fill in the created key ID. Please refer to the official documentation for information about how to create it.) Click Save to save the configuration.
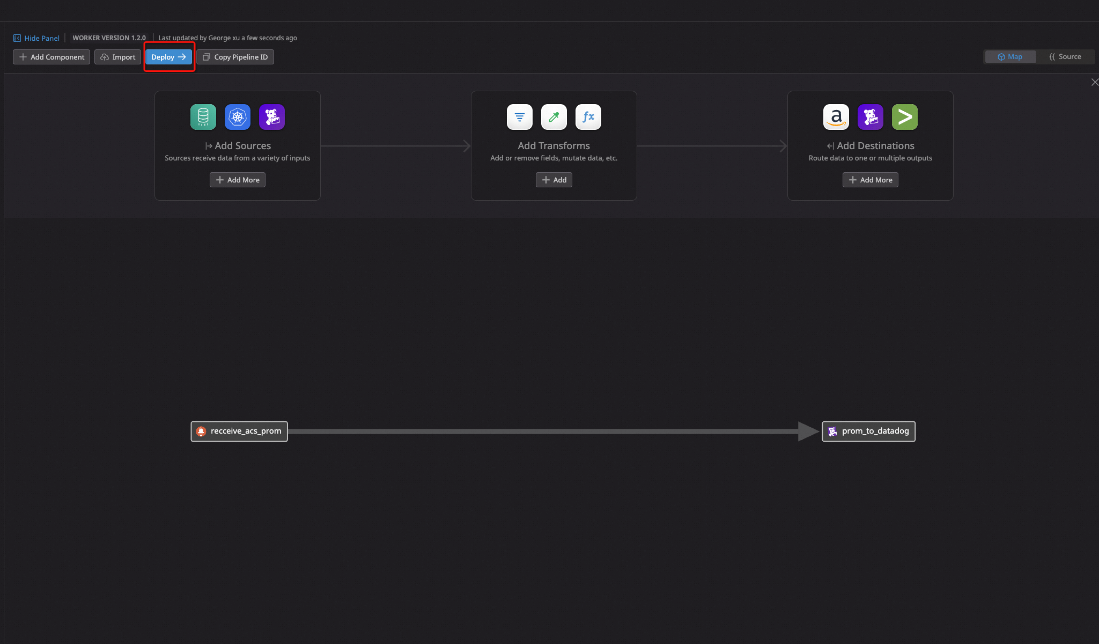
Click Deploy and then Confirm to generate an installation script (do not close the page):
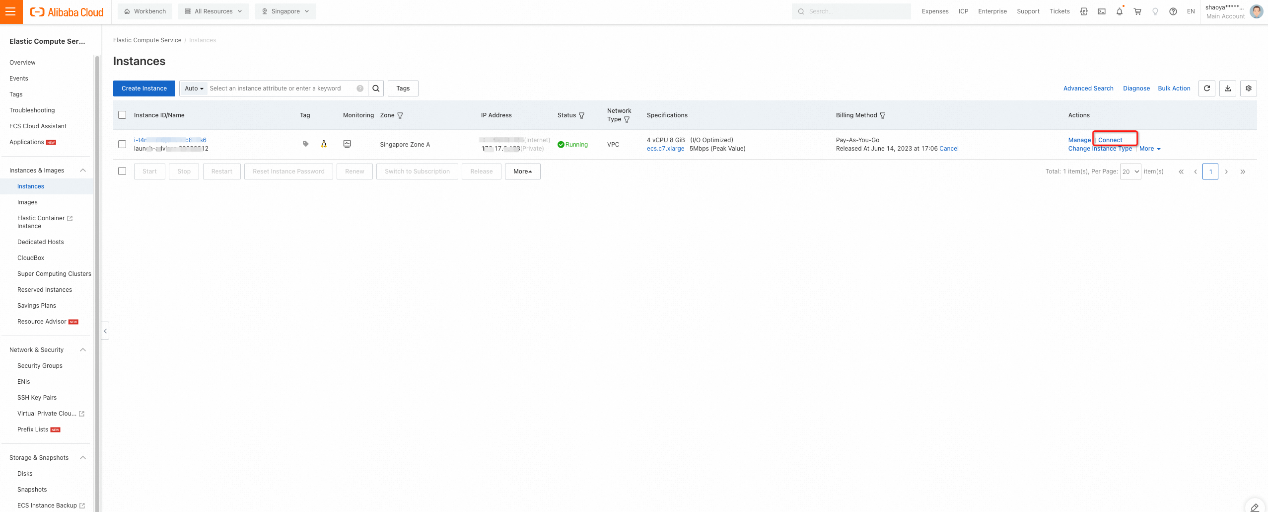
Log in to the Alibaba Cloud console and go to the ECS list page. Select the ECS instance that was created in the Singapore region and click Remote Connection to enter the online terminal:
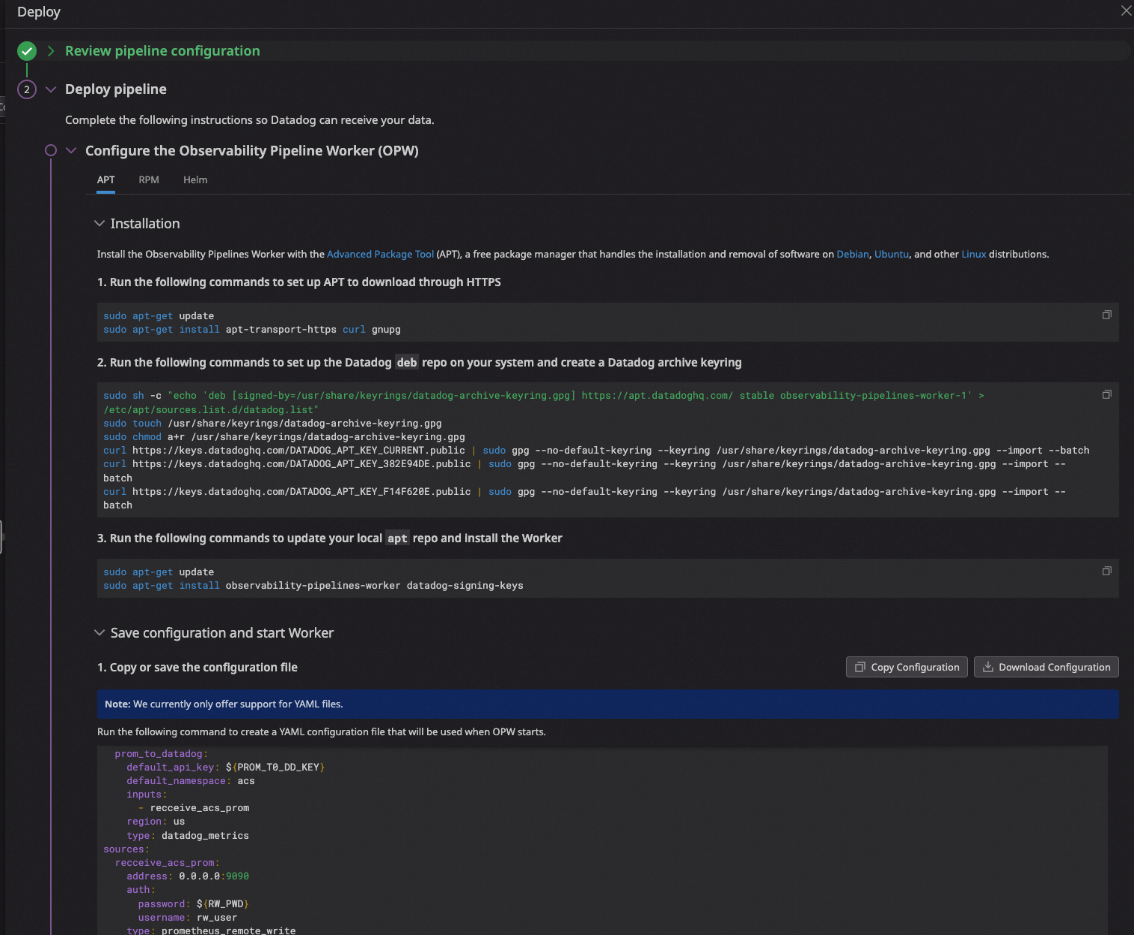
Follow the Datadog deployment script to complete the deployment of the Observability Pipeline Worker step by step:
Note: When starting the Datadog Pipeline Worker, you may encounter a problem where sensitive information (such as API Key and password) cannot be directly configured in the configuration file. You need to use environment variables.

Follow the steps below to set the environment variables:
vim /etc/profileSet two environment variables and save and exit:
source /etc/profile Make the environment variables take effect immediately:

Restart the Observability Pipeline Worker:


Note: Before writing Prometheus data to Datadog Pipeline, make sure the configured source port can be accessed publicly. If not, you can configure the ECS security group policy to allow public access.
Go to the Prometheus instance details page that was created earlier, click Settings, and edit the Prometheus.yaml file:

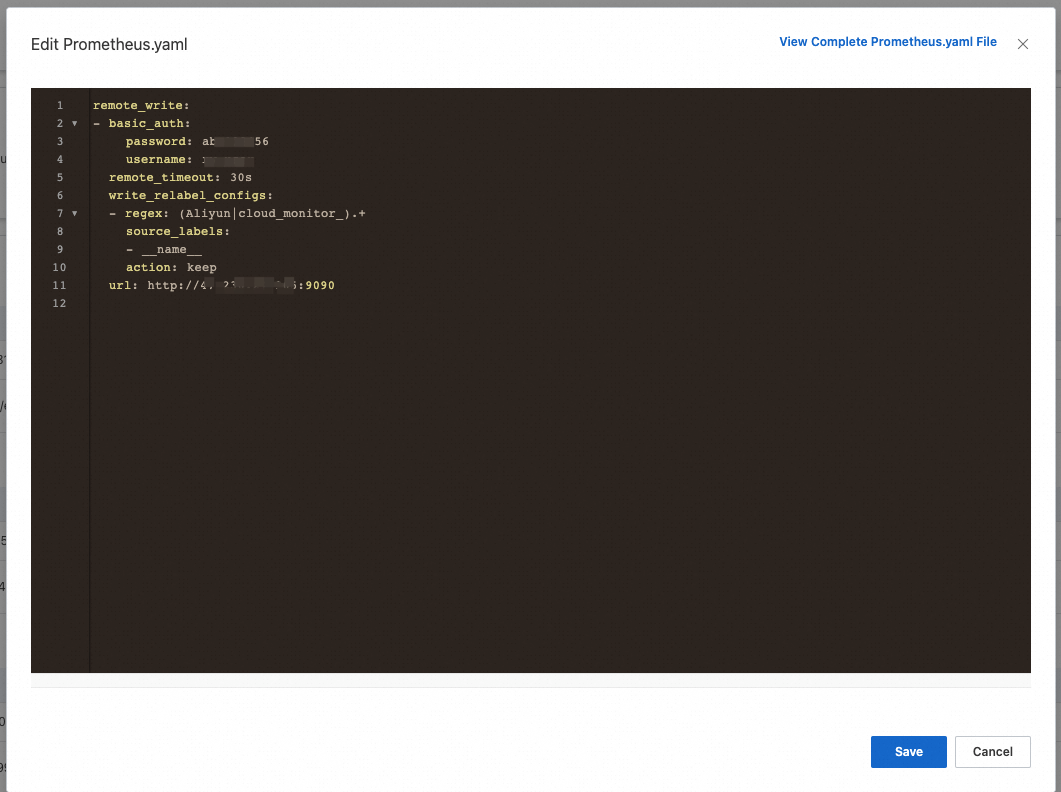
Set the basic_auth username and password to the ones that were set in the Pipeline Source. Set the URL to the public IP and port of the deployed Pipeline Worker service. Click Save. Go back to the Datadog Pipeline Worker configuration page. If you see the following message, the data has been successfully written.

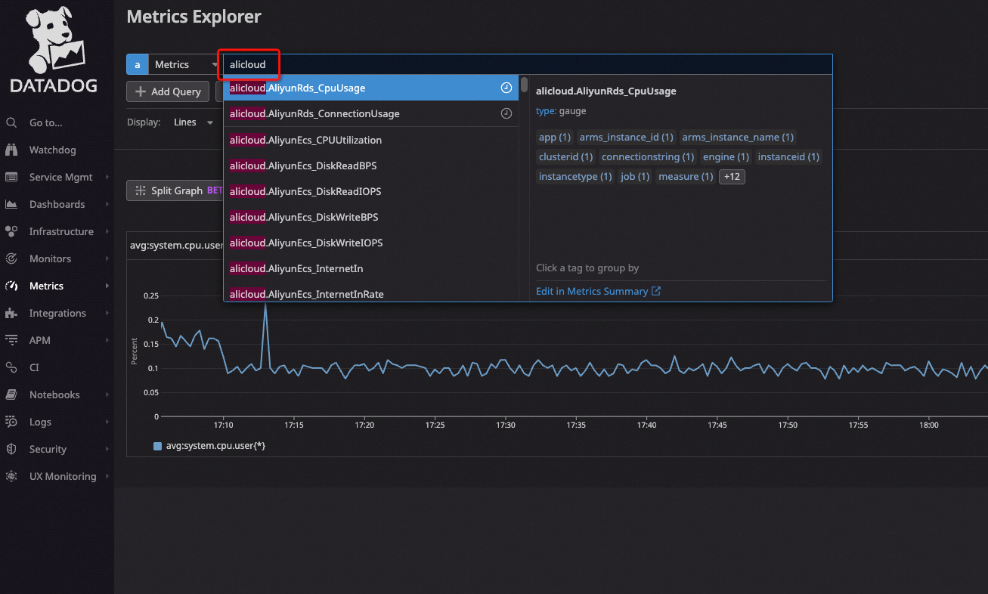
Wait 1-2 minutes, go to the Datadog Metrics Explorer page, and search for the alicloud namespace metric. You can see that the ECS-related monitoring metrics have been written to Datadog. You can use Datadog's dashboard capabilities to create custom monitoring dashboards.
Analysis of Alibaba Cloud Container Network Data Link (5): Terway ENI-Trunking
Alibaba Cloud Was Named a Leader in the Forrester Wave™: FaaS, Q2 2023

212 posts | 13 followers
FollowAlibaba Cloud Native Community - March 11, 2026
DavidZhang - June 14, 2022
Alibaba Cloud Native Community - February 8, 2024
Alibaba Cloud Native Community - February 2, 2026
DavidZhang - January 15, 2021
Alibaba Clouder - April 22, 2019

212 posts | 13 followers
Follow Application Real-Time Monitoring Service
Build business monitoring capabilities with real time response based on frontend monitoring, application monitoring, and custom business monitoring capabilities
Learn More CloudMonitor
Automate performance monitoring of all your web resources and applications in real-time
Learn More Managed Service for Prometheus
Multi-source metrics are aggregated to monitor the status of your business and services in real time.
Learn More Managed Service for Grafana
Managed Service for Grafana displays a large amount of data in real time to provide an overview of business and O&M monitoring.
Learn MoreMore Posts by Alibaba Cloud Native