By Zuozhi
Host monitoring is a traditional and common need in the monitoring and observability field. What are the pain points and difficulties of host monitoring in the business scenario of supercomputing training and AI large-scale training? Based on the needs of customers, the characteristics of supercomputing scenarios mainly focus on the following aspects:
Supercomputing excels at handling parallelizable computational problems by utilizing thousands of processor cores to decompose tasks and accelerate execution. Users typically employ elastic task scheduling systems to quickly scale up a large number of ECS hosts on the cloud to meet large-scale computing needs. During training tasks, factors such as overall computational resource utilization of the cluster are crucial for cost control.
The supercomputing system is designed to handle large-scale data sets, ensuring continuous and efficient computing work with high throughput. This makes it suitable for big data analysis, climate simulation, bioinformatics research, and other fields. If a throughput bottleneck occurs on some computing machines in a computing cluster, the overall computing performance is affected.
In supercomputing scenarios, each training task typically lasts for several hours or several days, with varying computing power demands. Users typically employ elastic computing power supply methods to scale up computing resources when needed and release them when finished. The scale and complexity of computing tasks change rapidly, requiring rapid increases or decreases in computing resources within a short period.
Business peaks and troughs
There will be extremely high demand for computing resources during certain periods, while demand may decrease during other periods, resulting in significant demand fluctuations.
A supercomputing task may utilize a large number of CPU, GPU, and RDMA resources simultaneously to achieve more efficient computing performance. Heterogeneous resource types may exist on different hosts to support different computing tasks.
In supercomputing scenarios, the need for extreme computing performance and dynamic resource scaling poses complex challenges to host observability. To ensure that new computing nodes can quickly and stably integrate into the overall computing environment while balancing cost efficiency, observability strategies must be carefully designed and implemented. Effective observability enables the timely identification of potential issues or opportunities for resource optimization.
In supercomputing scenarios, the host observability faces the following challenges:
Monitoring key metrics such as the running status, load, and network latency of compute nodes within seconds is a prerequisite for ensuring system stability and efficiency.
Supercomputing tasks often run on hosts as processes. You need to monitor the overall resource consumption of hosts and observe the resource consumption of specific computing tasks. Comparing resource consumption between processes helps quickly identify processes with abnormal resource usage. The number of processes and co-routines under a process are critical observable indicators.
The monitoring system should have an automated service discovery mechanism to immediately identify newly added or released nodes during elastic scaling, enabling them to be incorporated into the monitoring system within seconds.
For new computing nodes, automated deployment of monitoring components is crucial for quickly integrating the nodes into the monitoring system. Intelligent identification of hosts with different computing capacities is performed to install the appropriate data collection components, such as distinguishing between Windows or Linux hosts, GPU capabilities, and RDMA high-performance network requirements.
Data labels (also known as tags or label keys) are metadata associated with metrics, providing additional contextual information for detailed classification, filtering, and grouping of metrics. Depending on the use case and purpose, specific labels need to be added, such as organizational labels, environment labels, and business labels. By appropriately using and combining different data labels, you can enhance the queryability and operability of monitoring data, helping to build a more robust and flexible observability solution.
Alibaba Cloud Prometheus Host Monitor provides an efficient and easy-to-manage monitoring solution for Alibaba Cloud ECS. This solution meets the needs for observability and automated management in modern cloud computing environments. Alibaba Cloud Prometheus Host Monitor has the following advantages:
The host monitoring provided by Alibaba Cloud Prometheus can access all types of hosts including Alibaba Cloud ECS, IDC Host and Cloud Vendor Host. For Alibaba Cloud ECS, various open-source exporters can be automatically installed according to the configurations. The collection configurations of various exporters are automatically generated. The managed Prometheus Agent implements data automatic collection, unified store, unified observation, and unified alert. Automatic service discovery is not available for non-Alibaba Cloud hosts. Therefore, you must manually install the Alibaba Cloud collection probes when you connect the hosts to Alibaba Cloud Prometheus Service to automatically report the monitoring data to Alibaba Cloud Prometheus.
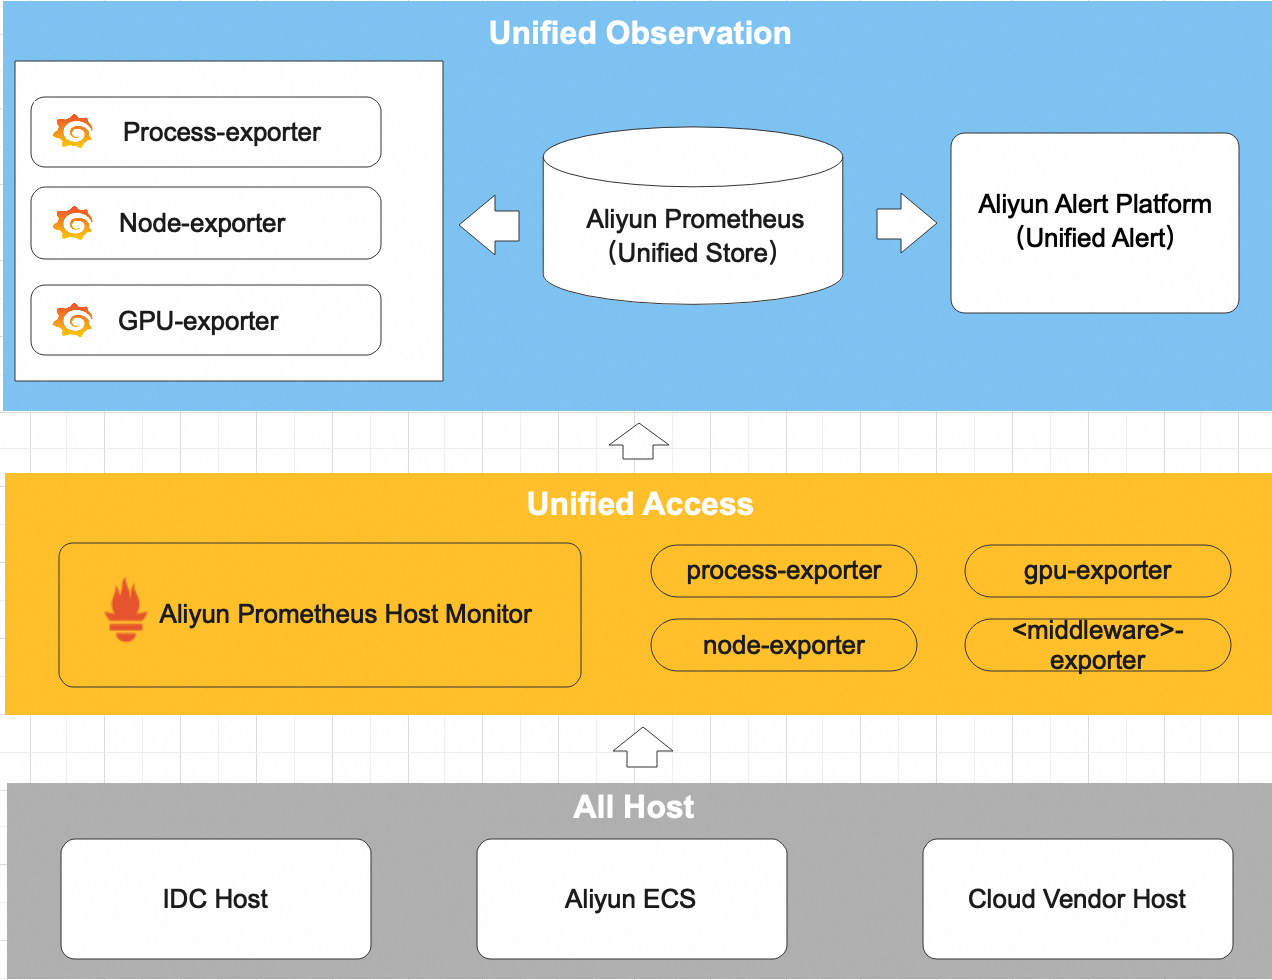
The architecture of Alibaba Cloud Prometheus Host Monitor
• Adaptability: The automatic service discovery mechanism allows the monitoring system to quickly adapt to dynamic changes in cloud resources, ensuring that all running instances are monitored in a timely manner.
• Diversity: Multiple types of service discovery are supported to meet the monitoring requirements in different scenarios, such as automatic discovery of services in Kubernetes clusters and integration of other types of cloud services.
• Plug-and-play: Automated installation of exporters allows new computing nodes to be immediately recognized and monitored by the system without manual intervention.
• Comprehensive monitoring: provides a variety of exporters, including Node-exporter, Process-exporter, GPU-exporter, and Middleware exporter, for comprehensive performance tracking.
• Simplified configuration: Automated configuration generation reduces the burden of manual configuration on O&M personnel and ensures that the metrics of all nodes and services can be accurately collected.
• Flexibility: The configuration can be adjusted according to the existing monitoring requirements, bringing flexibility and scalability to cope with complex and changing monitoring environments.
From the creation of the host to the inclusion of the monitoring system, the whole process can be completed within 30-60s. All indicator data of the host can support flexible adjustment of the 1-60s time interval. The overall implementation of the host omnidirectional second-level monitoring capabilities.
• Centralized management: Managed Prometheus Agents are used to manage data collection in a unified manner. This simplifies the monitoring architecture and improves O&M efficiency. The user is not aware of the data collection link.
• High performance: By abstracting the complexity of monitoring algorithms, the use of Agents reduces the likelihood of misconfigurations, thereby improving the accuracy and timeliness of monitoring data.
• Automatically extract labels, resource groups, and region information from Alibaba Cloud ECS and inject them into the entire indicator system, making it convenient and efficient.
• Configurable custom label addition capabilities further enhance the flexibility of the label system, allowing for customization of labels such as business identifiers, environment identifiers, and data source identifiers.
• In order to achieve system-level and comprehensive observability, single-entity monitoring is not enough. It is necessary to integrate monitoring data from different dimensions and build full-link observation to ensure that the monitoring system can reflect the health and performance of the entire application and service ecosystem.
• A comprehensive monitoring policy that covers the underlying hardware to the application layer and then to external services, such as RDMA networks, OSS storage, and Redis. This policy should include not only the monitoring of hosts and networks but also the monitoring of dependent services.
• Process-level monitoring can track and analyze the processes running on the operating system to understand the performance and resource utilization of the processes. This is a key part of implementing system-level monitoring, aimed at providing an overview of the health and performance of applications running on servers.
• Process-level monitoring captures key performance metrics such as the CPU usage, memory usage, and disk read /write status of a process, as well as the startup time of the process, the number of open file handles, and the number of threads that are lowered by the process. It provides near real-time monitoring capabilities for immediate feedback, allowing system administrators to identify and resolve issues in a timely manner.
• Process-level monitoring provides administrators with more fault diagnosis methods to help identify processes that cause system performance degradation or faults, such as memory leaks, high CPU usage, or other resource contention.
• By default, it is integrated with Grafana dashboards that have been developed by Alibaba Cloud experts, including the ECS Overview Dashboard, ECS Detail Dashboard, GPU Overview Dashboard, GPU Detail Dashboard, and Node-Process Dashboard.
• This achieves one-click access to the host, which can be observed and used out of the box.
Take an Alibaba Cloud ECS instance as an example. On the Application Real-Time Monitoring Service page, click Access Management, select an ECS environment, and click Add Access to access GPU monitoring and host monitoring. GPU monitoring is connected to GPU hosts, and GPU-exporter is automatically installed by default. Host monitoring is connected to CPU hosts. Node-exporter and Process-exporter are automatically installed by default.
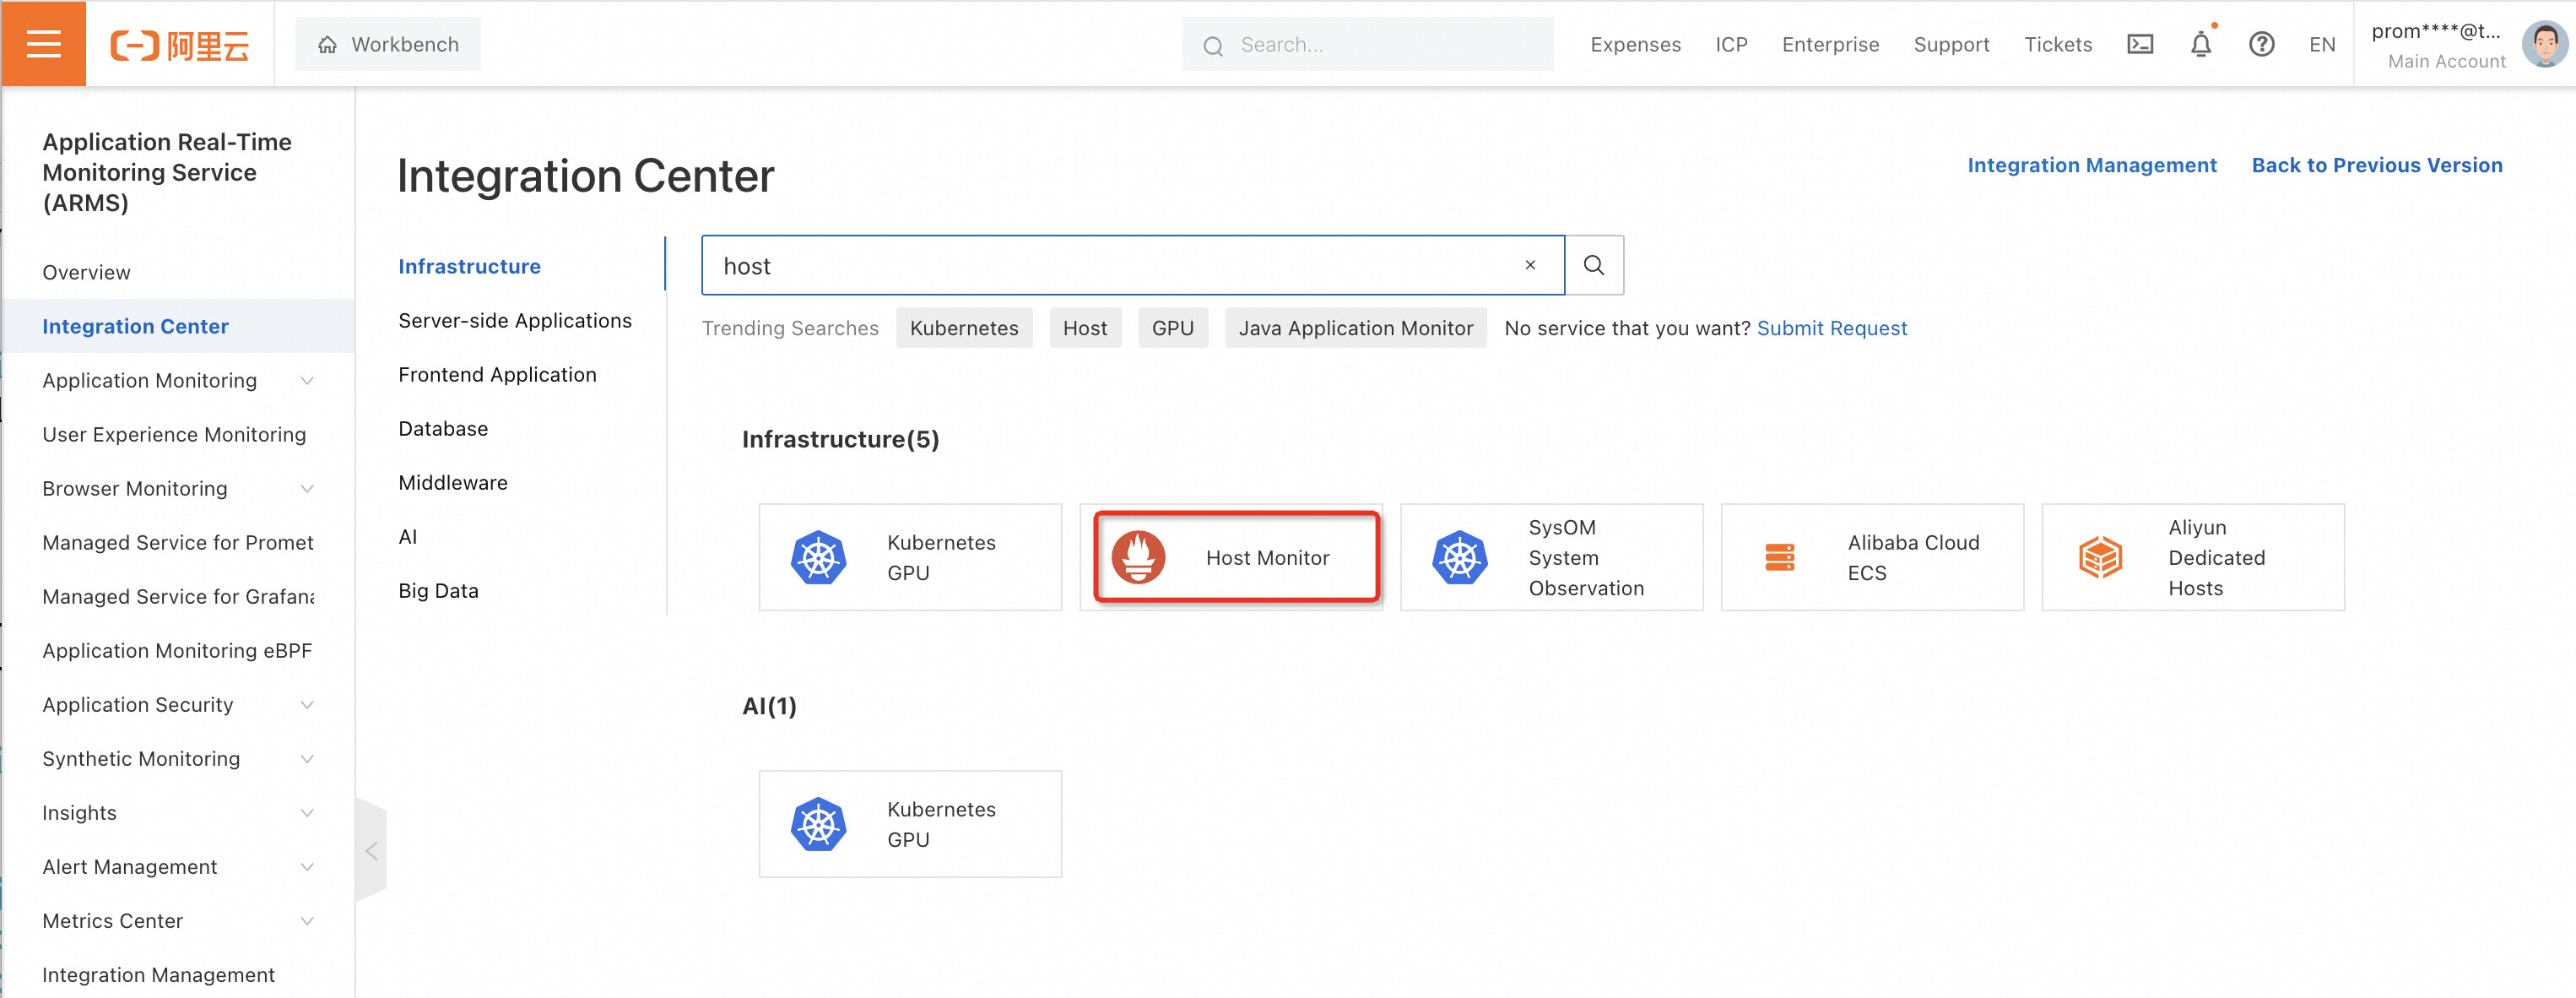
Multiple types of service discovery methods are supported for Alibaba Cloud ECS instances. You can flexibly select the target servers that need to be monitored. The service discovery method does not differ between CPU hosts and GPU hosts.
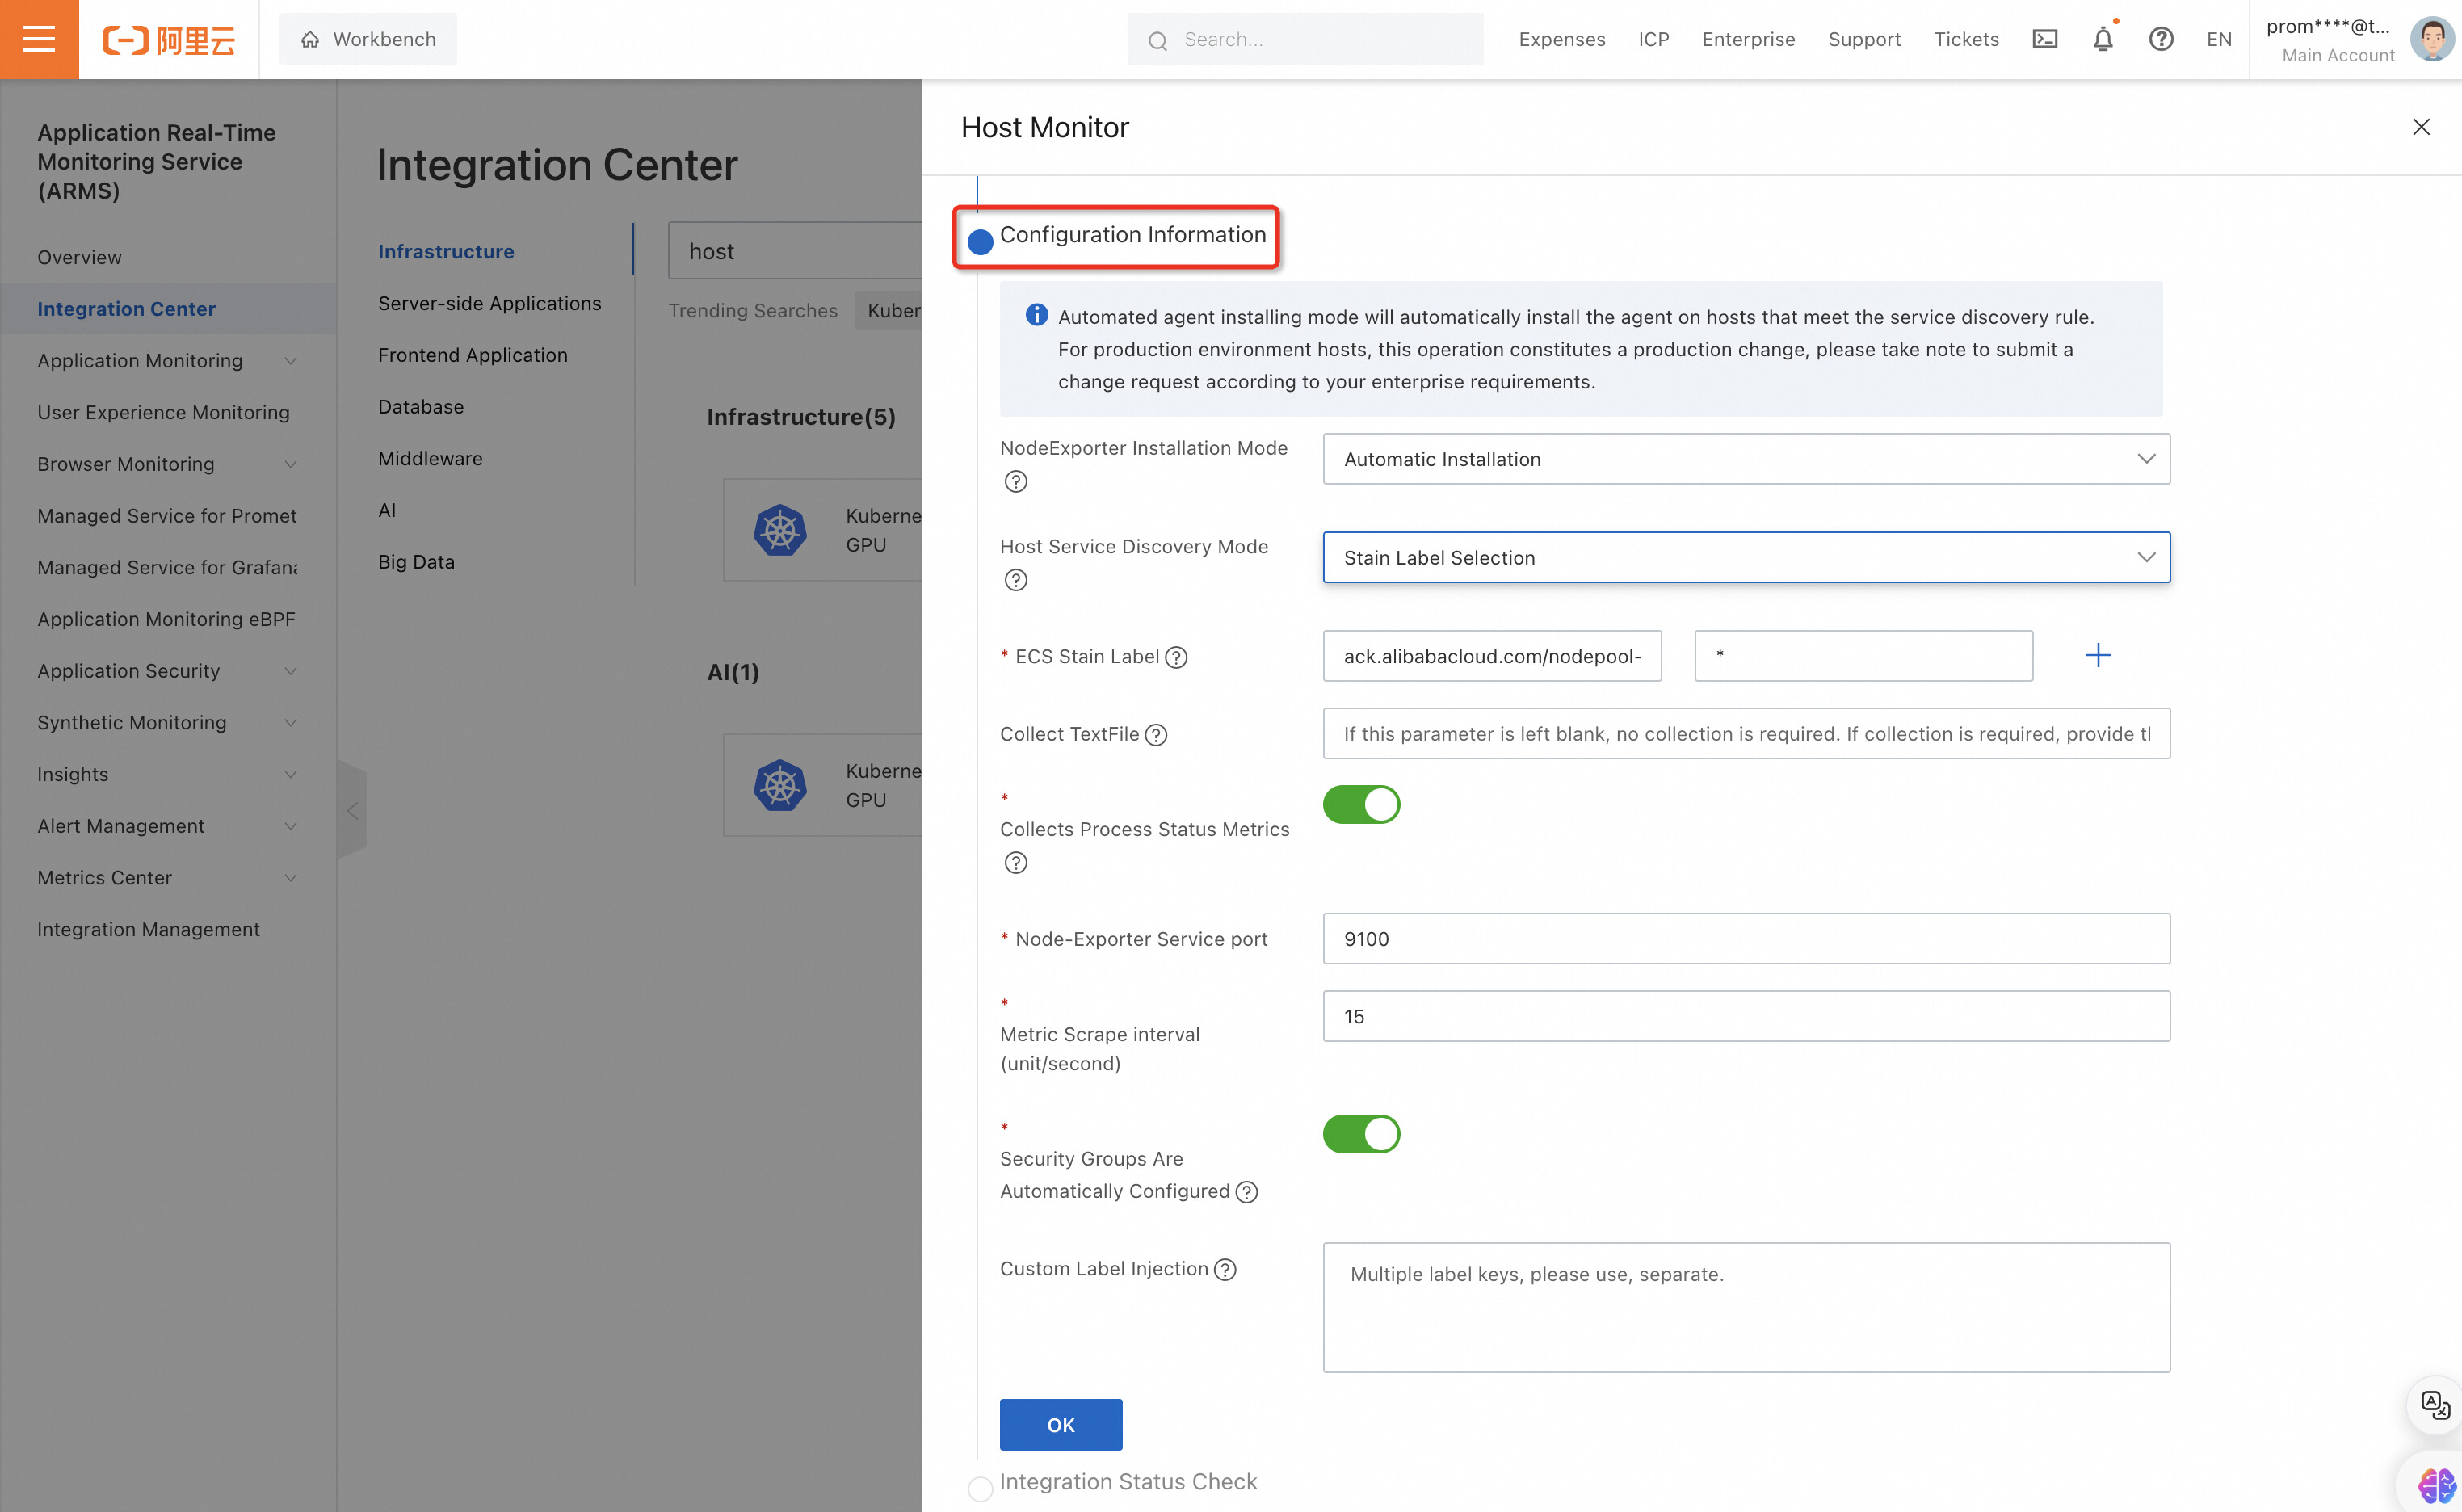
After successful access, the number of hosts discovered by the service and the installation and running status of the Exporter are displayed based on the host type.
On the Self-Monitoring page, you can view the collection status of GPU and CPU hosts in real time and obtain source data in real time.
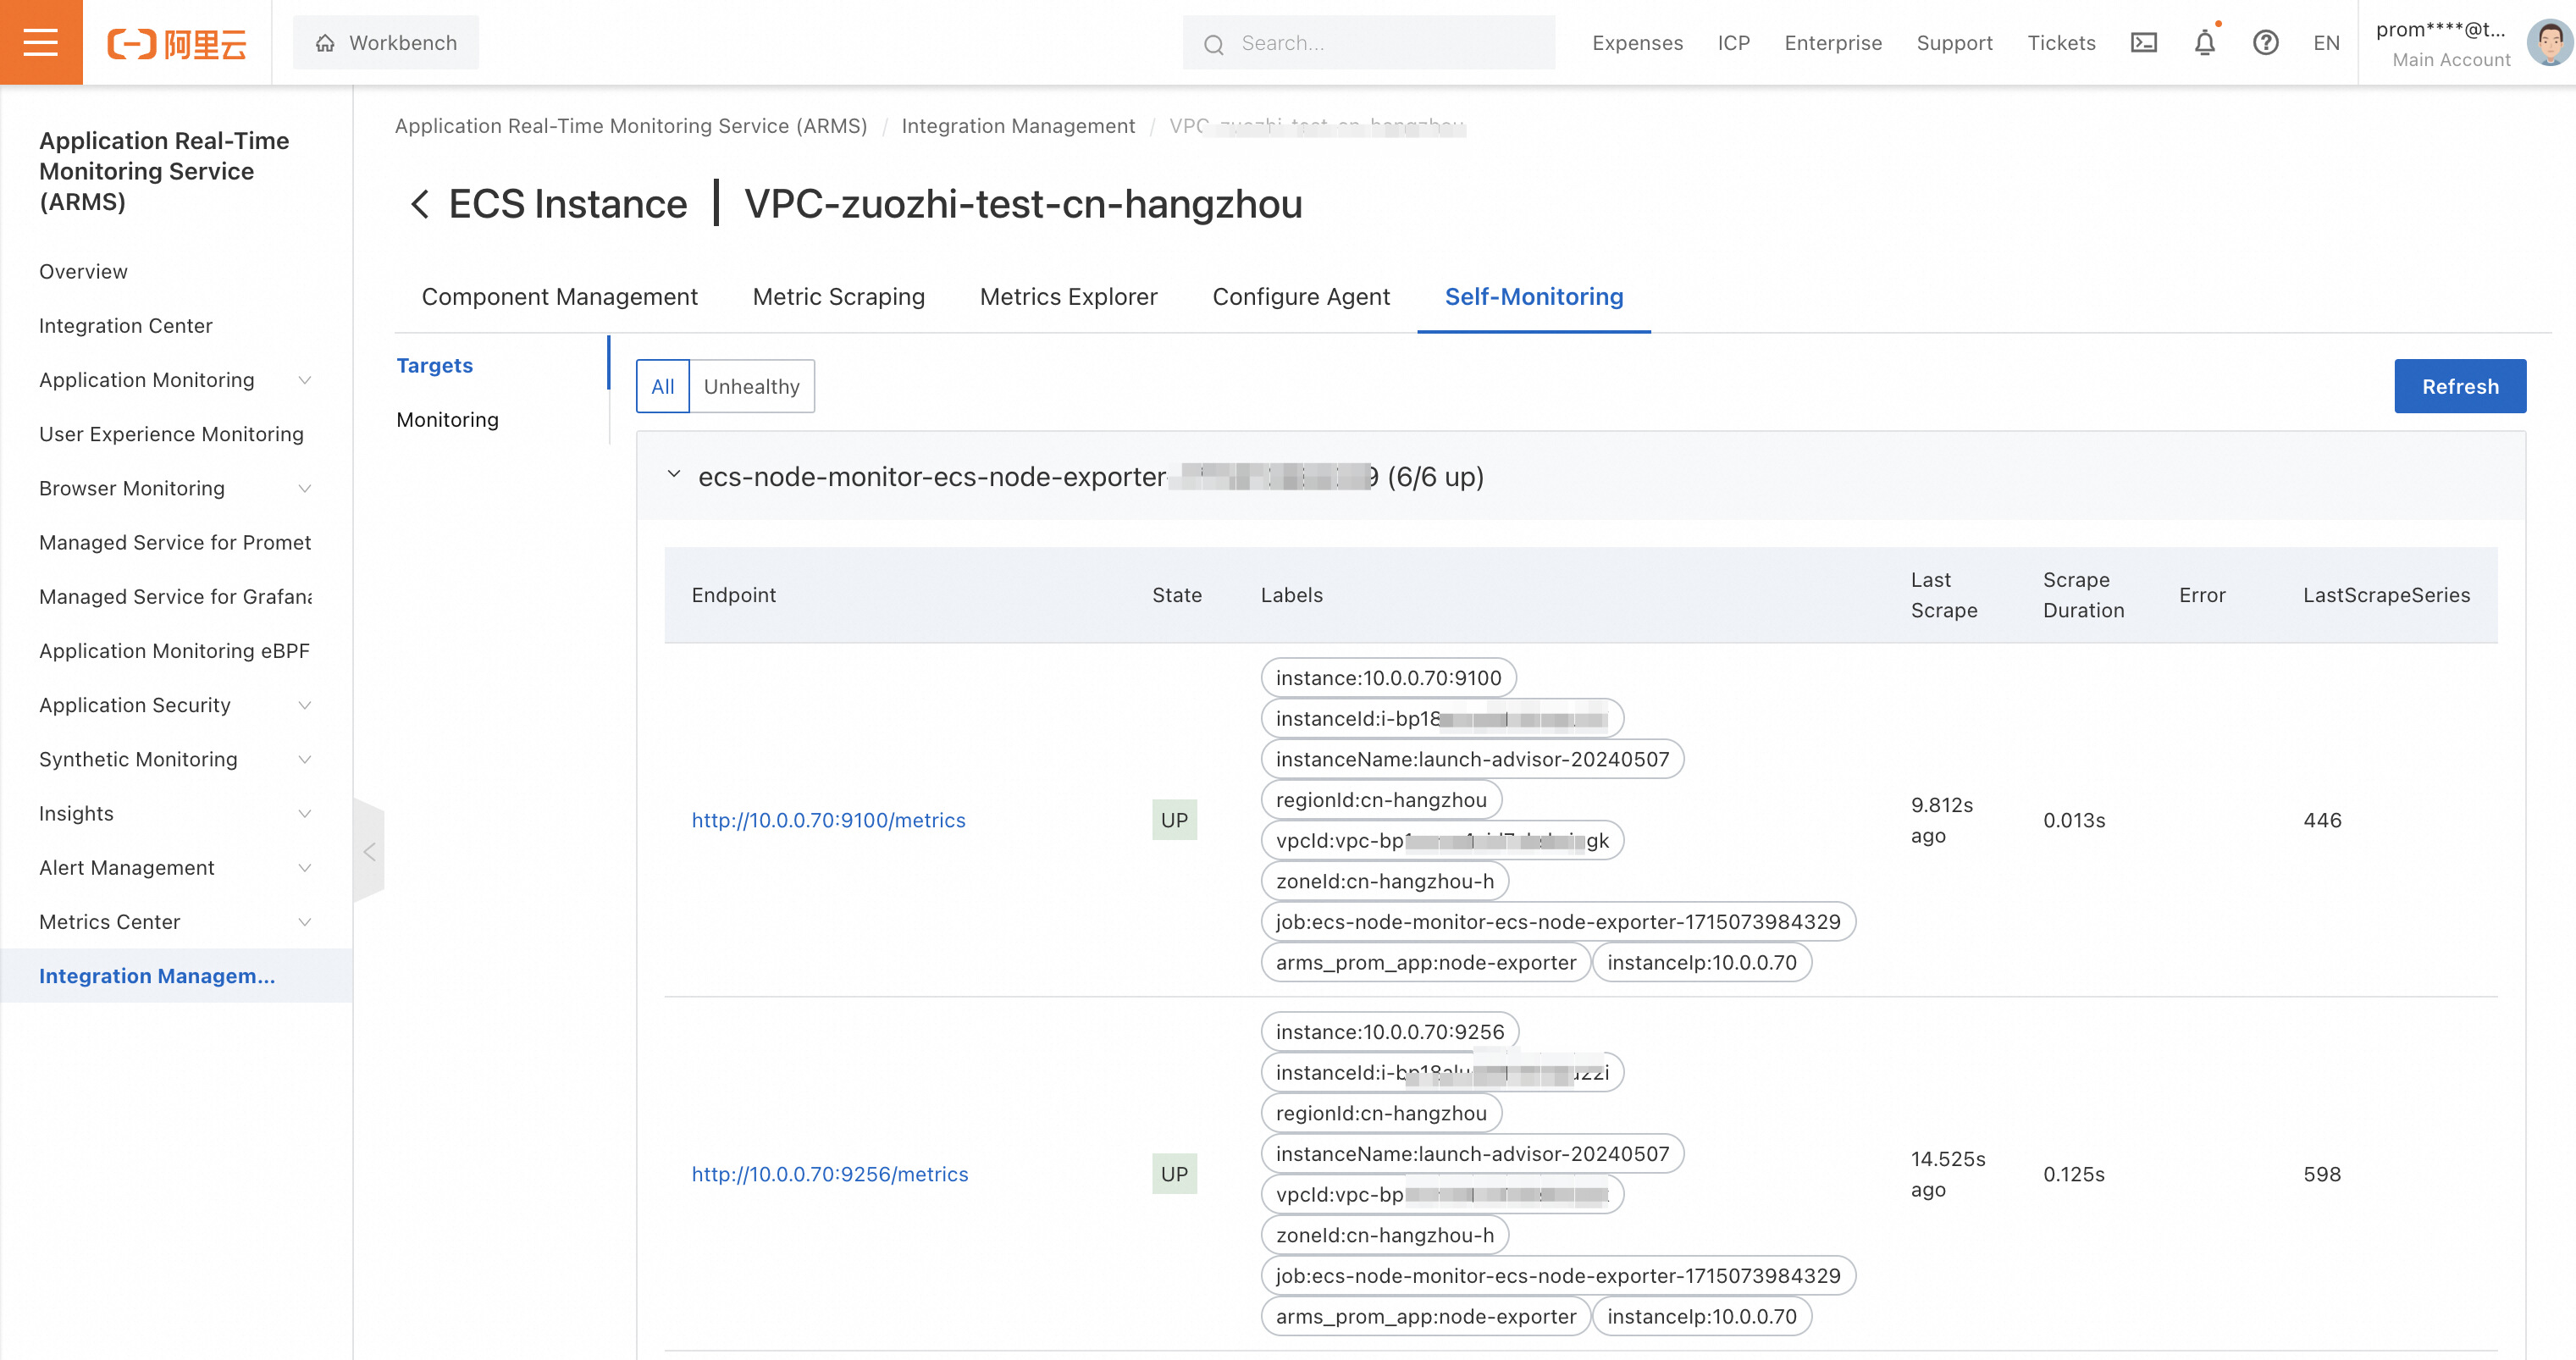
The following shows the effect of accessing Prometheus Host Monitor:
1. Rapid Service Discovery
2. Rapid Deployment of Exporter
3. Low Data Observable Latency
4. Timely Stop Data Collection
5. Efficient Concurrent Processing Capability
Alibaba Cloud Prometheus Host Monitor provides powerful monitoring capabilities for supercomputing users. This fast and accurate observability is the key for supercomputing users to realize dynamic resource management and performance optimization in the cloud environment. The ability to respond to the elastic scaling of computing resources in a timely manner is essential to ensure the continuity of computing jobs, gain insight into system bottlenecks and abnormal behavior, and guide resource allocation decisions.
Alibaba Cloud Prometheus Host Monitor integrates GPU monitoring and CPU host monitoring. By default, the corresponding dashboard provides basic observation, process observation, co-routine observation, and GPU observation.
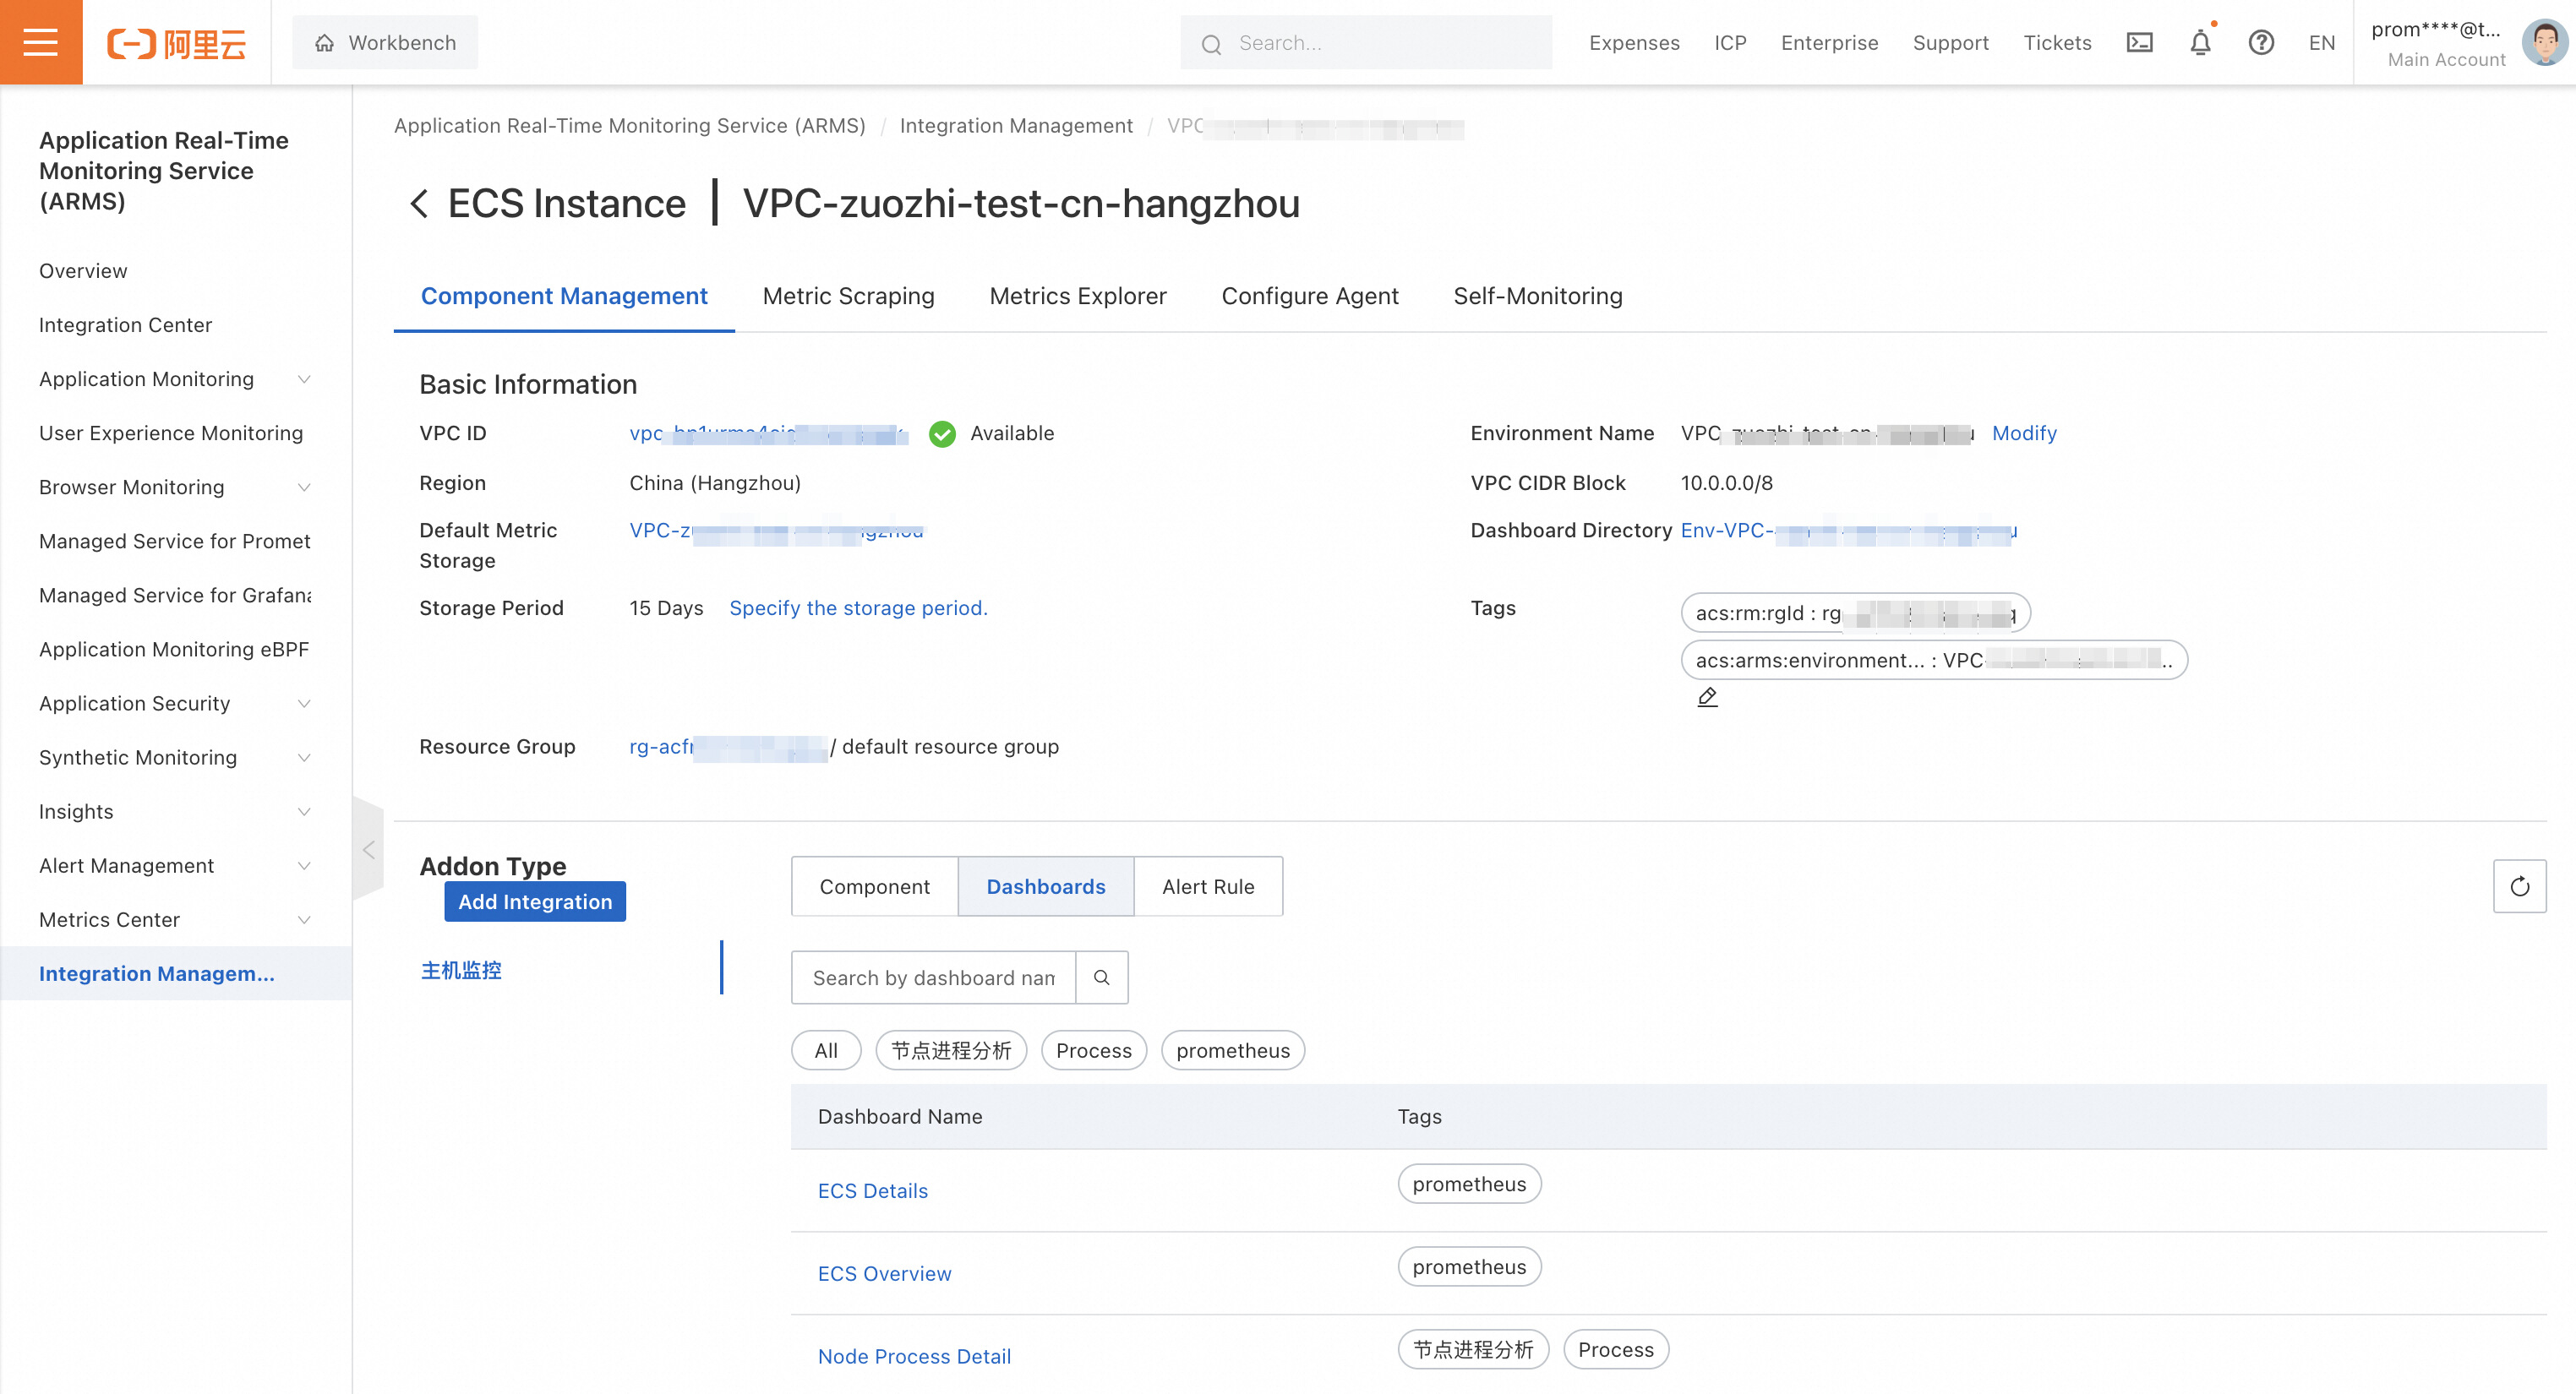
Default integration of dashboards in host monitoring
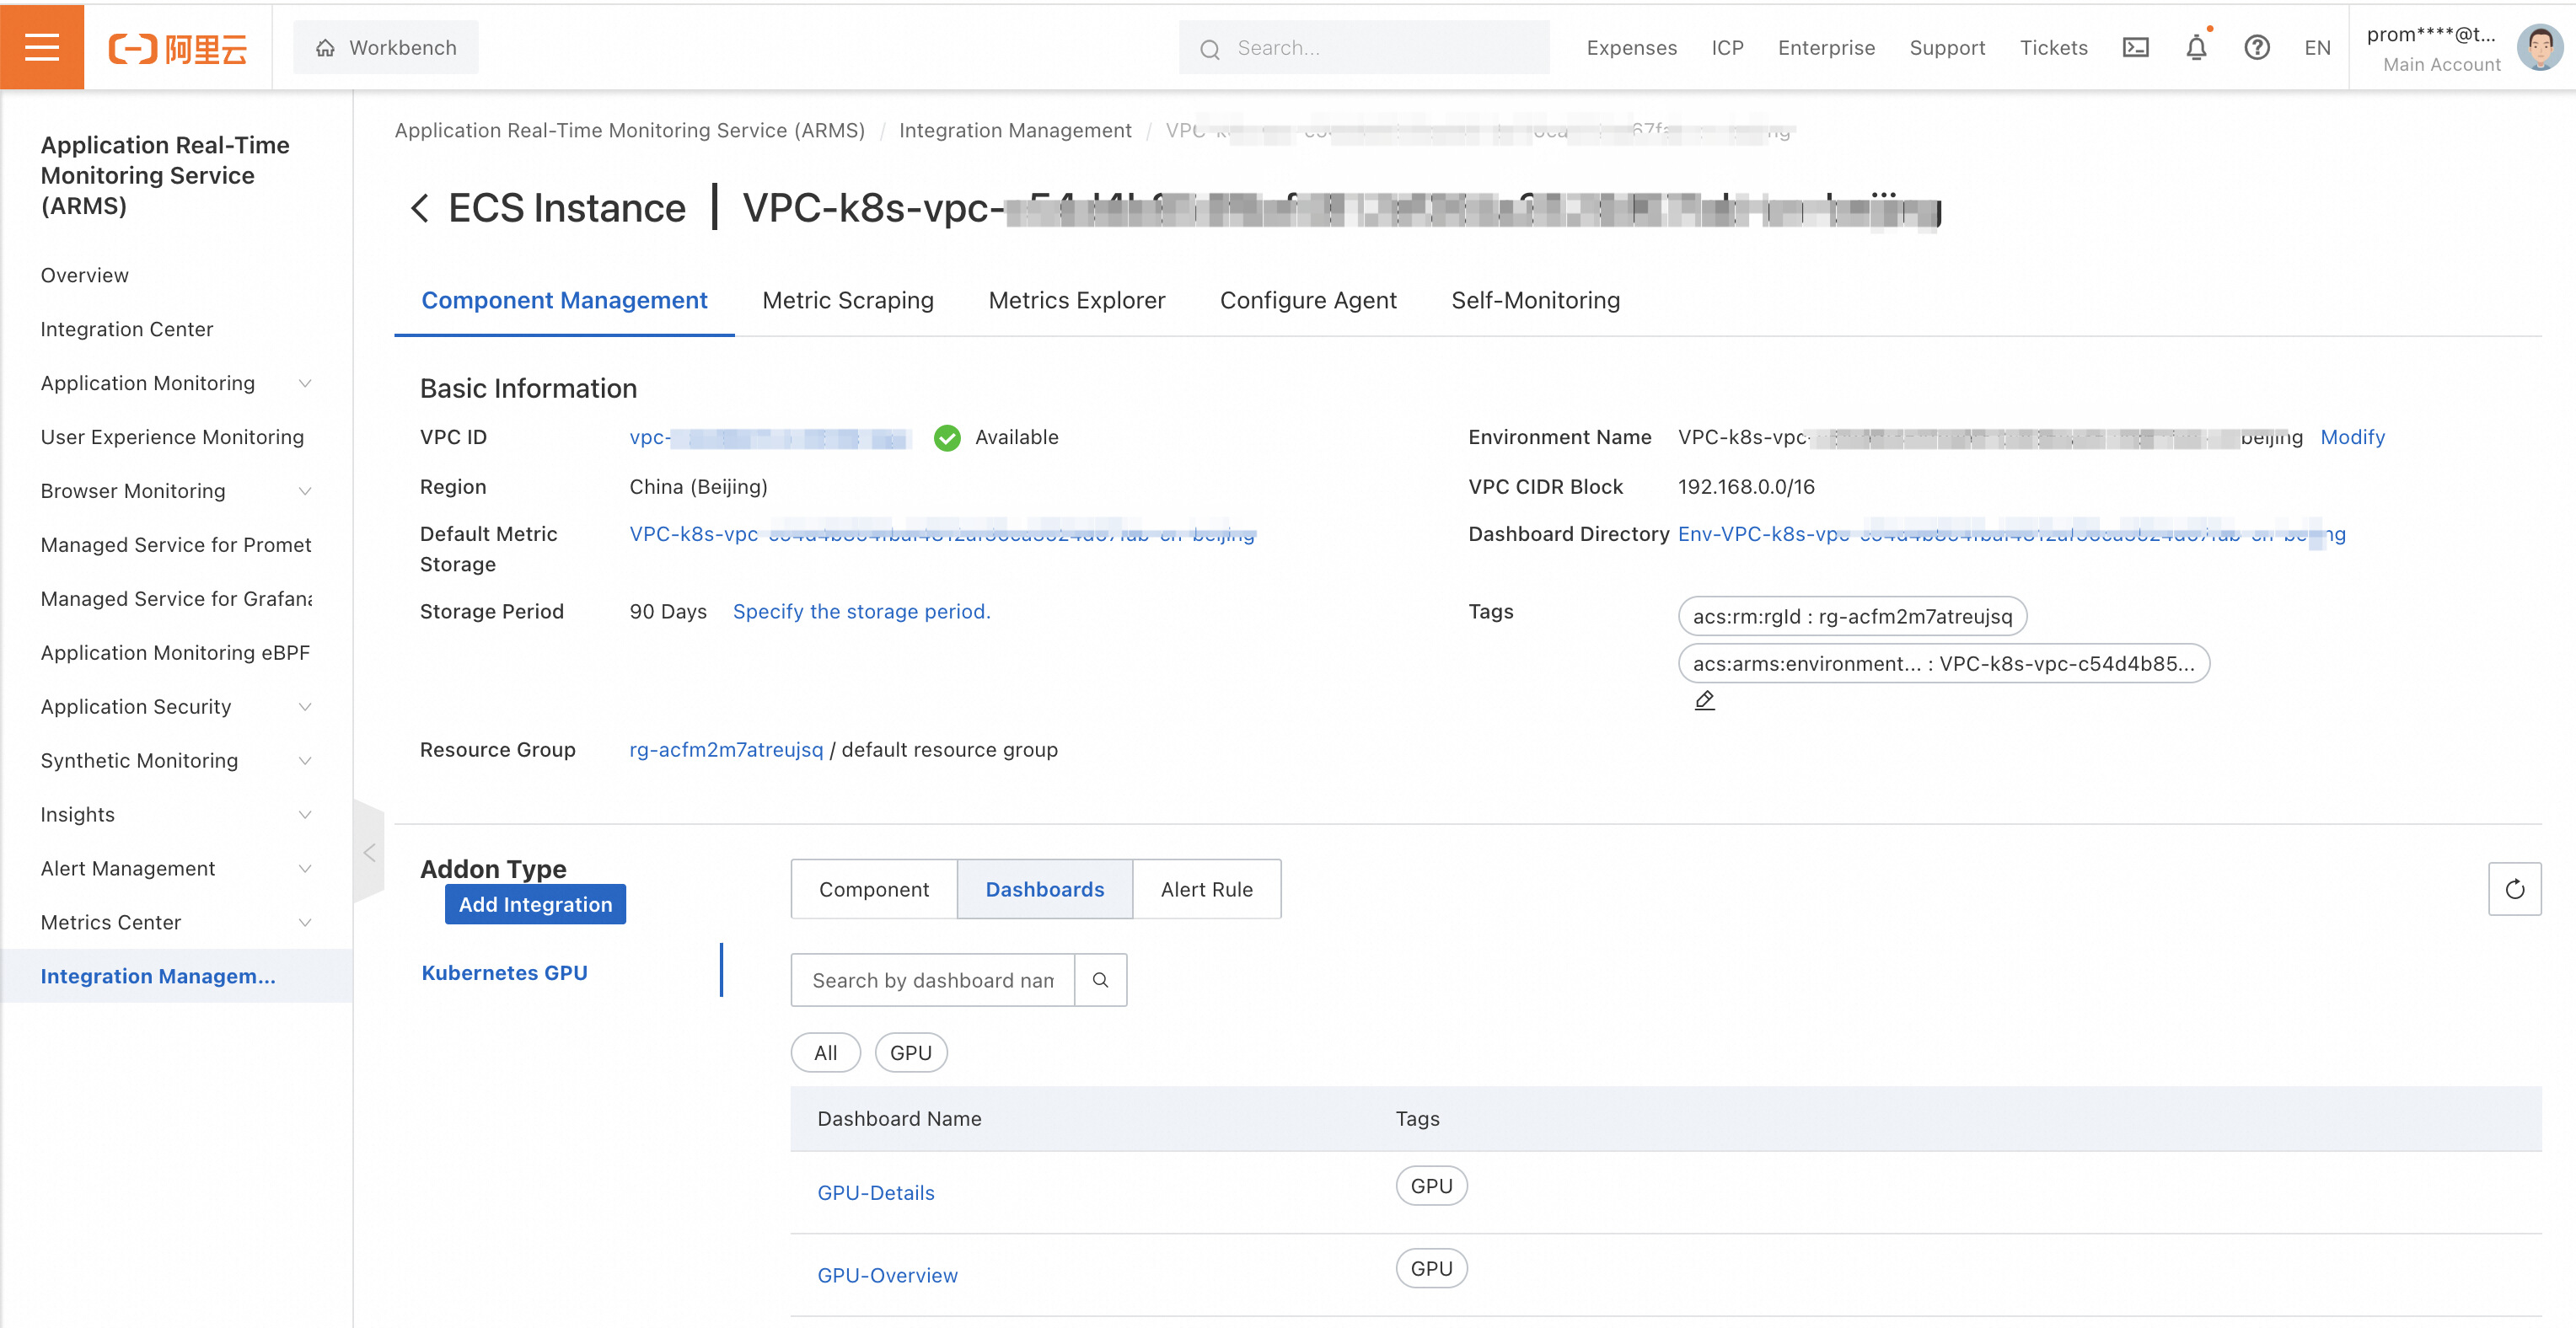
Default integration of dashboards for GPU monitoring in host monitoring
By default, the observation dashboard is integrated. Alibaba Cloud experts have preset a variety of core observation point dashboards and multiple aggregate dimension observation perspective dashboards based on practical accumulation. This is truly out-of-the-box.

ECS Overview Dashboard
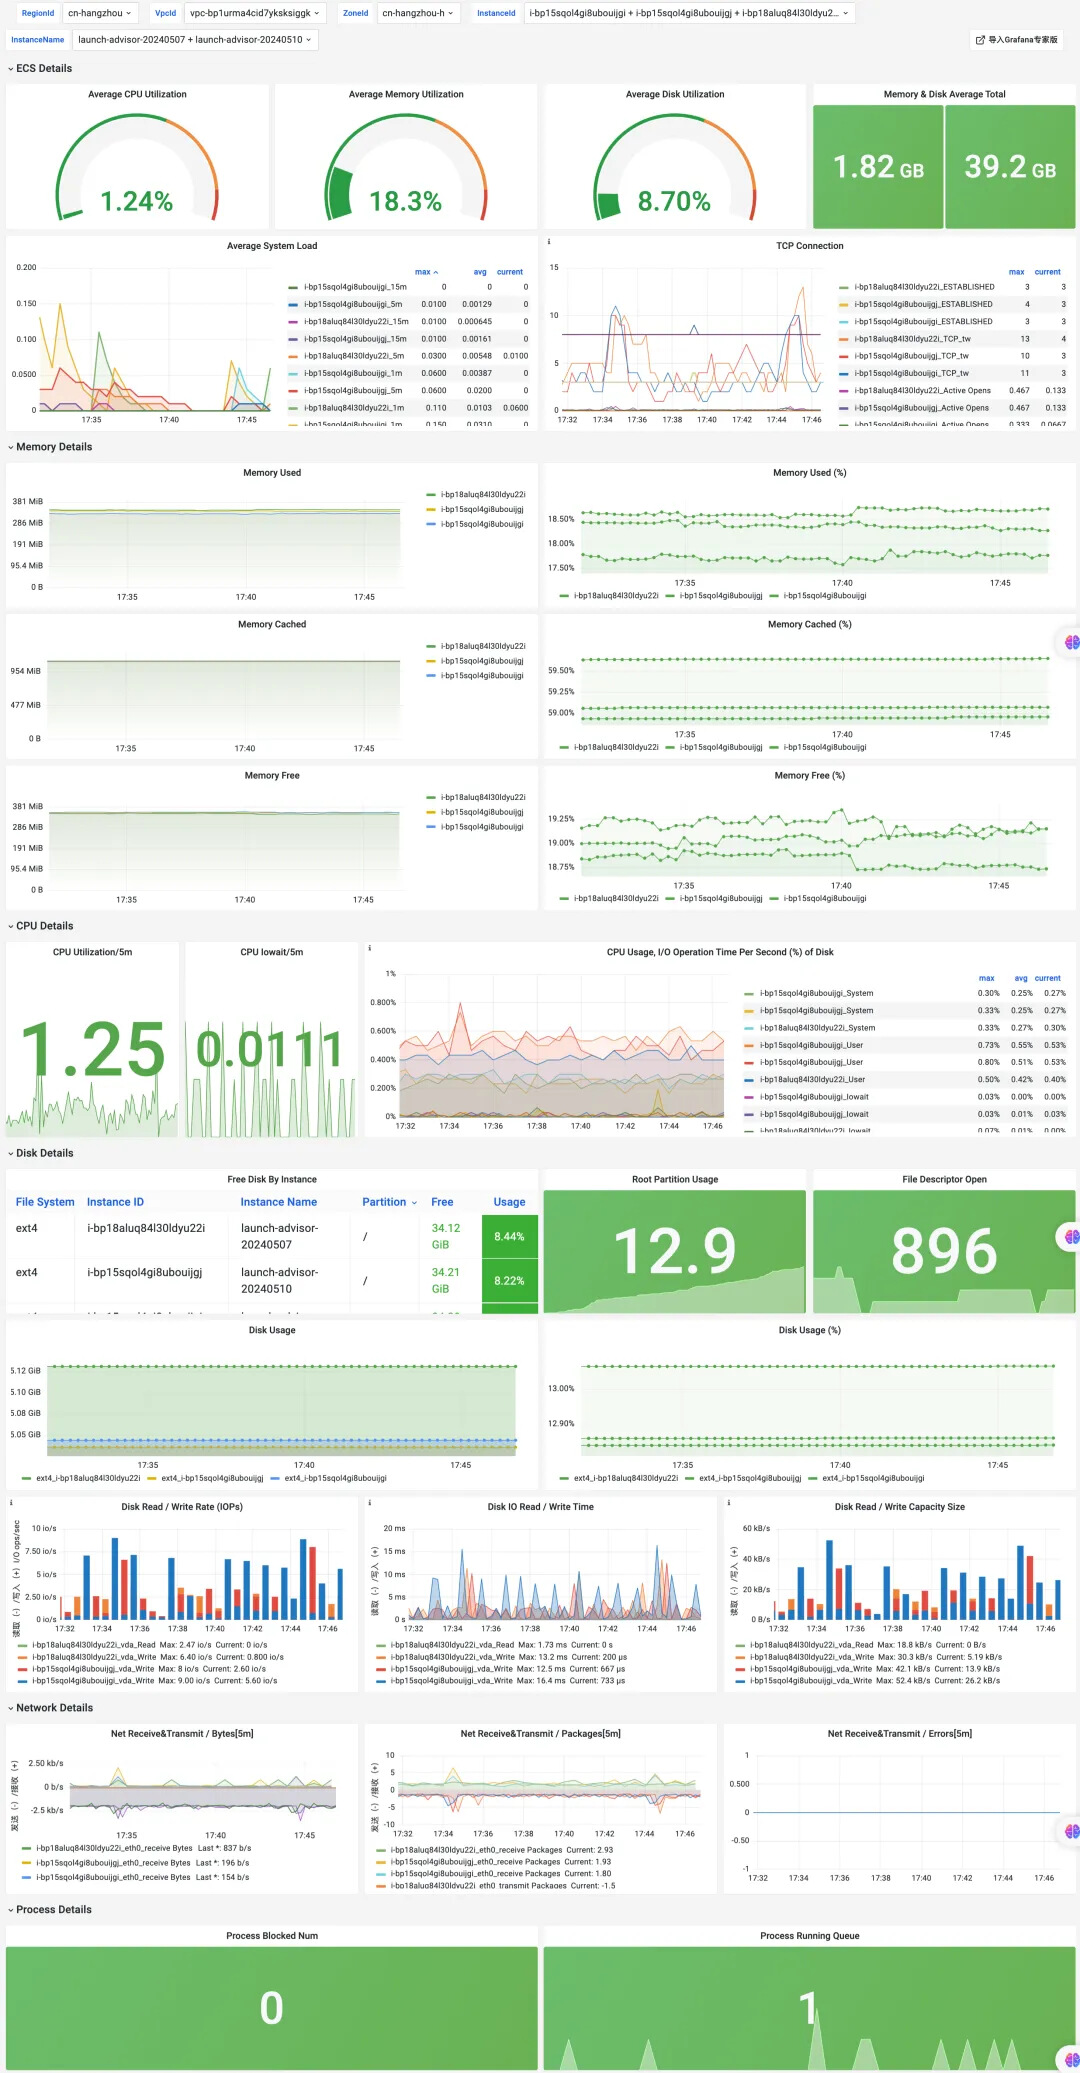
ECS Detail Dashboard

Node Process Dashboard
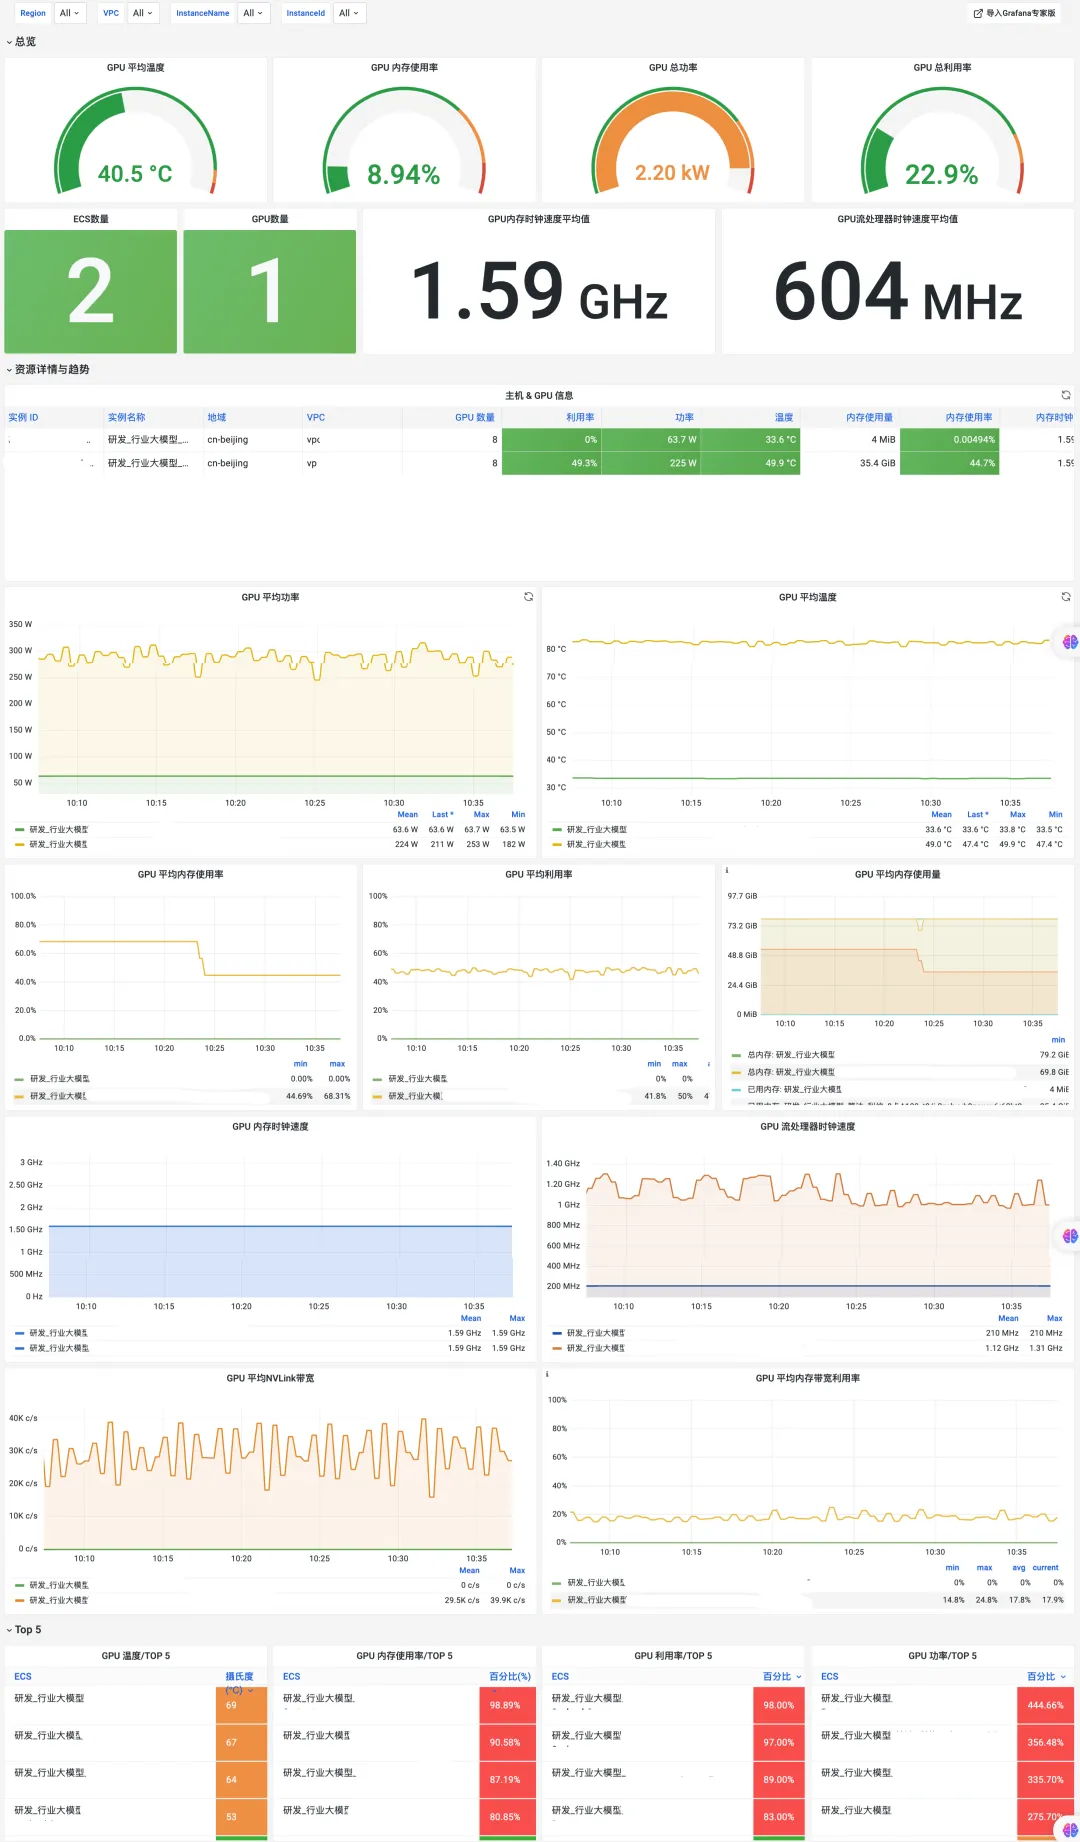
GPU Overview Dashboard
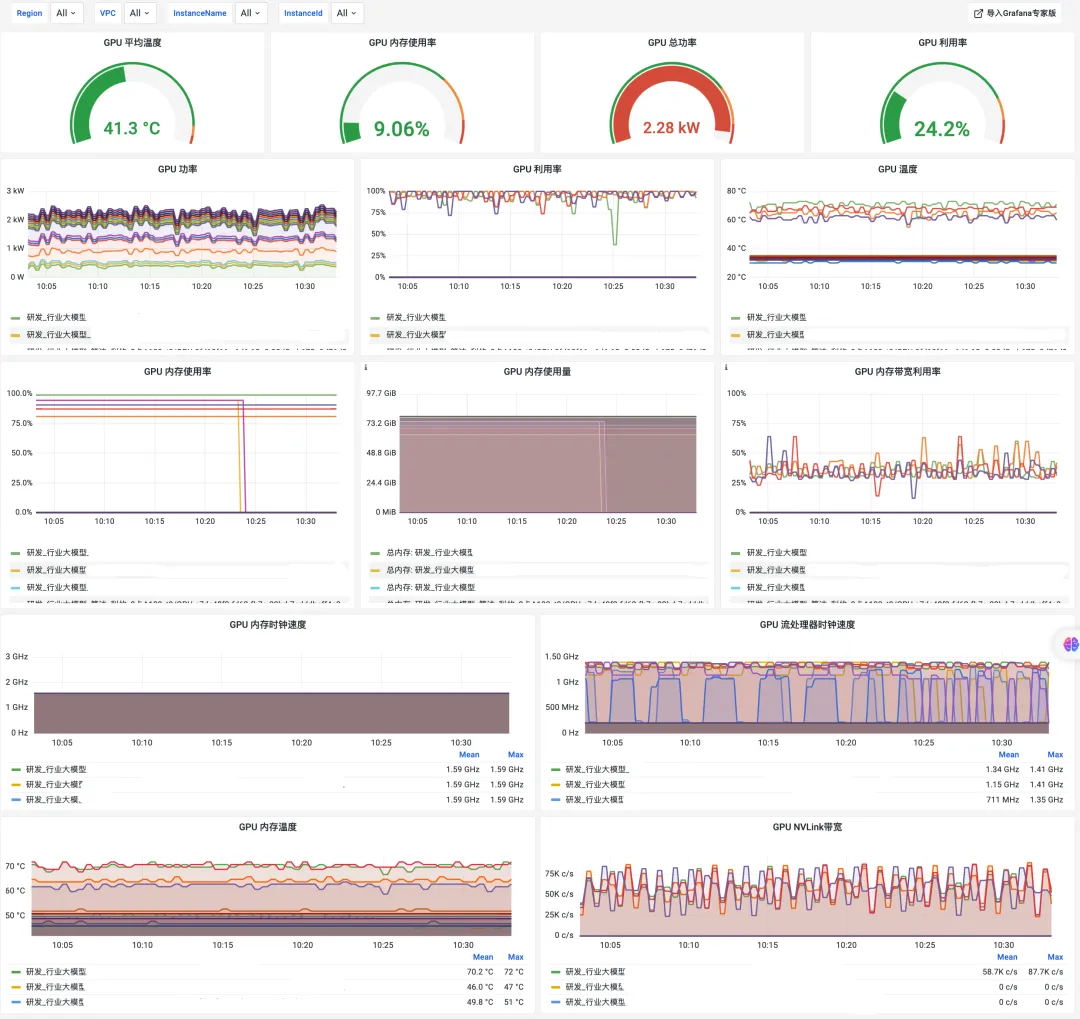
GPU Detail Dashboard
In supercomputing scenarios, with highly dynamic computing requirements and the pursuit of extreme performance, cloud computing service providers are challenged to quickly adjust resources to cope with business peaks and troughs. The host monitoring solution provided by Alibaba Cloud Prometheus actively responds to observability requirements. By enhancing its automated monitoring capabilities, it provides reliable monitoring metrics for resource optimization and cost-effectiveness improvement.
Alibaba Cloud Prometheus Host Monitor provides the following capabilities:
The preceding capabilities provide the following benefits to the host monitoring provided by Alibaba Cloud Prometheus:
In summary, the solution provided by Alibaba Cloud Prometheus Host Monitor is becoming a powerful support for managing and monitoring cloud resources in supercomputing scenarios. It not only effectively ensures the efficiency and health of cloud infrastructure, but also provides a solid foundation for enterprises to further expand their high-performance computing capabilities.

212 posts | 13 followers
FollowAlibaba Cloud Native - November 6, 2024
Alibaba Cloud Native Community - July 26, 2022
Alibaba Cloud Community - October 9, 2022
Alibaba Cloud Native Community - July 22, 2022
Alibaba Cloud Native - September 4, 2023
Alibaba Developer - April 7, 2020

212 posts | 13 followers
Follow Application Real-Time Monitoring Service
Build business monitoring capabilities with real time response based on frontend monitoring, application monitoring, and custom business monitoring capabilities
Learn More Tongyi Qianwen (Qwen)
Top-performance foundation models from Alibaba Cloud
Learn More Managed Service for Prometheus
Multi-source metrics are aggregated to monitor the status of your business and services in real time.
Learn More Global Application Acceleration Solution
This solution helps you improve and secure network and application access performance.
Learn MoreMore Posts by Alibaba Cloud Native