As cloud-native technology matures, more workloads are migrating to Kubernetes, including stateless microservices and complex stateful applications. Developers have to deal with a large number of underlying APIs to support the various infrastructures required for these applications. This creates two challenges. On the one hand, it is difficult to standardize since various workloads will form their operation and maintenance management platform, which brings about differentiation in the enterprise platform layer. On the other hand, it is too complex, which brings high threshold and stability risks.
KubeVela is an out-of-the-box modern application delivery and management platform that helps enterprises build a unified platform through a unified application model and programmable and scalable architecture. It provides differentiated and out-of-the-box platform layer capabilities for business teams in different scenarios, significantly reducing the threshold of cloud-native technologies. In addition to core technologies (such as cloud resource delivery, application management, multi-cluster, and workflow), KubeVela provides full-stack declarative observability to help business developers flexibly customize and easily gain insight into various complex cloud-native workloads.
This article focuses on KubeVela's observability system and introduces the observability challenges and KubeVela's solutions in the cloud-native era.
Typically, the O&M team will master the usage scenarios of the business team and then connect the infrastructure that runs application services with various observability infrastructures to provide observability for the upper-layer business. A series of processes (such as collecting metrics, collecting logs, aggregation processing, and chart analysis) are combined through fixed scripts and systems. As such, the bottom-level running state is fed back to the monitoring and alert system in real-time, which provides early warning for the operation and maintenance team and the upper-level business team. It can detect exceptions and troubleshoots in the first place.
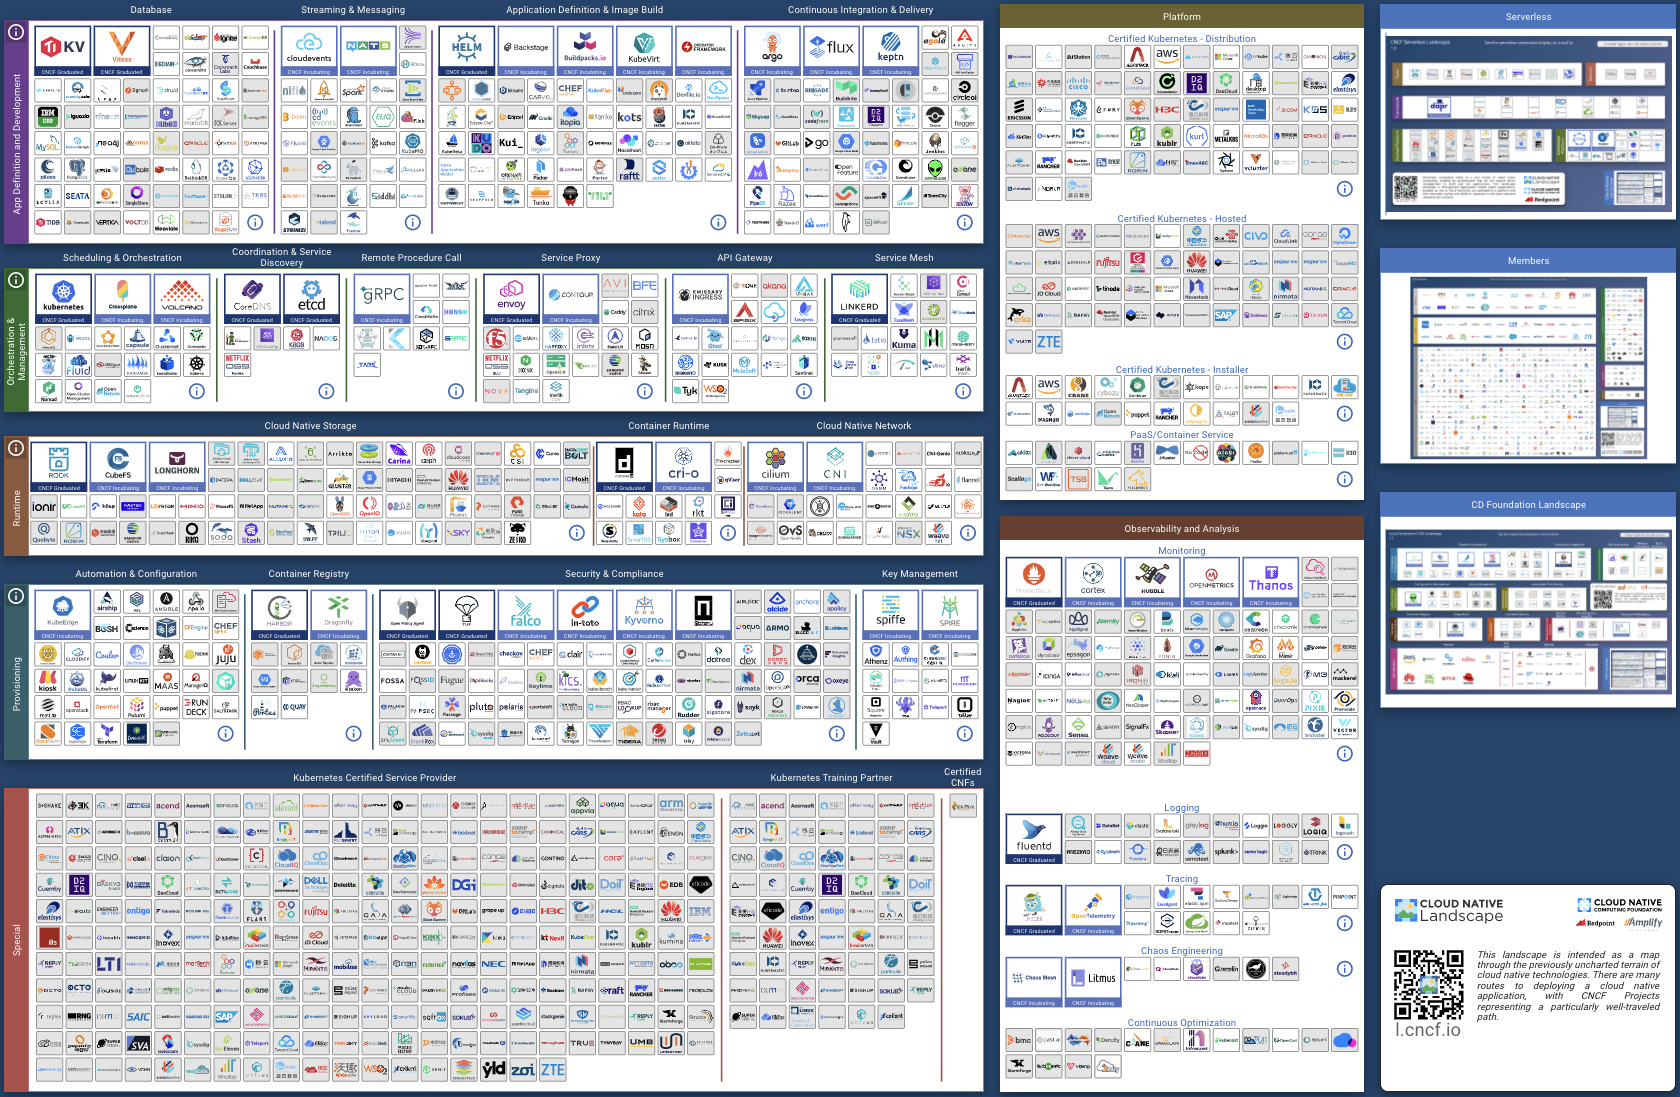
Figure 1: CNCF Landscape's Addons Have Surpassed 1000, with New Ones Added Every Day.
With the continuous prosperity of the cloud-native ecosystem, the concept of platform engineering has become well-known. A basic platform team often needs to serve multiple microservice business teams at the upper level, and the architecture of the business team has become diversified with the enrichment of infrastructure. This breaks the traditional from mastering to hard coding observability system construction path. For example, the business team may use the basic ingress as the service gateway when it starts to build the business. After half a year, it may switch to the istio-based traffic governance solution as the requirements become more complicated, which means the observability related to the API and the upper layer architecture will change accordingly. As shown in Figure 1, in the prosperous ecosystem of the CNCF landscape, multiple replacement schemes can be found in each sub-domain. The traditional fixed construction of the observability system is no longer applicable. The platform team needs to flexibly customize and scale out observability solutions based on the architecture of the business layer.
Separation is the second big challenge in the observability field, which is usually reflected in three dimensions. The first dimension is the separation of data between different businesses. Different departments of an enterprise usually adopt different monitoring solutions, from infrastructure (computing, storage, and network), containers, and applications to business, from mobile, frontend, and backend to database and cloud services. As a result, monitoring data forms isolated islands and cannot be interconnected. The second dimension is the separation of different infrastructure configurations. With the advent of the cloud era, enterprises are faced with multi-cloud, multi-cluster, and multi-account management. Observability data is distributed in different clouds and clusters. The observability of multi-cloud and multi-cluster cannot be configured uniformly. The third dimension is data link separation. For example, Prometheus (Exporter) and Grafana in the open-source community have thriving communities. However, their collection sources and dashboards are often not well connected. One end often outputs a large amount of invalid data, which occupies storage resources, while the other end displays data with errors or high latency.
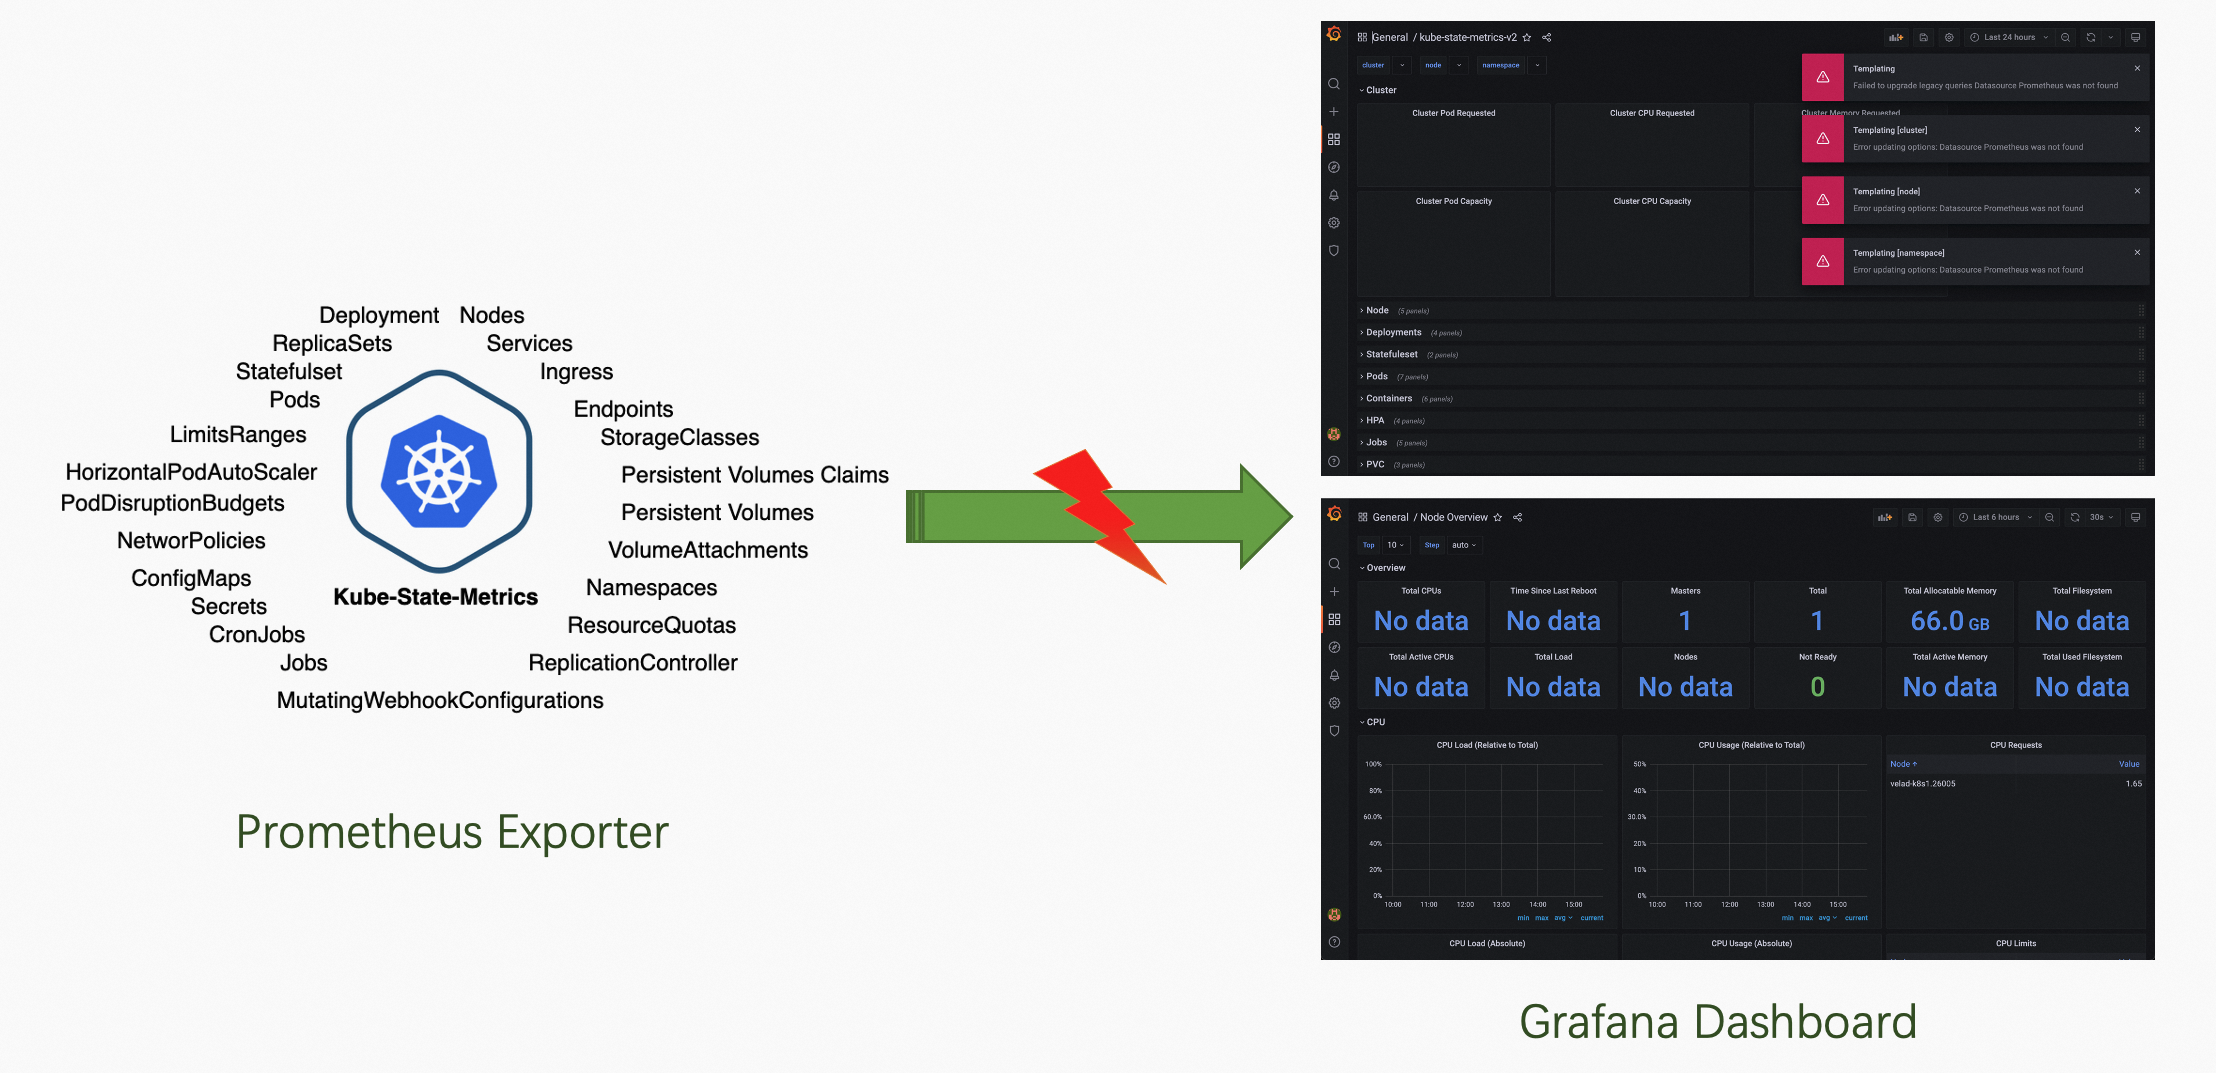
Figure 2: The Corresponding Dashboard and Exporter Found by the Community are Not Directly Available.
However, the configuration method based on graphical interface clicks used by the traditional monitoring system is no longer applicable. Although it is simple to use, the migration and replication costs are high. Under multi-cluster management, monitoring configurations are not easy to copy, and missed collection and configuration are common. It is difficult to bind with the configuration delivered by the application, and it is impossible to realize the active change of monitoring with the application lifecycle.
If we follow the concept of cloud-native declarative unified API, we will find that we need a set of declarative configuration methods. Thus, we can connect observability infrastructure in a unified and flexible way, connect in series, and customize a full set of observabilities as needed. We can automatically complete the multi-environment unified distribution and management of monitoring probe installation, collection, storage, display, alert, and other configurations. We can also call this pattern Full Stack Observability as Code.
Observability in the cloud-native era has many challenges. However, thanks to the development of cloud-native open-source technologies, observability infrastructures (such as Prometheus, Grafana, and OpenTelemetry) are becoming the de facto standards in their respective fields. The integration of surrounding ecosystems is accumulating, which makes it possible to unify observability infrastructures. Selecting these open-source projects to build observability solutions has become a natural choice, which helps us unify technology and data and allows us to leverage the ecosystem to meet the needs of business scenarios quickly.
A key challenge is how to make the capabilities of the observability infrastructure declarative. You may easily think of the Kubernetes custom resource definition (CRD) operator technology. A considerable part of observability can directly use declarative APIs (such as CRD). For example, Prometheus can obtain the ServiceMonitor declarative API through the installation of Prometheus-Operator. However, there are some other projects (such as Grafana) and a large number of cloud services that do not have mature CRD operators. It is difficult to write a CRD operator for each service. It is time-consuming, labor-intensive, and consumes additional pod resources. The overall cost is high.
Is there a way to automatically convert the APIs of these services into declarative APIs that conform to the Kubernetes standard? The Kubernetes Aggregated API Server (AA) solves this problem by developing a REST service that conforms to the Kubernetes API specification. It registers to the Kubernetes apiserver through APIService objects, thus scaling out the types of requests that the Kubernetes apiserver can handle. Compared with the CRD + Operator mode, the AA mode provides a unified API with CRD, but the processing process is not final-state oriented. It can provide synchronous request processing with high flexibility and interactivity. The disadvantage of the AA mode is that it cannot tune retries and needs to cooperate with additional means to do final state retries for abnormal states (such as errors).
The Prism project in KubeVela is a service that converts third-party APIs into Kubernetes standard APIs based on the AA model. It connects to Kubernetes's AA mechanism, provides a unified Kubernetes API upward, and connects to Grafana's APIs downward, integrating operations (such as data source creation and dashboard import) into the YAML operations that Kubernetes users are accustomed to using. For example, if you want to query the existing Grafana Dashboard on Kubernetes, you can use the kubectl get grafanadashboard command to call the GrafanaDashboard resource of the Kubernetes API. After the request passes through Prism, the request will be converted to the Grafana API. The query result will be converted to the native GrafanaDashboard resource again through Prism. This way, the user can get the same usage experience as operating native resources (such as Deployment and Configmap).

Figure 3: KubeVela Supports Multiple Ways to Access Observability Infrastructure by Providing Native APIs and Addon Systems
As shown in Figure 3, Prism is like a bridge. It can connect the differences between three different deployment modes: user-created, automatic installation using KubeVela addons, and cloud services. Moreover, since AA mode does not require data to be stored in etcd, we can use Grafana's storage as the Source of Truth, which means whether users operate in Kubernetes API, through Grafana's API, or through Grafana's UI to make changes, the corresponding changes can be immediately reflected on various clients. In terms of permission processing, the Grafana API has been mapped to native Kubernetes resources through KubeVela Prism. Therefore, users can rely on the RBAC permission control system of Kubernetes to adjust the access permissions of different Kubernetes users on Grafana data without worrying about data penetration and leakage.
For error retries unavailable in the AA mode, the KubeVela controller can tune the return status of the Kubernetes API based on the lifecycle of the application. This way, the final state declarative processing mode is achieved.
When the capabilities of the infrastructure can be described in a unified way through the Kubernetes API, we still have two core problems to solve.
These two core issues correspond to the design principles that KubeVela has adhered to.
Specifically, KubeVela developers or platform O&M personnel can use CUELang to write various customized Definition description files to define observability scenarios in IaC mode (such as collecting metrics, collecting logs, creating data sources, and importing data to a dashboard). Business developers only need to select these ready-made modules (usually defined as O&M Trait or WorkflowStep) to bind application configurations.
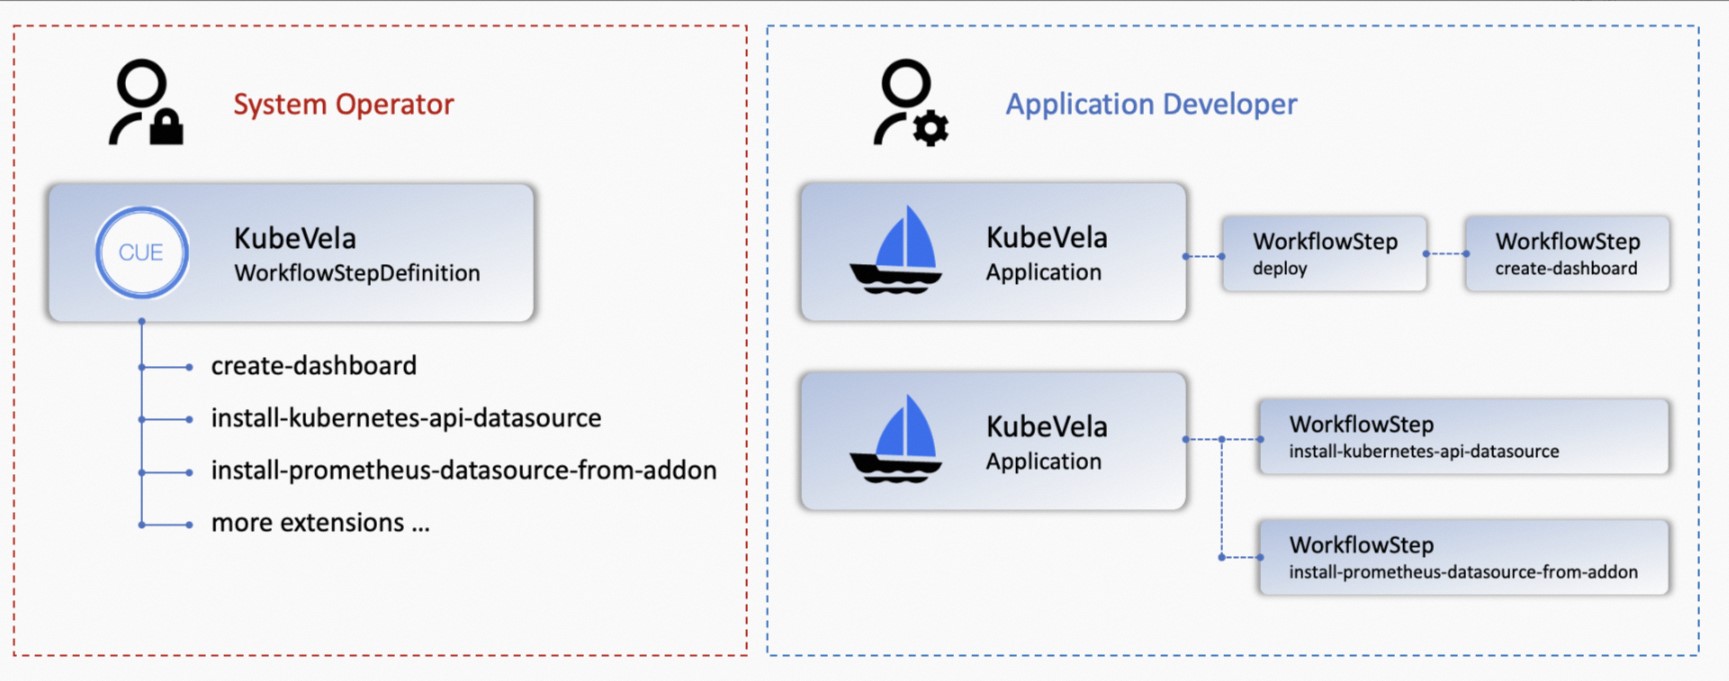
Figure 4: Scaling out Modular Pluggable Application Observability with KubeVela's X-Definition System
As shown in Figure 5, the end user of KubeVela describes the metrics and log collection information when describing the application. At the same time, the workflow step defines how to create an observability dashboard after the deployment is completed. The orchestration process is automatically performed by the KubeVela controller. The orchestration process includes the sequential execution of the process, the binding of observability APIs and workload APIs, unified versions and tags, status check and exception retry, multi-cluster management, and resource consistency in the final state. More importantly, KubeVela provides a good balance between scalability and ease of use. End users can flexibly select different observability modules and do not need to care about the configuration details of the underlying parameters.
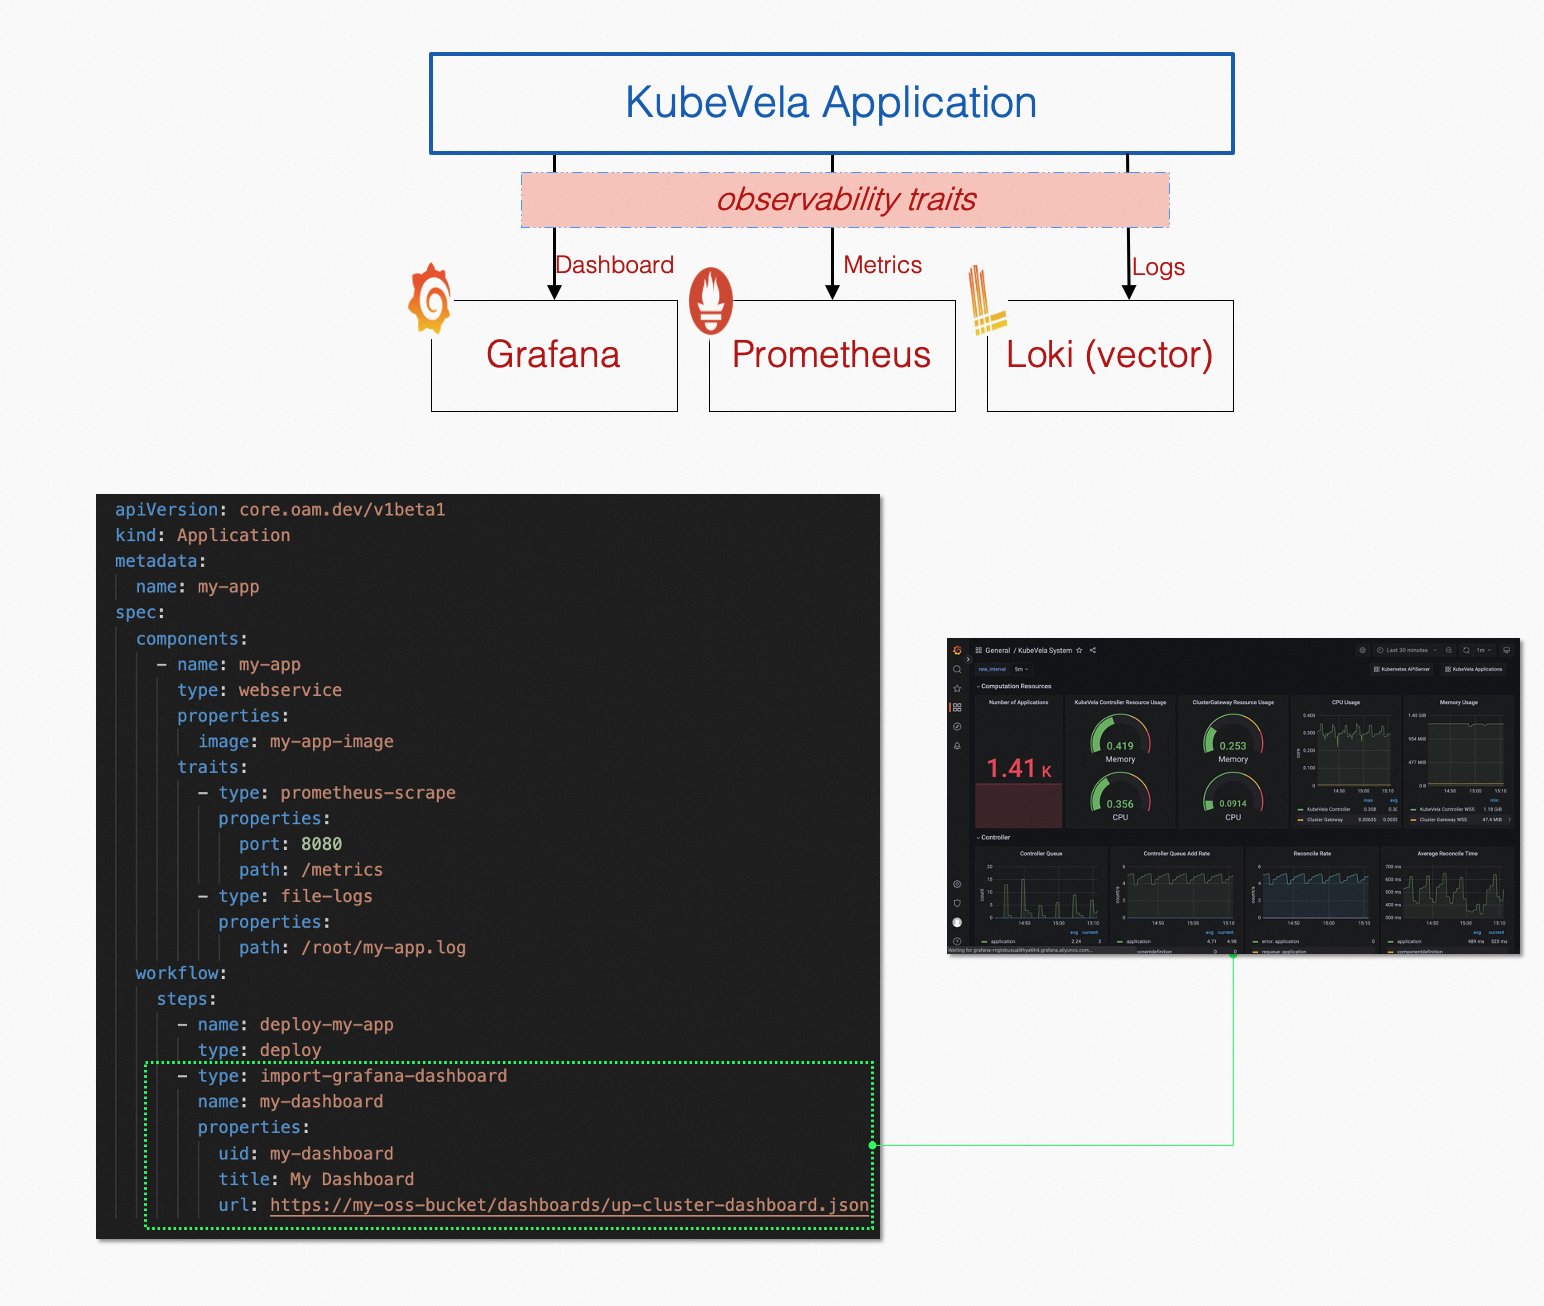
Figure 5: Full Stack Observability as Code around Applications
KubeVela naturally supports the multi-cluster and hybrid cloud requirements of modern applications. Therefore, when we meet the requirements for delivering declarative observability through unified applications, we can use the capabilities of KubeVela multi-cluster delivery to meet the unified configuration of multi-cluster and hybrid cloud observability. As shown in Figure 6, we can configure different observability requirements for different clusters.
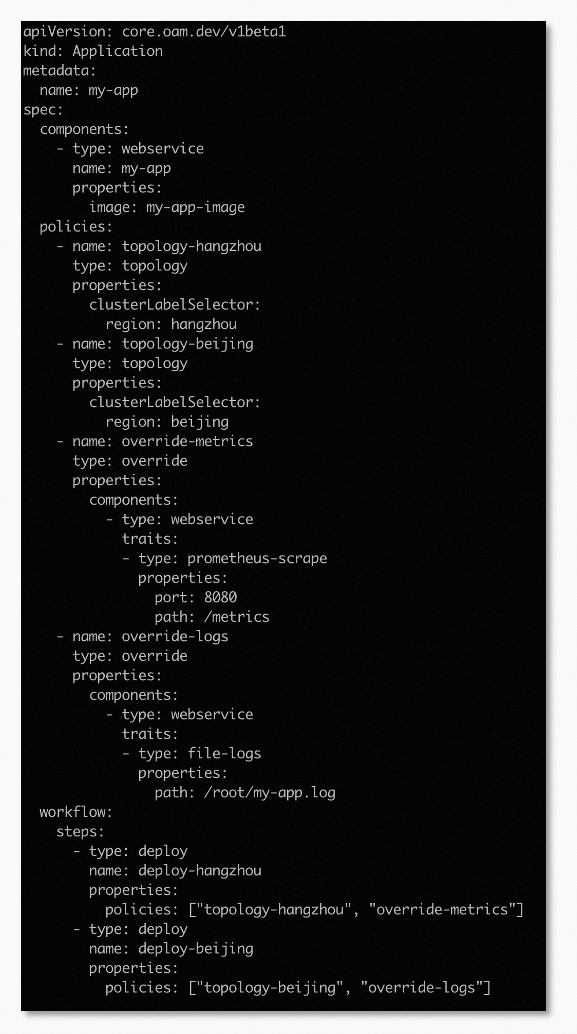
Figure 6: Differentiated Observability Configuration and Unified Delivery for Multi-Cluster/Hybrid Cloud
In addition to being highly customizable, KubeVela's observability can be connected to the observability services of cloud vendors through a unified interface. Let’s use an example of metric collection. If a Prometheus instance already exists in your system or you use the Prometheus service provided by a cloud vendor (such as Alibaba Cloud ARMS), you can register a Grafana data source to connect the Prometheus instance to the Grafana monitoring dashboard. The Grafana API provided by KubeVela Prism allows you to create GrafanaDatasource resources in native mode. Applications on KubeVela can use grafana-datasource to manage data source configurations.
On the other hand, if another Grafana instance already exists in your system, you can register the existing Grafana instance in the KubeVela system using the grafana-access component. After integration, KubeVela applications can use grafana-dashboard components to configure and manage monitoring dashboards as application resources.
At this point, we can see that a Full Stack Observability as Code solution has been formed. We have made a large number of out-of-the-box observability for core scenarios in Kubernetes based on flexible customization and scalability to improve user experience. On the other hand, the highly scalable architecture of the KubeVela microkernel can quickly scale out the surrounding ecosystem through the addon mechanism. We have made observability into addons, which can obtain a smooth installation experience.
Next, let's look at the use process from three aspects: access, use, and customization.
In KubeVela, users can either build an observability system from scratch or connect an existing observability infrastructure with the KubeVela system.
KubeVela users built from scratch can quickly install the required addons into their Kubernetes environment with a few simple lines of vela addon enable statements and naturally support the multi-cluster architecture. That means, if you have multiple clusters to manage, KubeVela allows you to easily install the same configuration and services into all clusters. You can also install some required services or some clusters. Please see the official documentation for more information. Figure 7 shows the process:

Figure 7: Installing the Observability Addon in Multiple Clusters
The observability addon officially supported by KubeVela has covered the fields of metrics, logs, and visualization. It provides an out-of-the-box deployment method for O&M personnel and application developers and seamlessly connects with existing self-built infrastructure and SaaS services provided by cloud vendors. The observability addon of KubeVela provides highly customizable solutions for various scenarios to simplify user start-up costs and improve user experience. For example, in multi-cluster scenarios, the Prometheus Addon of KubeVela provides a Thanos-based distributed collection deployment solution to provide the same experience as single-cluster scenarios. The Loki Addon of KubeVela provides a variety of agent collection solutions in the log field (including Promtail and Vector), supplemented by O&M tools (such as vector-controller) to help O&M personnel obtain the same experience in log configuration as Kubernetes native resources. The official documentation contains a more detailed introduction.
The observability infrastructure provided by KubeVela provides a series of built-in monitoring dashboards, which allows you to monitor and maintain the running status of KubeVela and its applications from two different dimensions: system and application.
In terms of the system dimension, the built-in Kubernetes System Monitoring displays the status of each cluster controlled by KubeVela from the perspective of basic clusters, including the Kubernetes APIServer load, request volume, response latency, etcd storage volume, and other metrics. These metrics can help users quickly find the abnormal status of the entire system or troubleshoot the cause of slow system response.
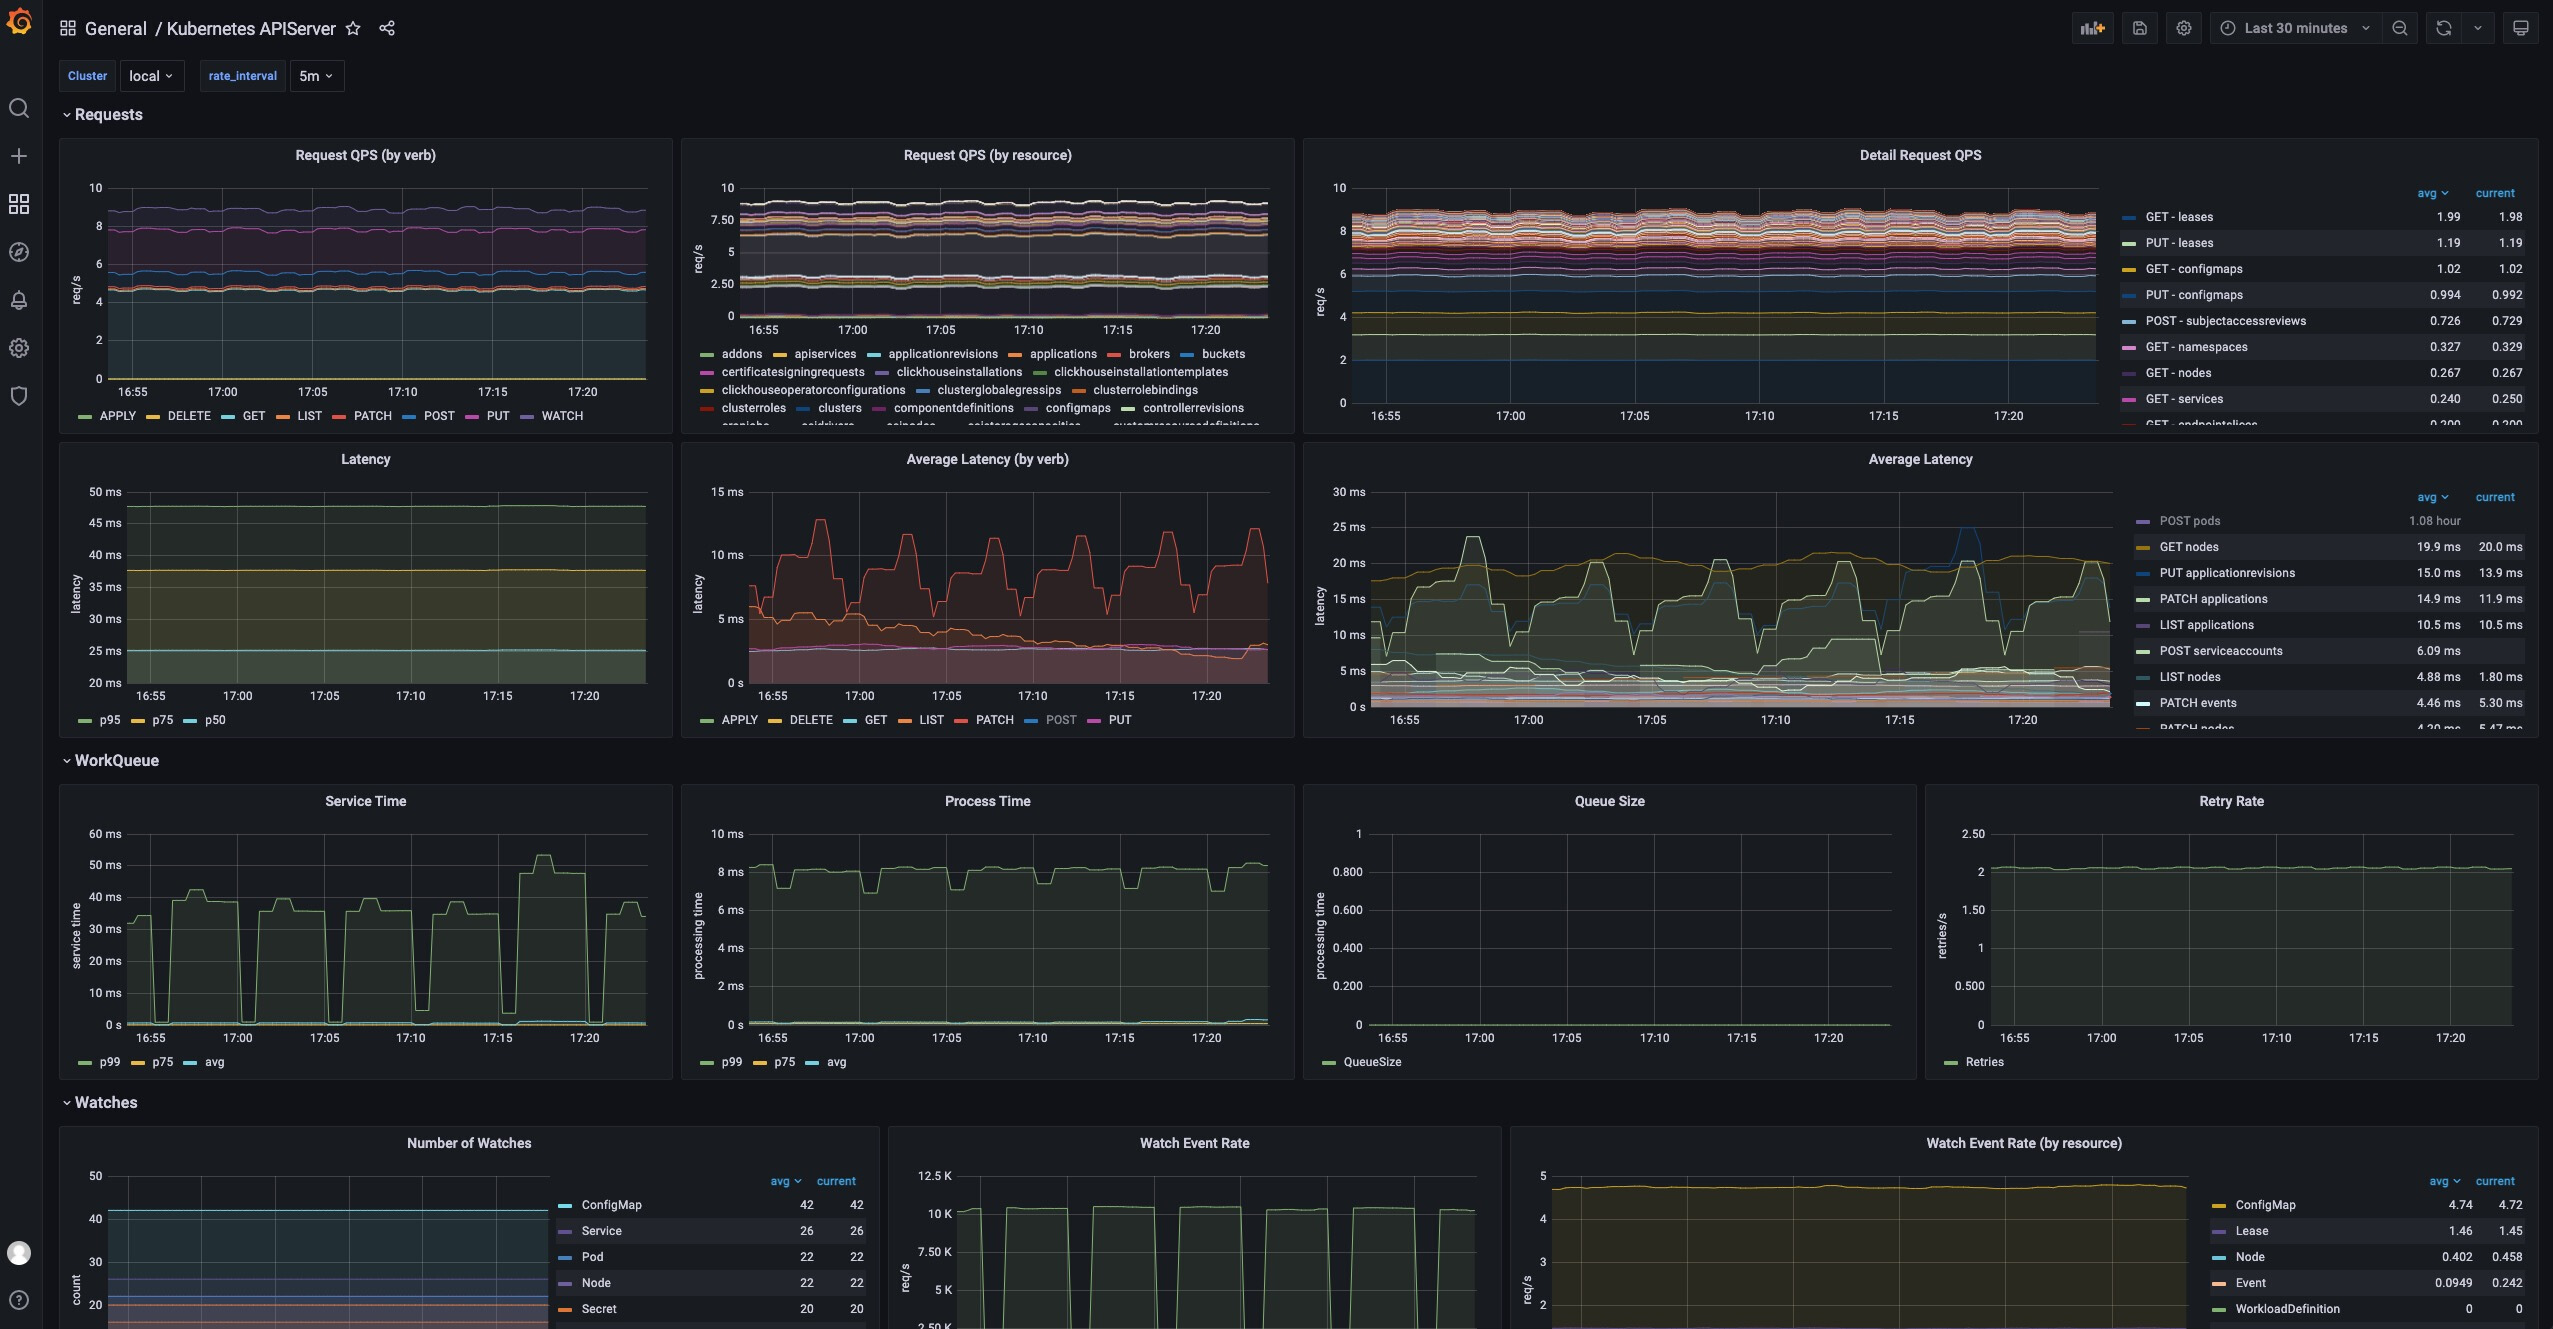
Figure 8: Kubernetes System Monitoring Dashboard
On the other hand, KubeVela has a built-in monitoring dashboard for its controller system. This dashboard is widely used in various KubeVela system stress tests to check the load status and bottlenecks of the controller performance. For example, if the processing queue of the controller starts to accumulate, it indicates that the current controller cannot cope with such a large number of application requests, and the accumulation for a long time will cause the application to be unprocessed in time. You can troubleshoot the causes based on resource usage, resource request latency, and the latency of different types of operations. You can also optimize the causes based on the monitoring performance.

Figure 9: KubeVela System Monitoring Dashboard
In addition to the system dashboard, KubeVela has a built-in basic data visualization interface for applications, an observability interface for native workload resources (such as deployments), and an observability interface for scenarios (such as Nginx log analysis), as shown in Figure 10-12. These Dashboards provide common monitoring metrics for applications. This allows O&M personnel to troubleshoot common risks (such as insufficient application resources and configuration errors). In the future, the monitoring dashboard of more basic resource types will be inherited from the built-in monitoring system.

Figure 10: Visual Interface of the KubeVela Application

Figure 11: Monitoring Dashboard of Deployment Resources
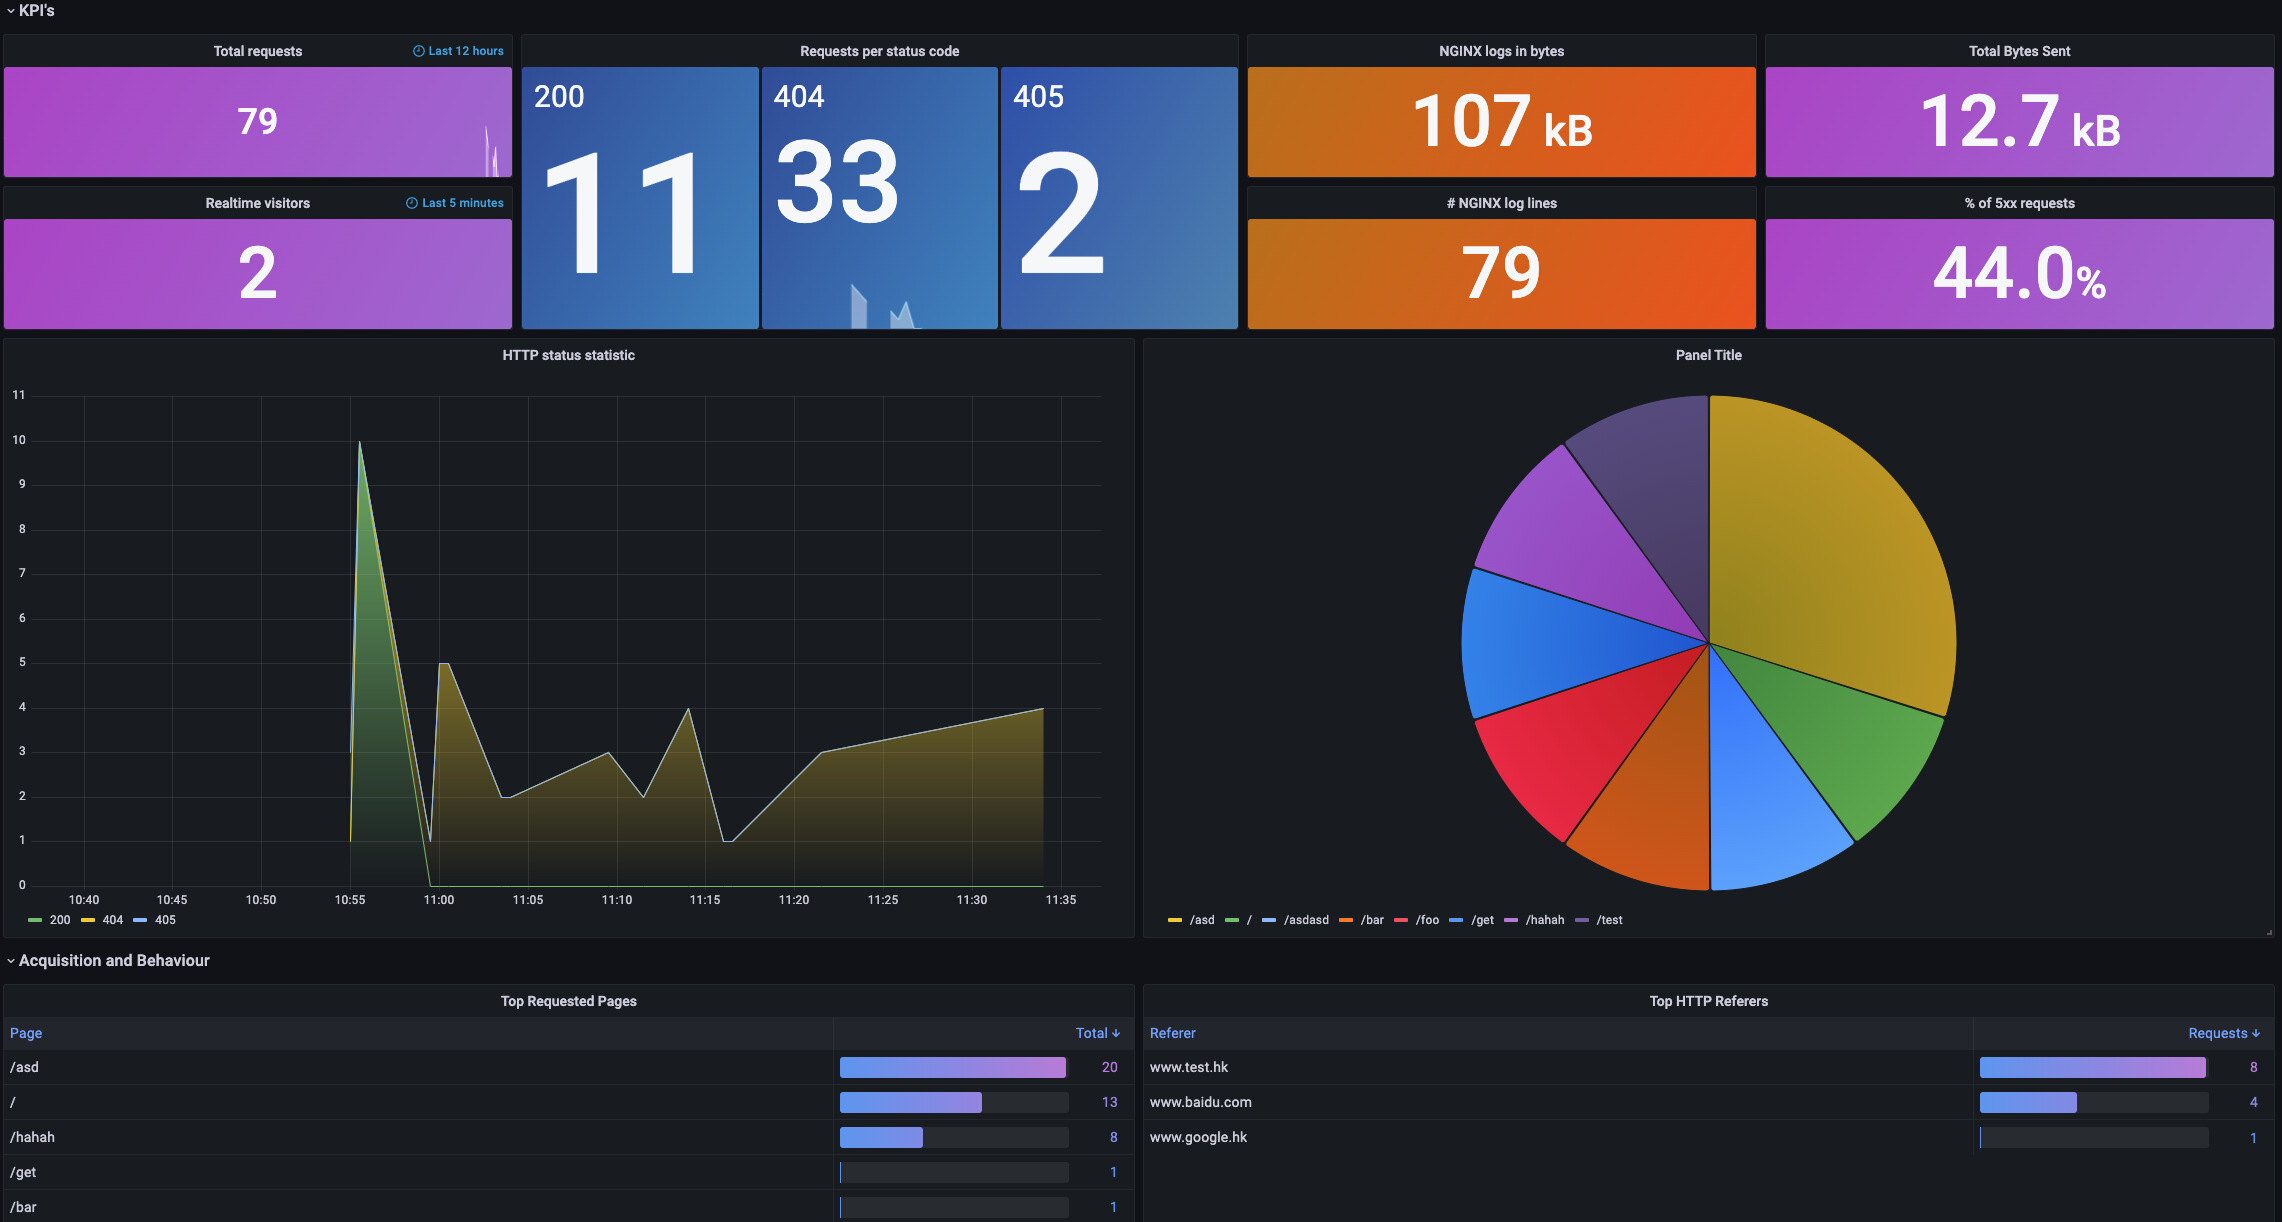
Figure 12: Analysis Dashboard Based on Nginx Logs
In addition to the series of built-in monitoring provided by the KubeVela addon system, KubeVela users can customize their observability system in a variety of ways. For example, you can configure RecordingRules or AlertingRules for a Prometheus instance to enhance the capabilities of Prometheus, providing pre-aggregation and alert ability. The configuration of these rules can be used to easily synchronize multiple clusters and perform differentiated configurations in the KubeVela system.
On the other hand, O&M personnel can write CUE to develop the workflow steps of KubeVela, providing developers with convenient application monitoring automation generation capabilities. As such, application developers can focus on the metrics or running status of the function or business itself and do not need to care about how these metrics are collected, stored, and displayed on the monitoring dashboard.
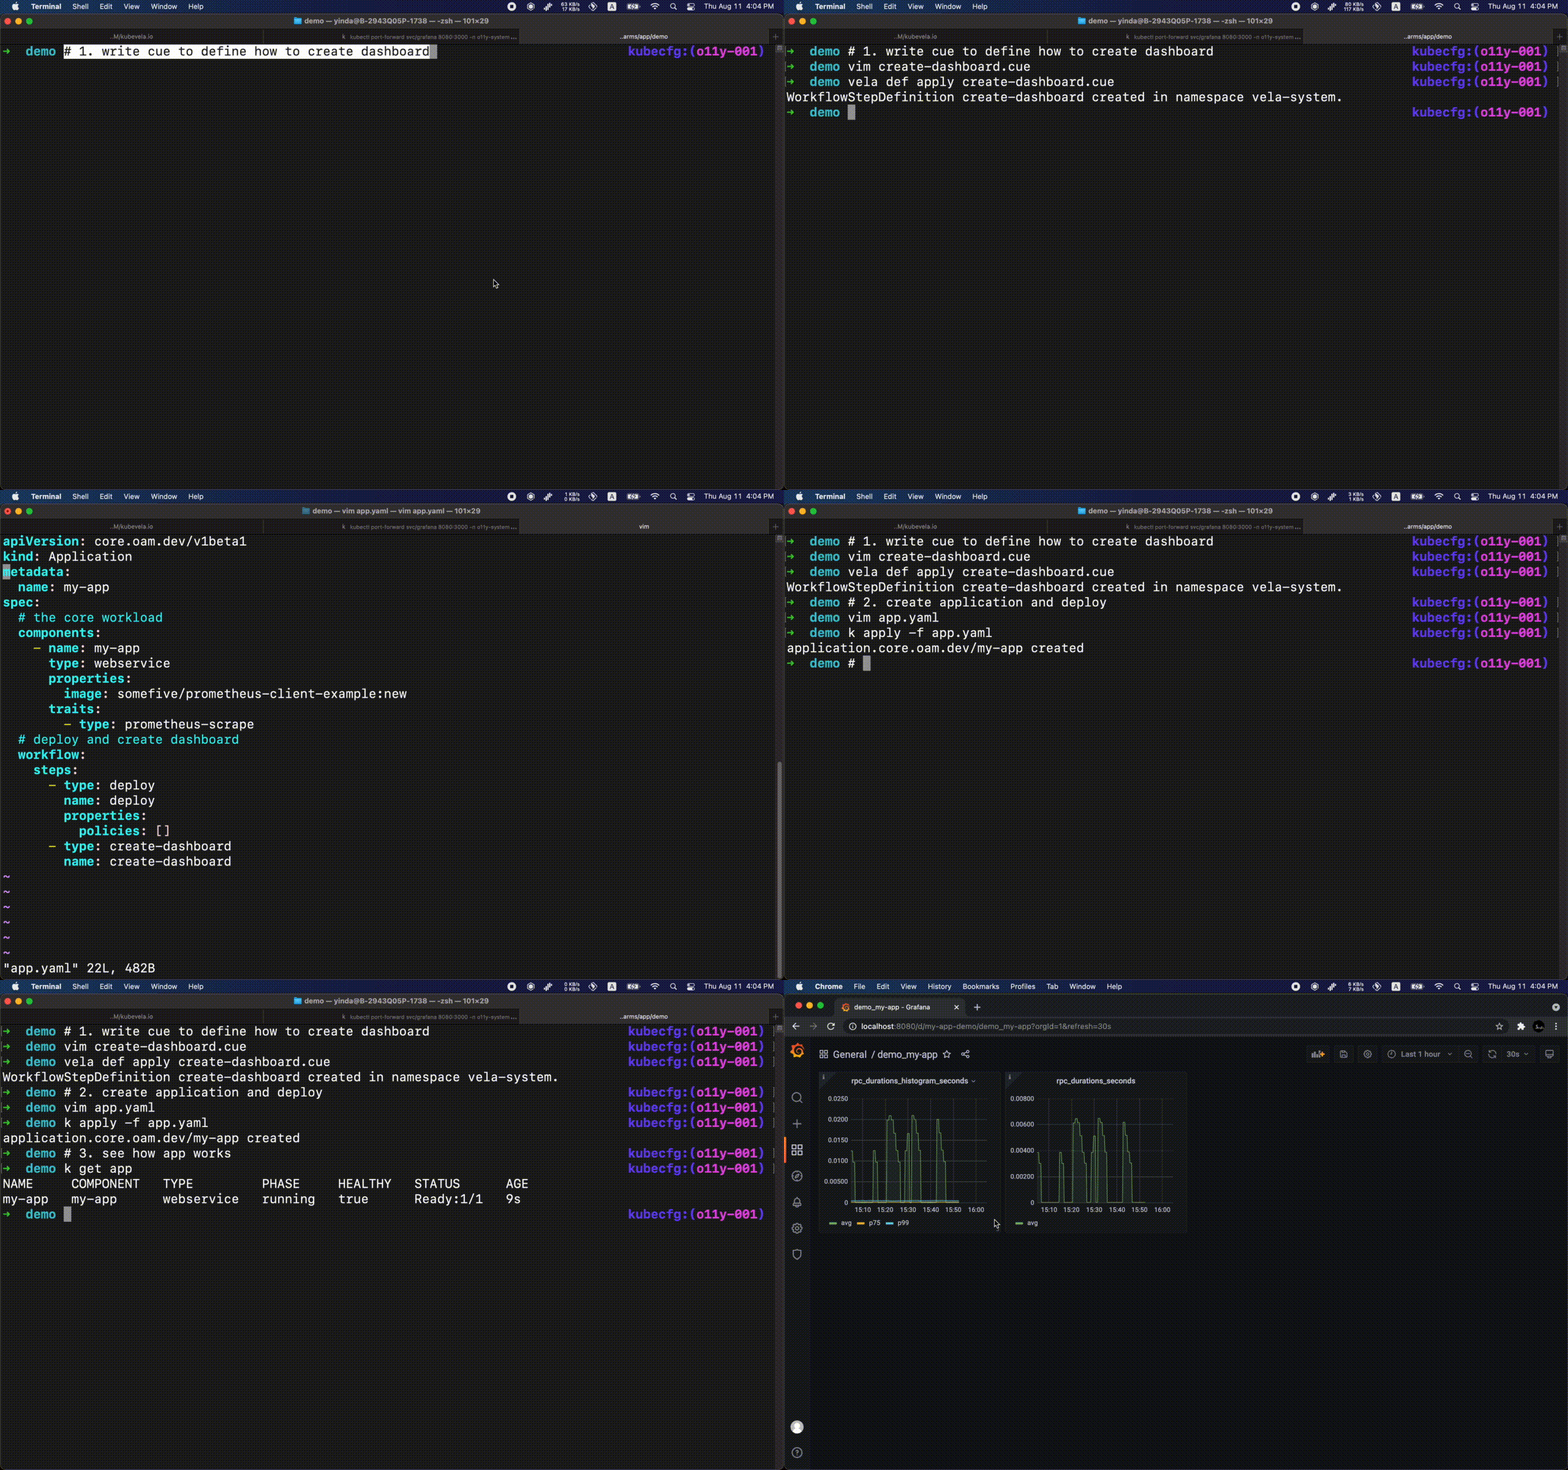
Figure 13: Automatically Creating the Corresponding Grafana Monitoring Dashboard after the KubeVela Application Is Deployed.
Please see the official documentation for more information about custom features.
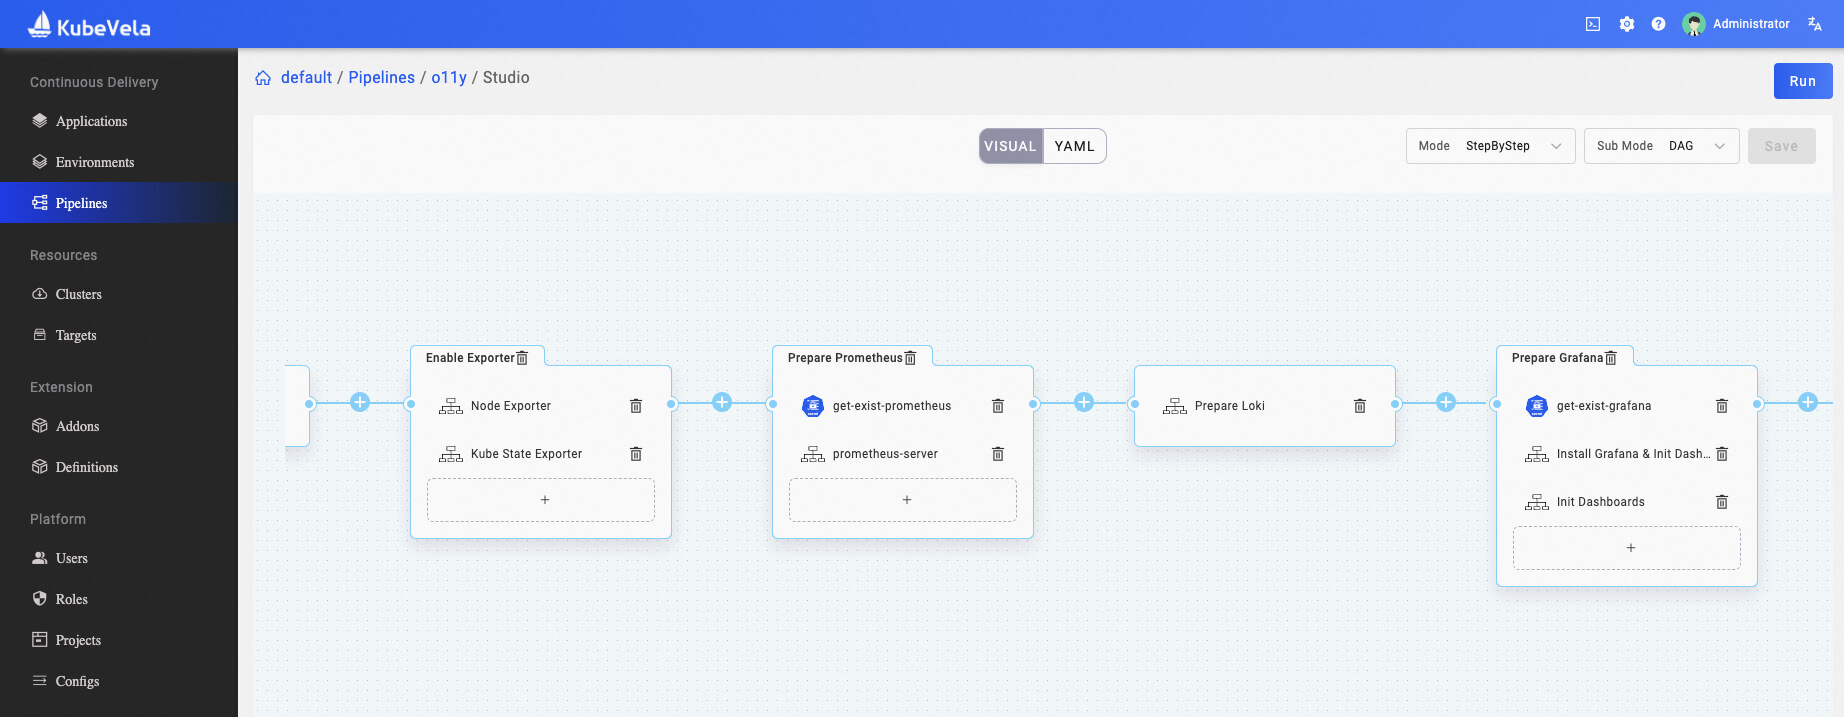
Figure 14: Orchestrating Your Observability Infrastructure with KubeVela Pipeline
In addition to the customization and scalability of observability addons, you can use KubeVela Pipeline to orchestrate the observability infrastructure and configurations you need and connect to existing services. KubeVela Pipeline can help you connect complex and lengthy orchestration processes to achieve convenient and fast one-click deployment.
The observability system is the cornerstone of system stability. In the cloud-native era, complex and diverse application services and corresponding observability requirements also put forward higher requirements for collaboration between O&M and development teams. The KubeVela Full Stack Observability as Code proposed in this article allows you to automatically build an application-oriented observability system. This reduces the burden on development teams to understand infrastructure usage and the need for O&M teams to understand upper-layer business logic. Ideally, the development team does not need to understand the arrangement of the underlying resources. They only need to declare the services to be deployed and the metrics to focus on in the configuration file. Then, they can see the deployment status of the services and the corresponding business metrics on the corresponding infrastructure. The O&M team does not need to know the specific content of service and business metrics. They only need to focus on the running status and common metrics of underlying resources.
Currently, KubeVela's built-in observability system focuses on the collection and presentation of various metrics and logs. In the future, KubeVela will further integrate observability technologies (such as application probes) into the addon system to provide users with convenient installation, management, and user experience. In addition, the current KubeVela system supports the use of workflow steps to automate application monitoring discovery and report generation. The KubeVela team will continue exploring Dashboard as Code and summarizing best practices for automated deployment to promote the integration of observability and application models.
Da Yin (a KubeVela Maintainer and Alibaba Cloud Senior Engineer) is deeply involved in the construction of KubeVela's core ability systems (such as hybrid-cloud multi-cluster management, scalable workflow, and observability).

692 posts | 56 followers
FollowAlibaba Cloud Community - April 21, 2023
Alibaba Cloud Native Community - November 11, 2022
Alibaba Cloud Native - November 3, 2022
Alibaba Cloud Native Community - January 9, 2023
Alibaba Cloud Native Community - February 9, 2023
Alibaba Cloud Native Community - June 21, 2022

692 posts | 56 followers
Follow Bastionhost
A unified, efficient, and secure platform that provides cloud-based O&M, access control, and operation audit.
Learn More Managed Service for Grafana
Managed Service for Grafana displays a large amount of data in real time to provide an overview of business and O&M monitoring.
Learn More Simple Log Service
An all-in-one service for log-type data
Learn More Cloud-Native Applications Management Solution
Accelerate and secure the development, deployment, and management of containerized applications cost-effectively.
Learn MoreMore Posts by Alibaba Cloud Native Community