This topic describes how to use the Simple Log Service (SLS) SDK for Python to upload logs to a logstore, use the console for visual analytics, and configure alerts for log exceptions.
Prerequisites
An ECS instance is available. For more information, see Elastic Compute Service quick start.
SLS is activated. For more information, see Activate Simple Log Service.
Python is installed along with a Python development environment (such as PyCharm).
The SLS Python SDK supports the following Python versions:
Python 2: 2.7 and later
Python 3: 3.7 and later
Pypy2: 2.7 and later
Pypy3: 3.7 and later
Solution overview

In this topic, you will learn the following:
Create a project, which is a resource management unit, and a logstore, which is a log storage unit.
Use the Python SDK to upload logs to a logstore, create an index, and then query and analyze the logs.
Visualize analysis results by creating charts on a dashboard.
Configure alert rules for alerting and monitoring.
Delete unnecessary resources to avoid incurring charges.
1. Create a project and logstore
1.1 Create a project
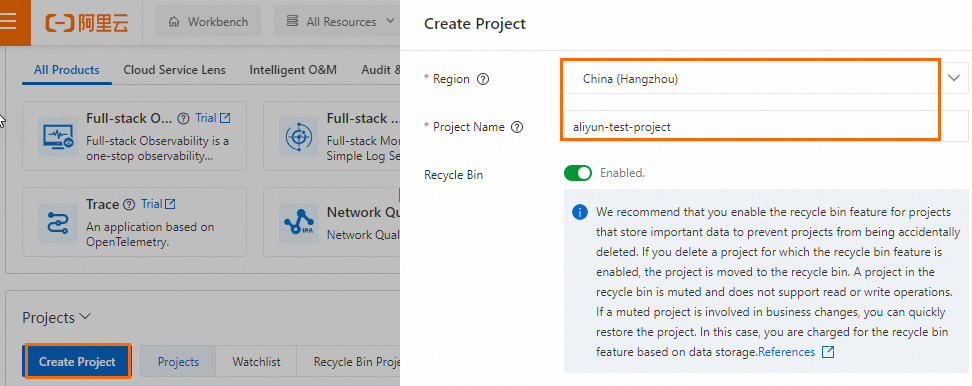
Log on to the Simple Log Service console. In the Projects section, click Create Project. In the Create Project dialog box, specify the Region and enter a Project Name. This topic uses a project named aliyun-test-project in the China (Hangzhou) region as an example. Leave the other parameters at their default values.
1.2 Create a logstore
After the project is created, you will be prompted to create a logstore. In the Create Logstore panel. Enter a Logstore Name and leave the other parameters at their default values.
2. Install the SDK
In the command-line interface (CLI), run the following command as an administrator to install the Python SDK. For more information about versions, see Aliyun Log Python Release.
pip install -U aliyun-log-python-sdkAfter the SDK is installed, run the following command to verify the installation.
pip show aliyun-log-python-sdkIf the following information is returned, the SDK is installed.
Name: aliyun-log-python-sdk
Version: 0.9.12
Summary: Aliyun log service Python client SDK
Home-page: https://github.com/aliyun/aliyun-log-python-sdk
Author: Aliyun
3. Initialize the client
LogClient is the client for SLS. It provides methods to create projects and logstores, and write and read logs. To initialize the client using an AccessKey pair (V1 signature), perform the following steps:
Obtain an AccessKey pair: Create an AccessKey pair in the Alibaba Cloud Management Console to obtain the
access_key_idandaccess_key_secret.Configure environment variables: Configure the keys as environment variables, such as
ALIBABA_CLOUD_ACCESS_KEY_IDandALIBABA_CLOUD_ACCESS_KEY_SECRET, based on your operating system (Linux, macOS, or Windows).Set the endpoint: This topic uses the China (Hangzhou) region as an example, so the
endpointis set tocn-hangzhou.log.aliyuncs.com. For other regions, replace the value with the corresponding Endpoint.
# Import the sls package.
from aliyun.log import *

# Import for retrieving environment variables.
import os

# Obtain an AccessKey ID and an AccessKey secret from environment variables.
access_key_id = os.environ.get('ALIBABA_CLOUD_ACCESS_KEY_ID', '')
access_key_secret = os.environ.get('ALIBABA_CLOUD_ACCESS_KEY_SECRET', '')

# The SLS endpoint.
endpoint = "cn-hangzhou.log.aliyuncs.com"

# Create a LogClient instance.
client = LogClient(endpoint, access_key_id, access_key_secret)
4. Upload logs
In this example, upload log data by calling the put_logs interface. The following code provides a raw log example:
10.0.*.1 - - [14/Jul/2025:12:00:03 +0000] "POST /login HTTP/1.1" 302 0 "http://example.com/login.html" "Mozilla/5.0 (X11; Linux x86_64) AppleWebKit/537.36 (KHTML, like Gecko) Chrome/100.0.4896.88 Safari/537.36" When you upload logs using the put_logs API operation, specify the log content by field to facilitate subsequent log analysis.
# The name of the project.
project_name = "aliyun-test-project"
# The name of the logstore.
logstore_name = "aliyun-test-logstore"

# Write data to the logstore.
def put_logs():
    print("ready to put logs for %s" % logstore_name)
    log_group = []
    for i in range(0, 100):
        log_item = LogItem()
        # Set the log content by field.
        contents = [
            ('remote_addr', '192.168.0.%d' % (i % 255)),
            ('remote_user', 'user%d' % i),
            ('time_local', time.strftime('%d/%b/%Y:%H:%M:%S +0000', time.gmtime())),
            ('request_method', 'GET' if i % 2 == 0 else 'POST'),
            ('request_uri', '/index.html' if i % 3 == 0 else '/api/data'),
            ('status', str(200 + (i % 100))),  # The status code is between 200 and 299.
            ('body_bytes_sent', str(1024 + i)),
            ('http_referer', 'http://example.com/page%d' % (i // 10)),
            ('http_user_agent',
             'Mozilla/5.0 AppleWebKit/537.36 (KHTML, like Gecko) Chrome/90.0.%d Safari/537.36' % (i * 10))
        ]
        log_item.set_contents(contents)
        log_group.append(log_item)
    request = PutLogsRequest(project_name, logstore_name, "", "", log_group, compress=False)
    client.put_logs(request)
    print("put logs for %s success " % logstore_name)
    time.sleep(60)
5. Create an index
Before querying the uploaded logs, you must configure indexes. Set the remote_addr, remote_user, time_local, request_method, request_uri, status, body_bytes_sent, http_referer, and http_user_agent fields as index fields.
# The name of the project.
project_name = "aliyun-test-project"
# The name of the logstore.
logstore_name = "aliyun-test-logstore"
# The indexes.
logstore_index = {'line': {
'token': [',', ' ', "'", '"', ';', '=', '(', ')', '[', ']', '{', '}', '?', '@', '&', '<', '>', '/', ':', '\n', '\t',
'\r'], 'caseSensitive': False, 'chn': False},
'keys': {'remote_addr': {'type': 'text', 'token': [',', ' ', "'", '"', ';', '=', '(', ')', '[', ']', '{', '}', '?', '@', '&', '<', '>', '/', ':', '\n', '\t', '\r'], 'caseSensitive': False, 'alias': 'remote_addr', 'doc_value': True, 'chn': False},
'remote_user': {'type': 'text', 'token': [',', ' ', "'", '"', ';', '=', '(', ')', '[', ']', '{', '}', '?', '@', '&', '<', '>', '/', ':', '\n', '\t', '\r'], 'caseSensitive': False, 'alias': 'remote_user', 'doc_value': True, 'chn': False},
'time_local': {'type': 'text', 'token': [',', ' ', "'", '"', ';', '=', '(', ')', '[', ']', '{', '}', '?', '@', '&', '<', '>', '/', ':', '\n', '\t', '\r'], 'caseSensitive': False, 'alias': 'time_local', 'doc_value': True, 'chn': False},
'request_method': {'type': 'text', 'token': [',', ' ', "'", '"', ';', '=', '(', ')', '[', ']', '{', '}', '?', '@', '&', '<', '>', '/', ':', '\n', '\t', '\r'], 'caseSensitive': False, 'alias': 'request_method', 'doc_value': True, 'chn': False},
'request_uri': {'type': 'text', 'token': [',', ' ', "'", '"', ';', '=', '(', ')', '[', ']', '{', '}', '?', '@', '&', '<', '>', '/', ':', '\n', '\t', '\r'], 'caseSensitive': False, 'alias': 'request_uri', 'doc_value': True, 'chn': False},
'status': {'type': 'long', 'alias': 'status', 'doc_value': True},
'body_bytes_sent': {'type': 'long', 'alias': 'body_bytes_sent', 'doc_value': True},
'http_referer': {'type': 'text', 'token': [',', ' ', "'", '"', ';', '=', '(', ')', '[', ']', '{', '}', '?', '@', '&', '<', '>', '/', ':', '\n', '\t', '\r'], 'caseSensitive': False, 'alias': 'http_referer', 'doc_value': True, 'chn': False},
'http_user_agent': {'type': 'text', 'token': [',', ' ', "'", '"', ';', '=', '(', ')', '[', ']', '{', '}', '?', '@', '&', '<', '>', '/', ':', '\n', '\t', '\r'], 'caseSensitive': False, 'alias': 'http_user_agent', 'doc_value': True, 'chn': False}}}
# Create indexes.
def create_index():
print("ready to create index for %s" % logstore_name)
index_config = IndexConfig()
index_config.from_json(logstore_index)
client.create_index(project_name, logstore_name, index_config)
print("create index for %s success " % logstore_name)
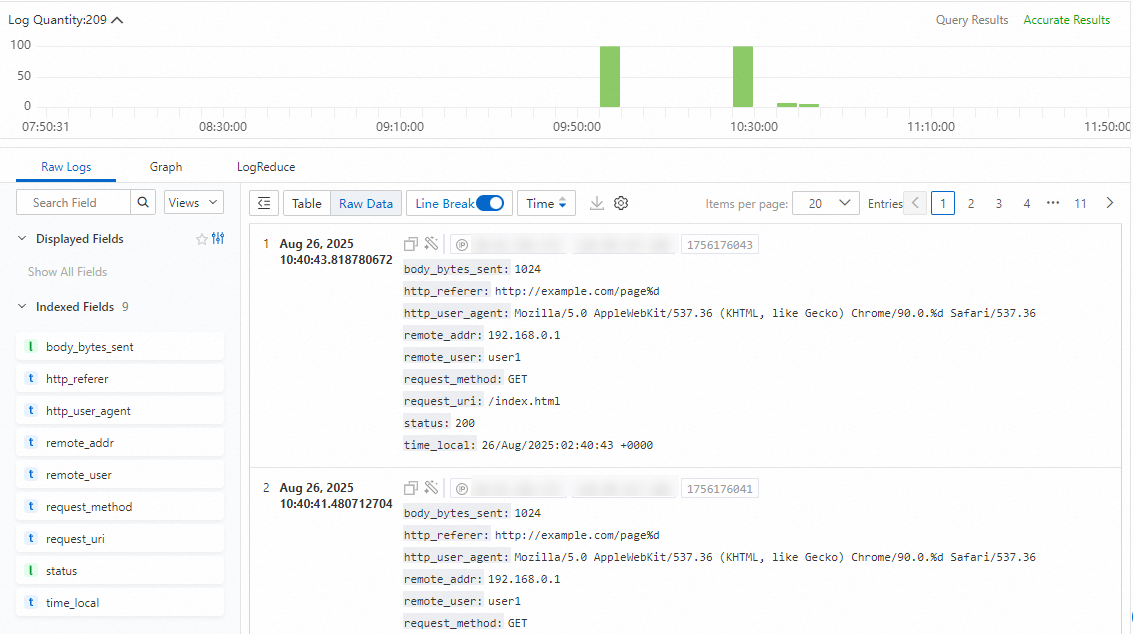
time.sleep(60 * 2)After the index is created, the query results are displayed as shown in the following figure:
6. Query and analyze logs
Manually send a log to generate new data. Configure the query and analysis statement *| select request_method,status from aliyun-test-logstore to retrieve logs. For more information about the query and analysis feature, see Index-based query and analysis.
# The name of the project.
project_name = "aliyun-test-project"
# The name of the logstore.
logstore_name = "aliyun-test-logstore"
# The query statement.
query = "*| select request_method,status from " + logstore_name
# The from_time and to_time variables specify the start time and end time of a time range within which you want to query log data. The values of the variables are UNIX timestamps.
from_time = int(time.time()) - 3600
to_time = time.time() + 3600

# Execute an SQL statement to query logs.
def get_logs():
    print("ready to query logs from logstore %s" % logstore_name)
    request = GetLogsRequest(project_name, logstore_name, from_time, to_time, query=query)
    response = client.get_logs(request)
    for log in response.get_logs():
        for k, v in log.contents.items():
            print("%s : %s" % (k, v))
        print("*********************")
The following response is returned:
ready to query logs from logstore aliyun-test-logstore
request_method : GET
status : 200
*********************
request_method : POST
status : 201
*********************
request_method : GET
status : 202
*********************
request_method : POST
status : 203
*********************
Process finished with exit code 0
7. Visualize data on a dashboard
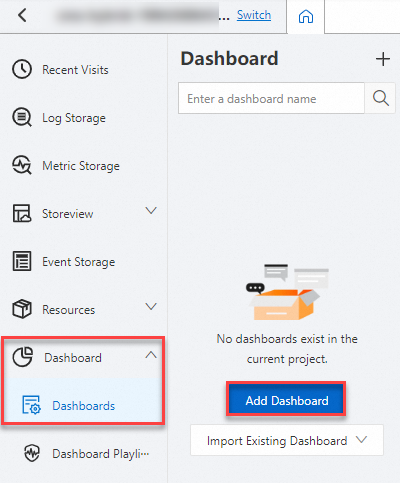
On the project page, select Dashboard > Dashboards in the left navigation pane, and then click Add Dashboard.
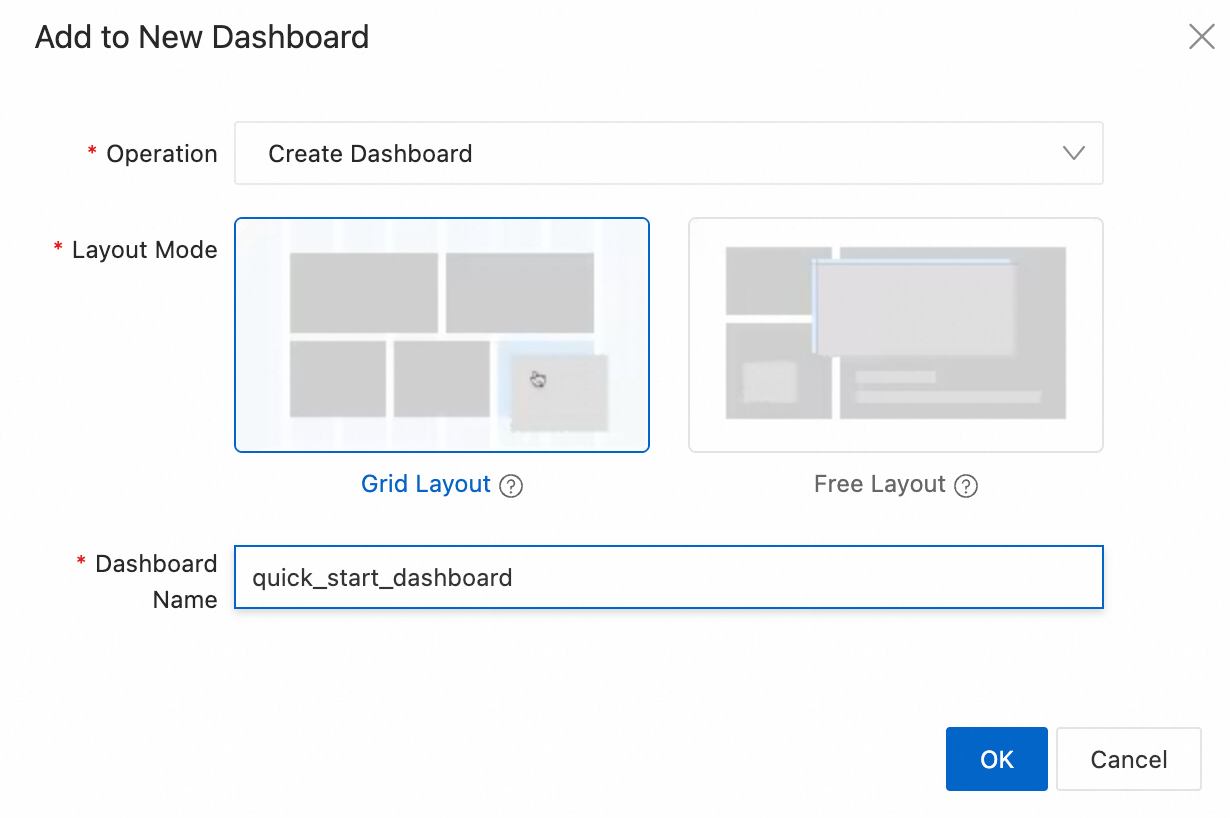
In the Add to New Dashboard dialog box, select a layout mode. The default is Grid Layout. Enter a dashboard name and click OK.
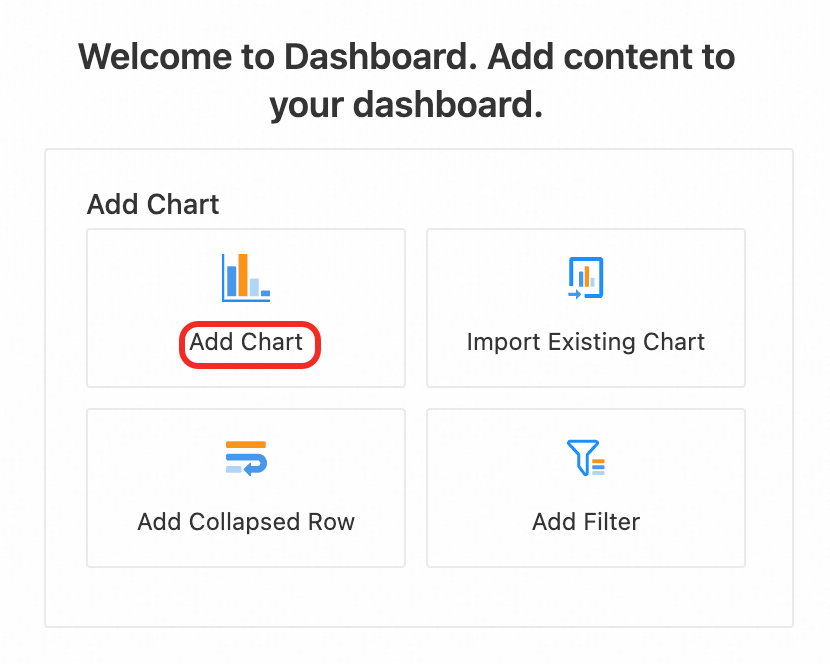
On the new dashboard, click Add Chart.
On the Edit Chart page, select Logstore (SQL) in the Search & Analysis tab in the lower-left corner, and then select the desired logstore. Enter the following query to count the number of requests for each method and status code within a specific period (Top 10):
* | SELECT request_method,status,COUNT(*) AS request_count GROUP BY request_method,status ORDER BY request_count DESC LIMIT 10;. Because this example counts fields, select Table Pro in the Chart Types section on the right and then click OK. The chart is then displayed. If the chart meets your requirements, click OK. Then, click Save in the upper-right corner of the dashboard page. Dashboards support multiple chart types, data filtering, and integration with third-party tools. For more information, see Visualization Overview.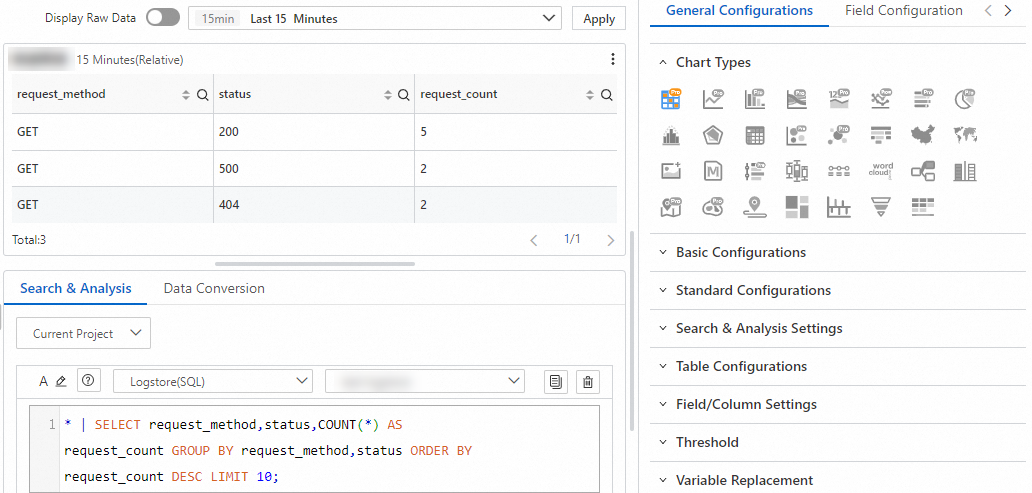
8. Alerting and monitoring
8.1 Create an action policy
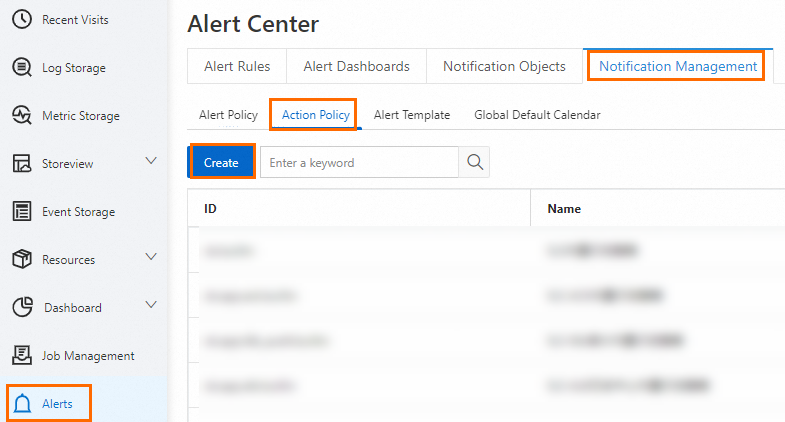
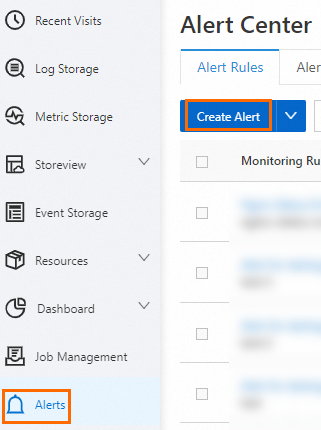
In the navigation pane on the left of the project, choose Alerts > and click Create.
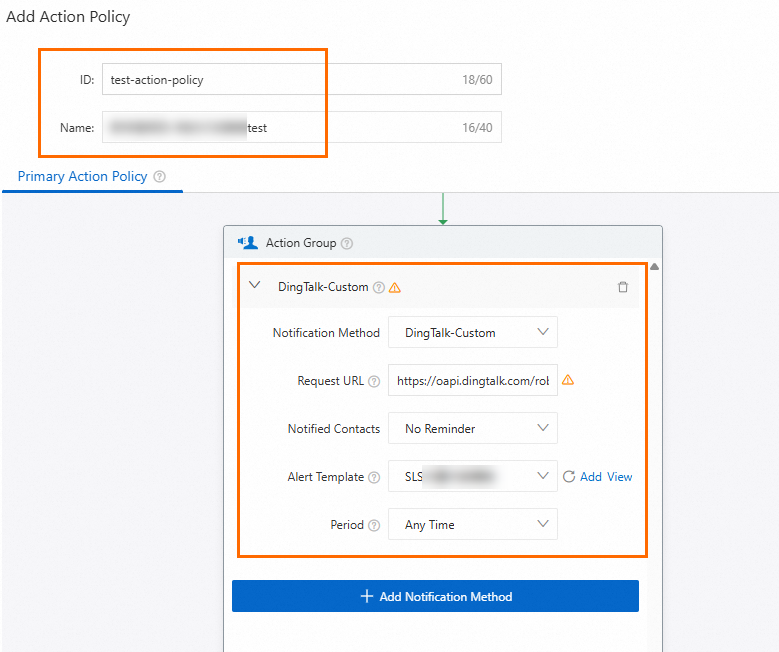
In the Add Action Policy dialog box, create an action policy. Set ID to
test-action-policyand Name toNew Alert Rule-My Action Policy-test. When an alert is triggered, notifications are sent using DingTalk. Configure the action group as follows:Notification Method: Select
DingTalk-Custom.Request URL: Specify the webhook URL of the DingTalk chatbot, such as
https://oapi.dingtalk.com/robot/send?access_token=4dff******6bfe.Notified Contacts: Select No Reminder to prevent users from being notified when the DingTalk group receives an alert.
Alert Template: Select SLS Built-in Content Template to display the alert content.
Period: Select Any Time to send alert notifications at any time.
SLS provides SDK interfaces to manage users, user groups, webhook integrations, action policies, alert policies, and content templates. For more information, see Manage alert resource data.
8.2 Create an alert rule
In the navigation pane on the left of the project, choose Alerts > Alert Rules and click Create Alert.
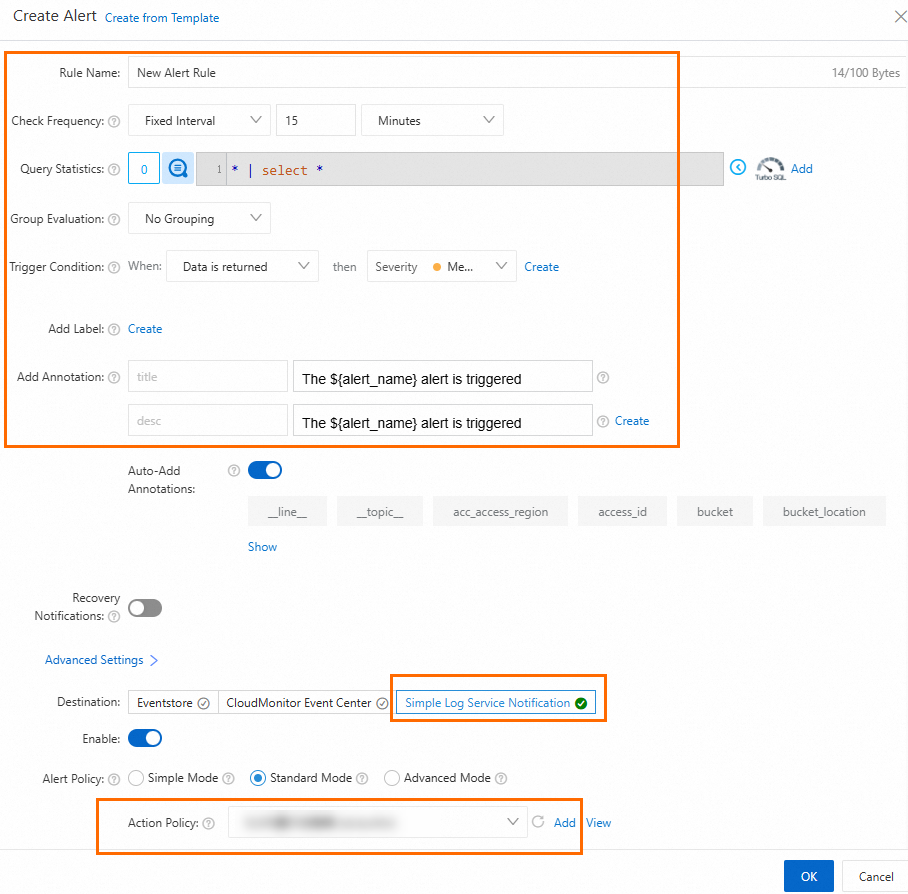
On the Create Alert page, configure an alert rule to trigger a DingTalk alert notification every 15 minutes when SLS detects data. The configurations are as follows:
Rule Name:
New Alert Rule.Check Frequency: Fixed interval of 15 minutes.
Query Statistics:
Type:
Logstore.Region:
China (Hangzhou).Project:
aliyun-test-project.Logstore:
aliyun-test-logstore.Query:
* | select *.Time Range:
Today.
Group Evaluation:
No grouping.Trigger Condition: An alert with a
SeverityofMediumis triggered whendata is returned.Add Annotation: The keys are
titleanddesc, and the description for both isThe ${alert_name} alert is triggered.Destination: SLS notification, with the action policy configured as the created
test-action-policy.
Click the new alert rule. In the Alert History section, you can see that although the count in the dashboard visualization is 5, the alert is not triggered after the initial configuration. After you manually add two log samples from the background information to the
access.logfile, the count increases to 7 and the alert is triggered. This behavior occurs because the check frequency and the query interval are both set to 15 minutes, which makes it appear that alerts are triggered only by incremental logs. You can adjust this behavior by modifying the time range. For more information about the alerting feature, see Alerting and Configure an alert rule in Simple Log Service.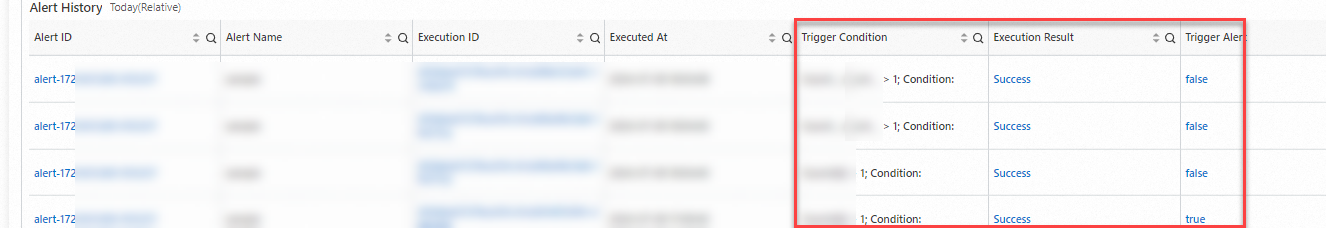
9. Delete log resources
After you complete this quick start, you may no longer need the created resources. However, you are charged for these resources if you do not delete them. Active shards incur rental fees as long as a logstore exists, regardless of whether you use the shards. Therefore, you must manually delete the resources. Run the following code to delete the project and all its resources.
# Project name.
project_name = "aliyun-test-project"

# Delete the specified project
def main():
    try:
        response = client.delete_project(project_name)
        response.log_print()
    except Exception as error:
        print(error)
Appendix: Complete sample code
References
SLS supports log collection using SDKs for multiple languages. For more information, see SDK Reference Overview.
Alibaba Cloud OpenAPI Explorer provides debugging capabilities, SDKs, examples, and related documents. Use OpenAPI Explorer to debug SLS API operations without the need to manually encapsulate or sign requests. For more information, see OpenAPI Explorer.
SLS provides the command-line interface (CLI) to meet the requirements for automated configurations. For more information, see CLI overview.
The fees that are incurred when you manage resources using SLS SDKs, OpenAPI Explorer, or the SLS CLI are the same as the fees that are incurred when you manage resources in the SLS console. For more information, see Billing overview.
FAQs
What features does SLS SDK support?
SLS SDK supports most features of SLS. For example, use SLS SDK to collect, index, query, analyze, transform, consume, and ship logs. You can also configure alerts for logs and manage Scheduled SQL jobs. If you identify a feature that is not supported when you use SLS SDK, we recommend that you update SLS SDK to the latest version and try again or pay attention to subsequent SDK version updates.
How do I use SLS SDK?
SLS SDK provides end-to-end log management. Use SLS SDK in the similar manner as you perform operations in the SLS console. Perform the following steps to use SLS SDK:
Activate SLS.
Obtain an AccessKey pair.
Create a project and a logstore.
Collect logs and store the logs to the logstore.
Create indexes for the logs.
Query and analyze the logs and visualize the query and analysis results.
Transform and ship the logs, and configure alerts for the logs.
SLS provides a console in which you can perform operations in an efficient manner. For more information, see Use LoongCollector to collect and analyze ECS text logs.
How do I handle common errors that may occur when I use SLS SDK?
SLS SDK provides error handing logic. The following errors may occur when you use SLS SDK.
Exceptions that are returned by Simple Log Service. This type of exceptions are handled by Simple Log Service SDK. For more information about this type of exceptions, see the description and error codes of each API operation. For more information about the error codes, see Error codes.
Network exceptions that occur when you use Simple Log Service SDK to send requests. This type of exceptions include network disconnection and server response timeout.
Exceptions that are generated by Simple Log Service SDK and related to platforms and programming languages, such as, memory overflow.
For more information, see Exception handling.
When you use SLS SDK to perform operations such as log collection, index management, data query and analysis, and data transformation, errors may occur. Handle the errors based on the SLS FAQ. For more information, see FAQs.
Are limits imposed when I use SLS SDK?
Yes, SLS imposes limits on basic resources such as the number of projects, the number of logstores, the number of shards, and the size of LogItem. Read Limits on basic resources before you use SLS SDK.
Where can I find SDK code examples?
SLS provides documents for you to obtain sample code of commonly used operations. For more information, see related SDK documents.
SLS SDK for Java:
SLS SDK for Python:
SLS SDK for various programming languages:
For more information about source code, visit Alibaba Cloud GitHub.