Standard monitoring gives you a unified view of your RDS for MySQL instance's health. It integrates Performance Trend and provides performance trend charts, automated anomaly detection, root cause analysis, and five specialized diagnostic views for the most common database issues.
What standard monitoring provides
Capability | Description |
Performance metrics | A wide range of metrics with custom views; select the metrics you want to track |
Diagnostic views | Five pre-built views for Memory OOM, read-only instance delay, full disk space, CPU jitter, and large transactions |
Automatic diagnosis | Detects events on your instance and provides root cause analysis with recommended actions |
Manual diagnosis | Select any time range to trigger on-demand diagnosis |
For details on each metric's performance parameters, see the Performance Parameter Table.
View standard monitoring data
Log on to the ApsaraDB RDS console and go to the Instances page. In the top navigation bar, select the region where your instance resides, find the instance, and click its ID.
In the left navigation pane, click Monitoring and Alerts.
On the Standard Monitoring page, select Standard View or Custom View.
Standard view
The Standard View tab shows Performance Events and Performance Metrics for a selected time range.
The time range cannot span more than 7 days. You can query data from the last 30 days.
View performance events
The event statistics area shows event counts by type within the selected time range. Click View Details to open the View Performance Events page, where you can see anomalous activities and optimization events—scheduled, in progress, or completed.
View performance metrics
In the default Classic View:
Click More Metrics to select additional metrics and view their performance trends.
Click
 after a metric name to see which sub-metrics it contains.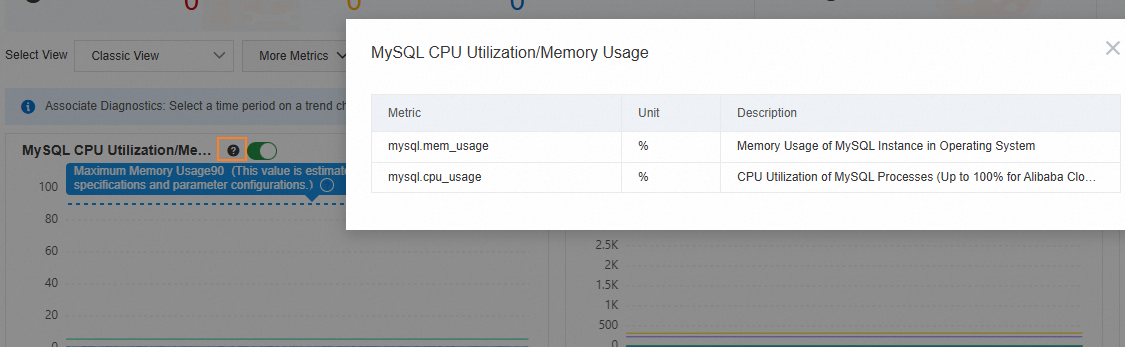
Click Details on any trend chart to zoom in and adjust the time range.
Click Add Trend Comparison to compare the same metric across different time periods.

Analyze events on metric charts
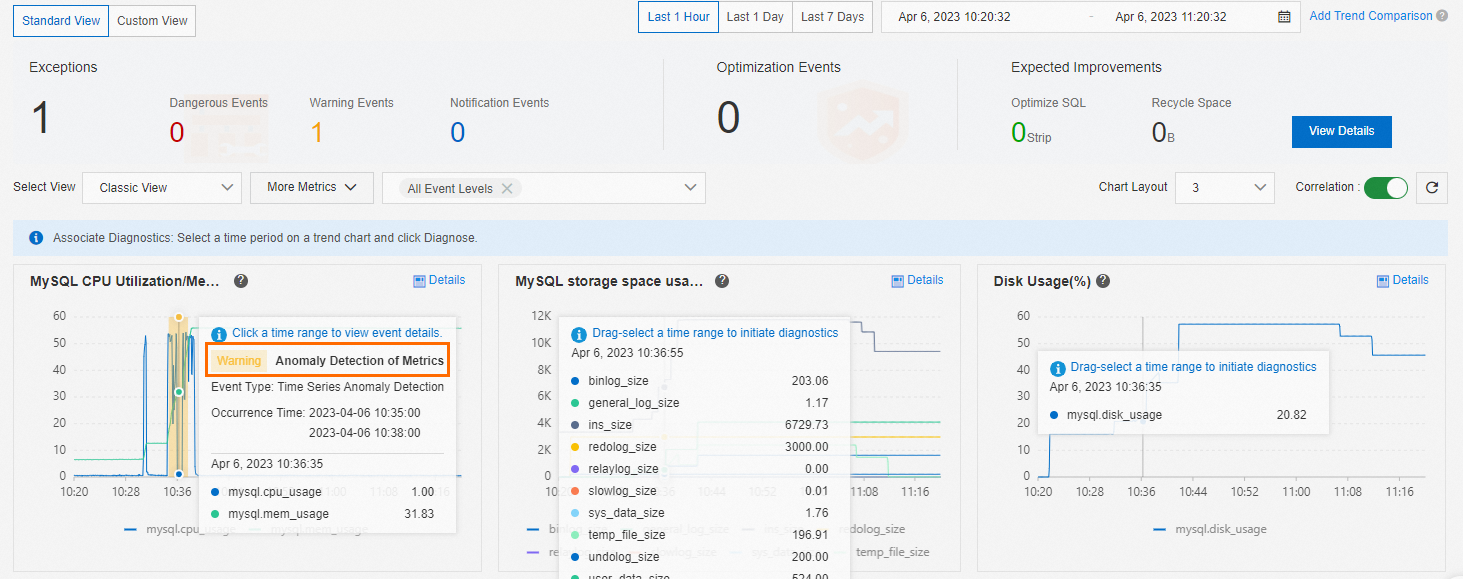
In the Classic View, select an event level to overlay the corresponding events on the MySQL CPU/Memory Utilization and Session Connections trend charts. Click any event marker to view its diagnostic result.
Run diagnosis on a time range
On any metric trend chart, drag to select a time range, then click Diagnose to get a detailed root cause analysis for that period.
Use diagnostic views
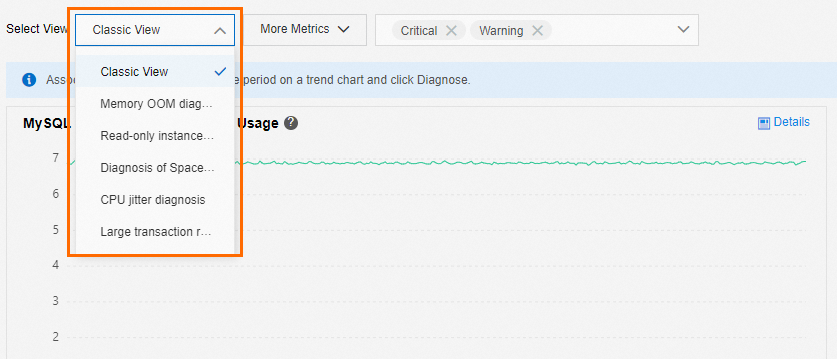
Click any of the five diagnostic views to investigate a specific issue type:
Memory OOM Diagnosis
Read-only Instance Delay Diagnosis
Full Disk Space Diagnosis
CPU Jitter Diagnosis
Large Transaction Recognition Diagnosis
For metric interpretation and next steps for each view, see Diagnostic views.
Custom view
On the Custom View tab, click Add Monitoring Dashboard to build a dashboard with the metrics you care about. For metric parameter details, see the Performance Parameter Table.
Click Add Node And Metric Monitoring to select nodes and metrics.
Choose how metrics are displayed:
Merged Display: All selected metrics appear in a single trend chart.
Separate Display: Each metric appears in its own chart. Use Chart Layout to set how many charts appear per row. Click Details on any chart to zoom in and adjust the time range.
To switch back to the previous monitoring version, click Old Version in the upper-right corner of the Standard Monitoring page.
Diagnostic views
Memory OOM diagnosis
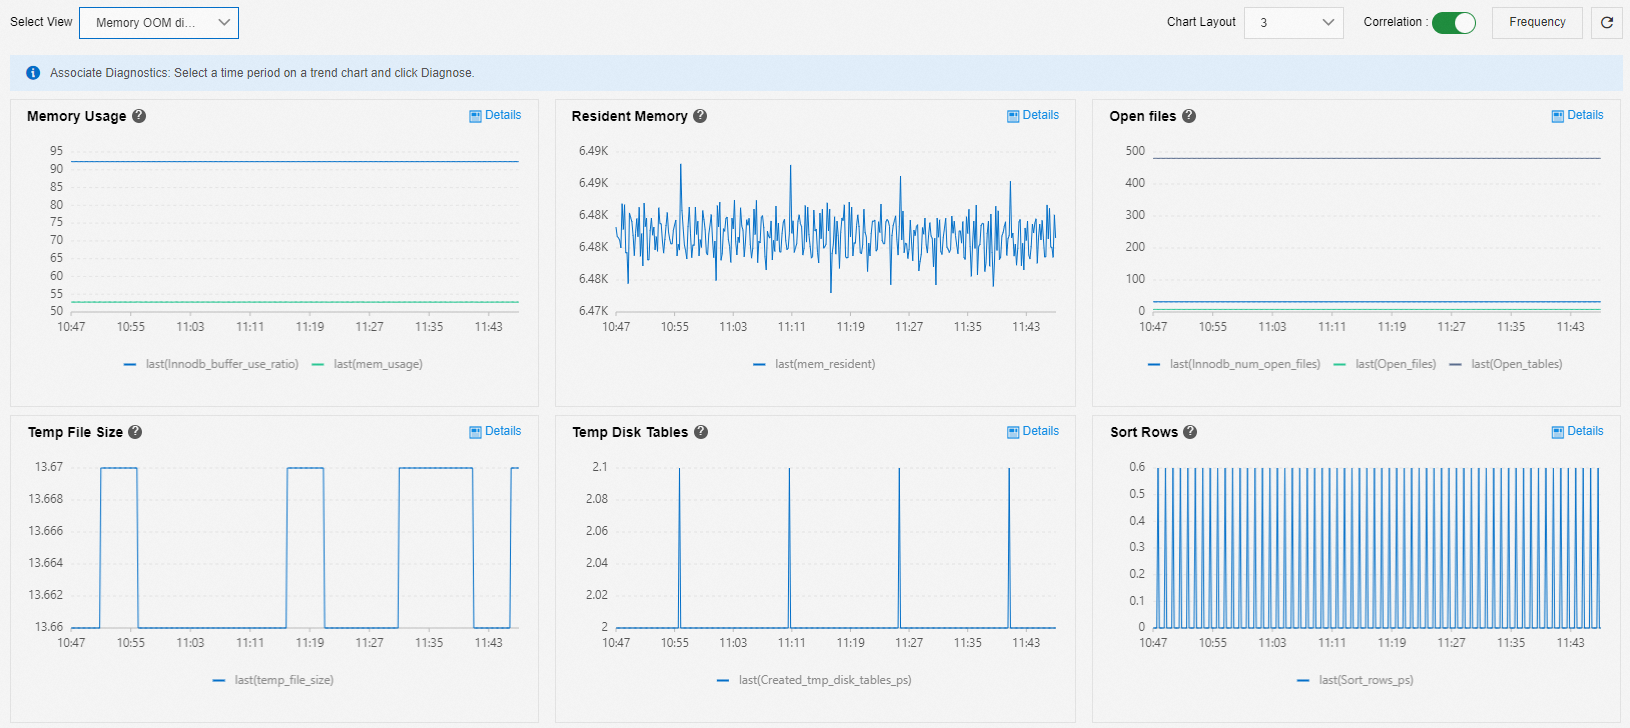
The Memory OOM Diagnosis view helps you analyze out-of-memory (OOM) problems. Key metrics and what they indicate:
Memory Usage — interpret the trend against InnoDB Buffer Pool usage:
Pattern | Likely cause |
InnoDB Buffer Pool unchanged; memory slowly increases over days (for example, more than 7 days) | Memory leak |
Memory spikes suddenly; InnoDB Buffer Pool unchanged | Traffic spike |
Both memory and InnoDB Buffer Pool increase gradually | Buffer Pool filling up (normal behavior) |
Resident Memory shows the amount of physical memory in use. Open files, Temp File Size, Temp Disk Tables, and Sort Rows are common indicators of memory pressure.
Because OOM events often terminate the processes that caused the spike, identifying the exact SQL statement after the fact is difficult. To prepare:
Check business logs when memory spikes occur to trace the cause.
Upgrade memory specifications and enable SQL Explorer and Audit so that when a spike occurs, you can check query execution times to pinpoint the cause.
Read-only instance delay diagnosis
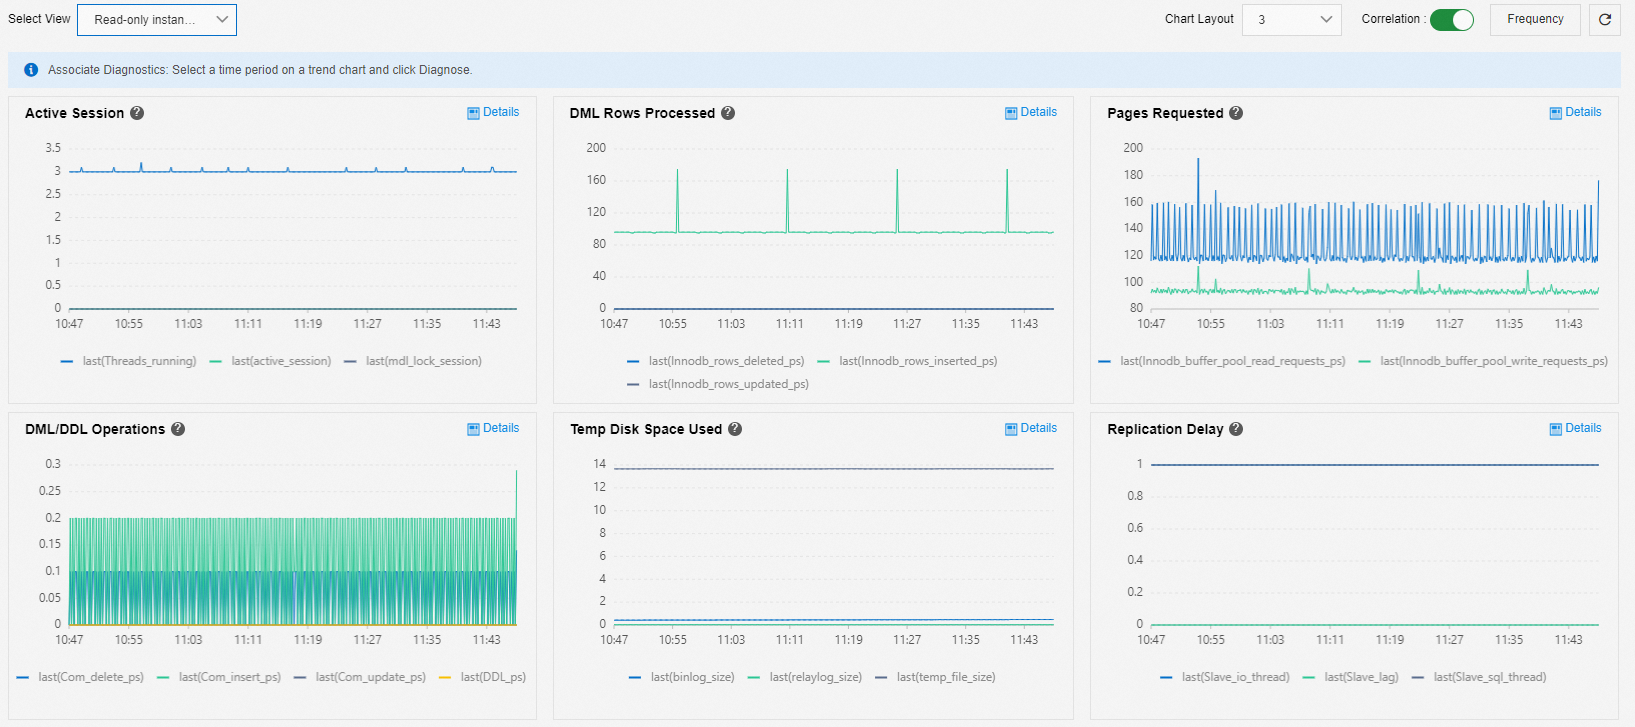
The Read-only Instance Delay Diagnosis view helps diagnose replication lag on read-only instances. Key metrics:
Active Session: Indicates metadata lock blocking. Queries that scan large amounts of data prevent DDL statements from acquiring metadata locks, causing DDL to block other sessions and connections to accumulate.
DML Rows Processed, Pages Requested, DML/DDL Operations, Temp Disk Space Used: Common business workload metrics.
Replication Delay: The primary latency indicator.
Full disk space diagnosis
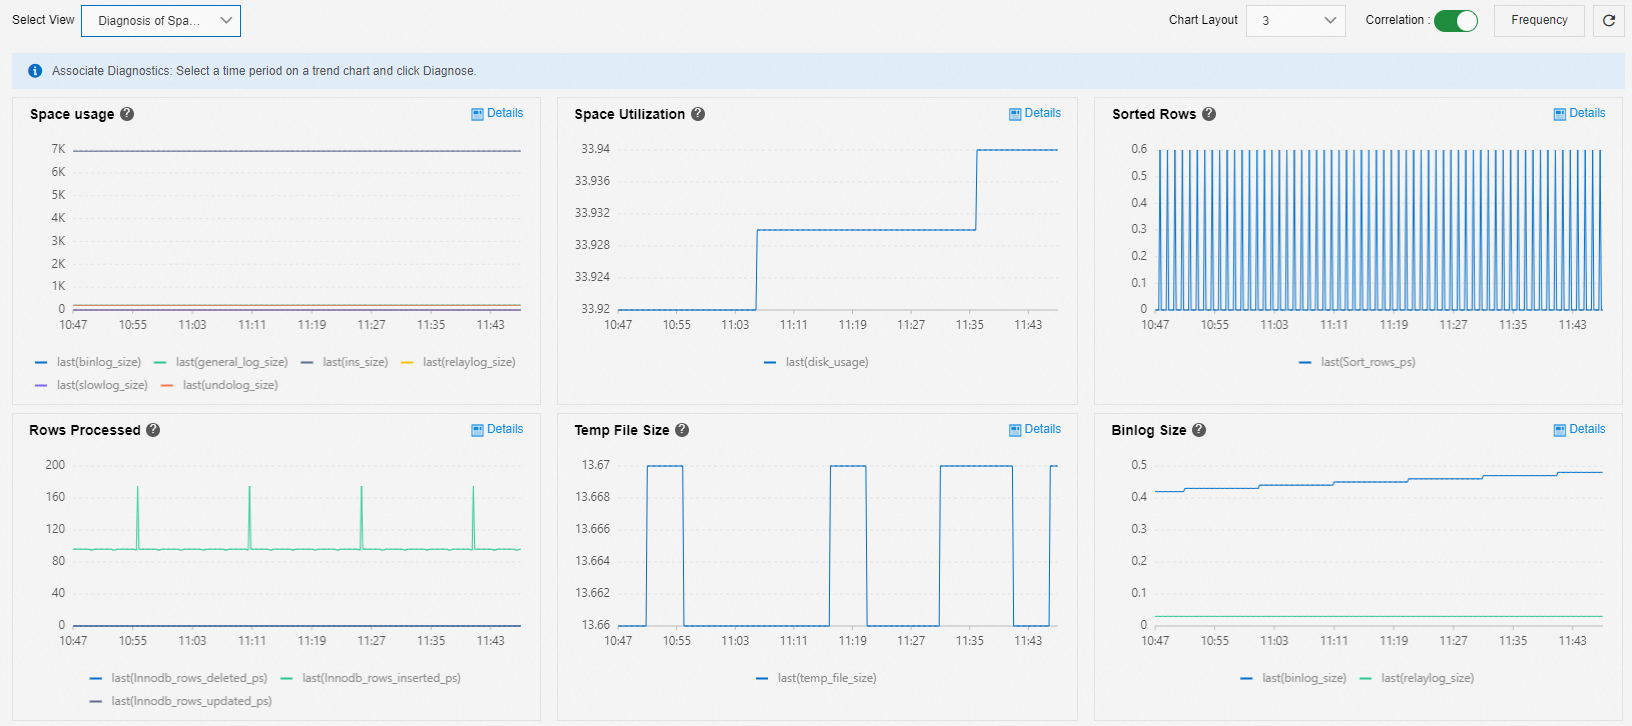
The Full Disk Space Diagnosis view shows which file types are consuming storage and how their sizes change over time. The following storage categories are tracked:
Data files (
user_data_size): Use Space Analysis to identify space usage by database and table, then scale out or delete unnecessary data. See Solutions for a full instance caused by data files.Temporary files (
temp_file_size): Generated during SQL sort, group, and join operations, and as binary log cache files before large transactions commit. See Resolve full instance storage caused by temporary files.Binary logs (
binlog_size): Large transactions can generate binary logs rapidly. If your services subscribe to the instance's binary logs, the logs may not be cleared promptly. See Resolve full instance storage caused by binary log files.Undo logs (
undo_log_size): Long-running queries prevent undo logs from being purged. Check for queries that have been running without completing.NoteIn MySQL 5.6 and earlier, undo logs do not have a separate tablespace.
Slow log (
slowlog_size): Run thetruncatecommand during off-peak hours to clear the slow log if it consumes excessive space.NoteSupport for the
truncatecommand was added in MySQL 5.7 version 20210630 and MySQL 8.0 version 20210930.General logs (
general_log_size): The combined size of the instance's error, Performance Agent, and recovery logs. This value is typically stable and under 1 GB. If it significantly exceeds this threshold, submit a ticket to contact the product team.Notegeneral_log_sizerepresents data periodically generated by the MySQL kernel—not the size of the MySQLgeneral_logfile.
CPU jitter diagnosis
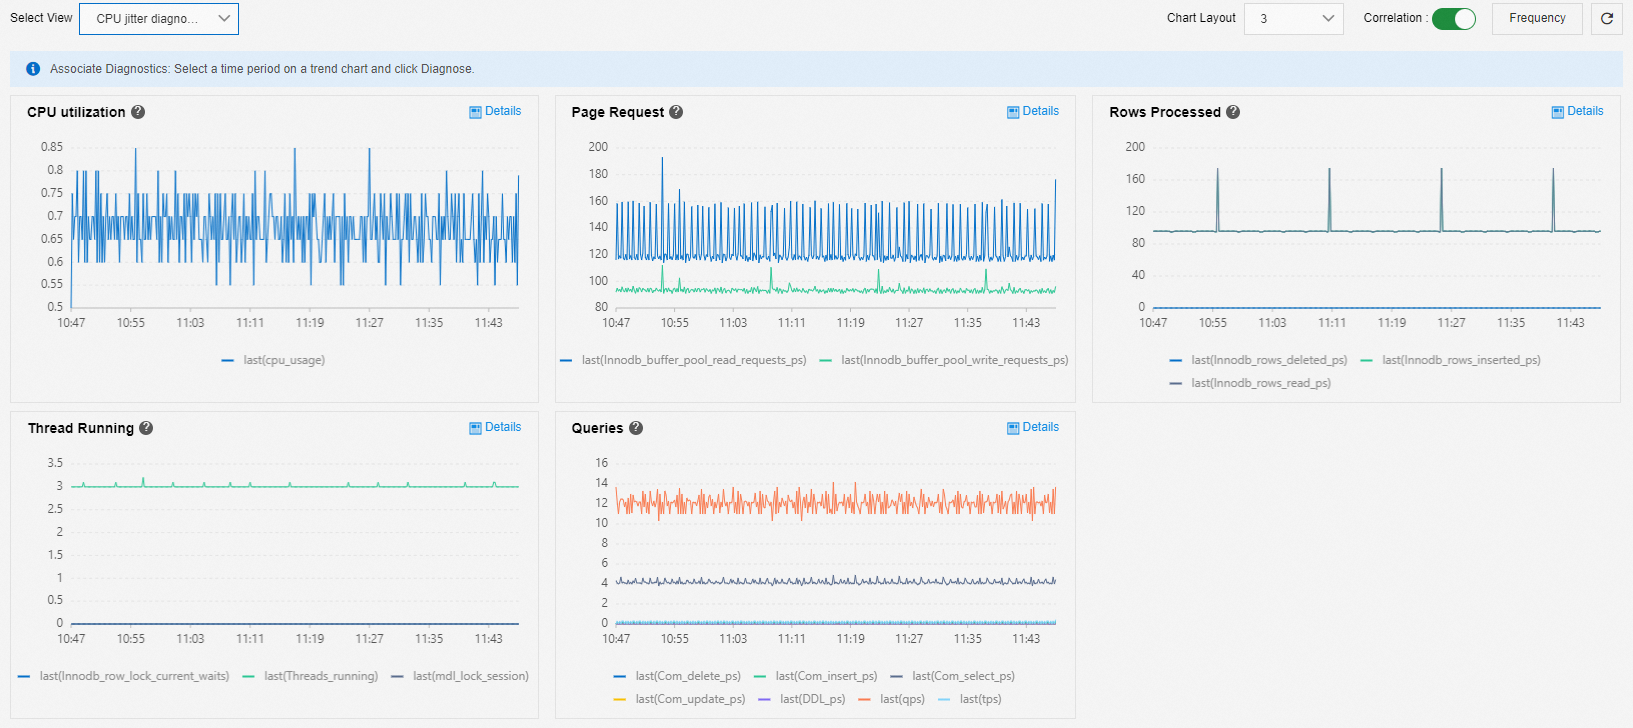
The CPU Jitter Diagnosis view helps you identify why CPU utilization fluctuates. Track these metrics:
Business metrics:
Page Request: Buffer Pool requests typically fluctuate in sync with CPU utilization.
Rows Processed: Compare against CPU utilization to determine whether row volume changes correlate with CPU spikes.
Queries: Identify the SQL statement types executed during CPU utilization changes.
Connections:
Thread Running: High concurrency raises CPU utilization. MDL stacking and row locks can also cause connection buildup, which increases CPU load.
Common causes and next steps:
If Page Request or Rows Processed changed when CPU spiked, drag to select the affected time range and click Diagnose to get a detailed root cause analysis.
If active connections increased, investigate from the application side to determine what drove the connection surge.
Large transaction diagnosis
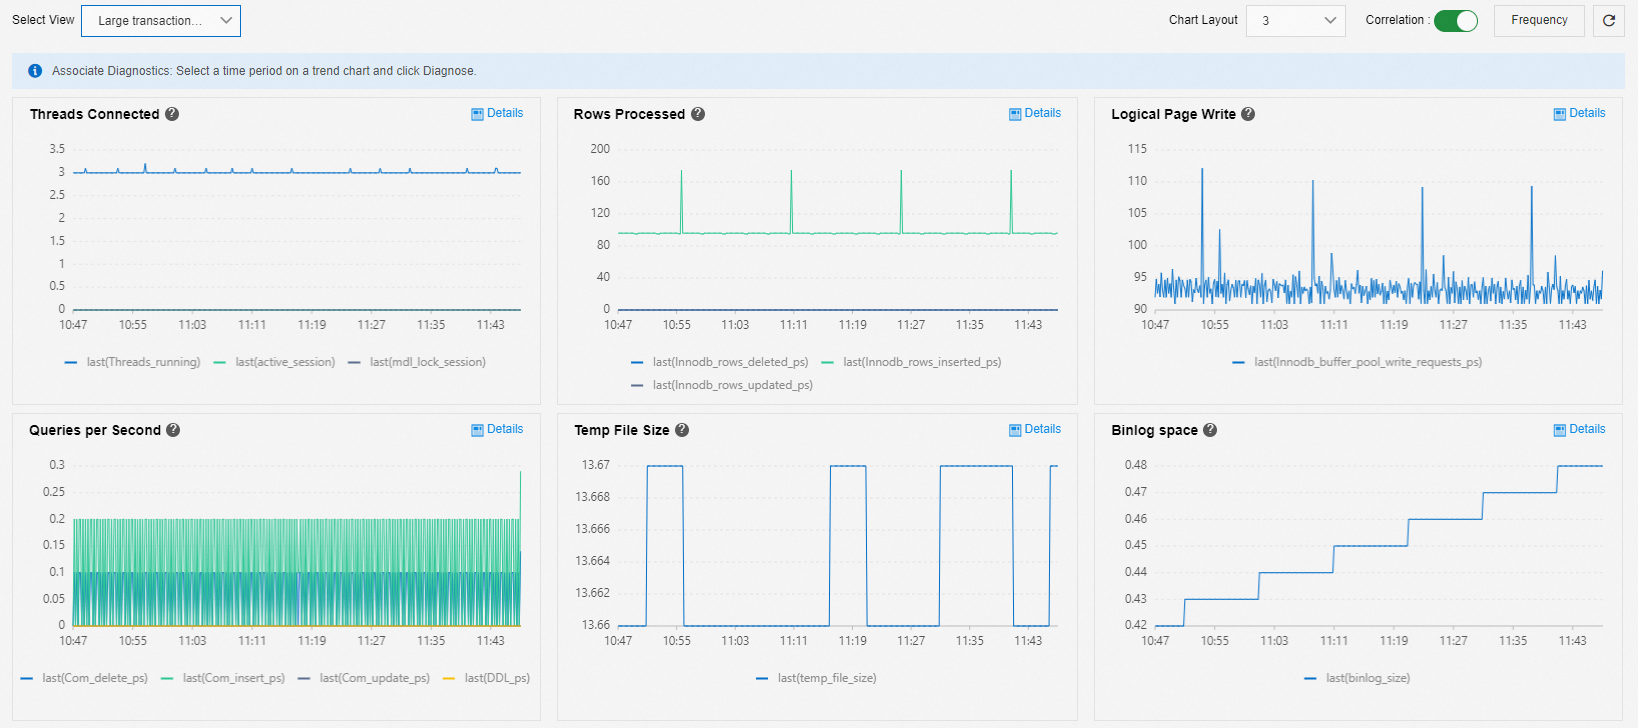
The Large Transaction Recognition Diagnosis view helps identify large transactions and their impact. Three core metrics signal a large transaction:
Signal | Core metric |
Active sessions accumulate | Threads Connected |
Temporary space rises then drops | Temp File Size |
After temp space drops, binary log space rises | Binlog Space |
Rows Processed, Logical Page Write, and Queries per Second indicate the transaction type. For example, few queries combined with a high row deletion count points to a large DELETE operation.
How large transactions affect the instance:
While the large transaction runs, the temporary tablespace (binary log cache) increases gradually, then stabilizes.
Once the temporary tablespace stabilizes, binary log space increases. Because binary log writes are globally serial, other transactions are blocked and connections accumulate.
On High-availability Edition instances, the HA component's probe statements on the primary and secondary instances are also blocked, and a primary/secondary failover occurs.
To prevent these issues, split large transactions into smaller ones. For DELETE statements, add a WHERE clause that limits how many rows are deleted per operation, converting a single large delete into multiple smaller deletes.
Features
The upgraded Standard Monitoring feature in RDS for MySQL integrates Performance Trend and provides more features.
Custom views: The standard monitoring feature provides a wide range of performance metrics and supports custom views. You can select the metrics that you want to monitor.
NoteFor more information about the performance parameters of each metric, see the Performance Parameter Table.
Diagnostic views for common issues: The service provides several diagnostic views that you can use to quickly identify problems. These views include Memory OOM Diagnosis, Read-only Instance Delay Diagnosis, Full Storage Diagnosis, CPU Jitter Diagnosis, and Large Transaction Recognition Diagnosis.
Automatic diagnosis: The standard monitoring feature can detect events on your database instance, perform automatic diagnosis, and provide root cause analysis and suggestions.
Manual diagnosis: You can select a time range to perform a manual diagnosis.
View standard monitoring data
Log on to the ApsaraDB RDS console and go to the Instances page. In the top navigation bar, select the region in which the RDS instance resides. Then, find the RDS instance and click the instance ID.
In the navigation pane on the left, click Monitoring and Alerts.
On the Standard Monitoring page, select Standard View or Custom View.
Standard View
On the Standard View tab, you can select a time range to view the Performance Events and Performance Metrics for the selected period.
NoteWhen you select a time range, the interval between the start and end times cannot exceed 7 days. You can view data from the last 30 days.
View performance events
In the event statistics area, you can view statistics information for various types of events within the selected time range. Click View Details to open the View Performance Events page, where you can view detailed information about anomalous instance activities and optimization events, including events that are scheduled, in progress, or completed.
View performance metrics
View metrics
In the default Classic View, you can view monitoring metrics for a selected time range.
Click More Metrics and select the metrics to view their performance trends.
You can click
after each metric to view the metrics it contains.Click Details on a metric trend graph to zoom in and adjust the time range.
Click Add Trend Comparison to compare the performance trends of the same metric across different time periods.
View event analysis
In the default Classic View, selecting an event level displays the corresponding events in the MySQL CPU/Memory Utilization and Session Connections trend charts.
You can click an event in a trend chart to view the diagnostic result in the event details.
Diagnose and analyze metrics
In any metric trend chart, you can select a time range to Diagnose by dragging your mouse.
View diagnostic views for common issues
You can use the following diagnostic views to quickly identify the root cause of issues: Memory OOM Diagnosis, Read-only Instance Delay Diagnosis, Full Disk Space Diagnosis, CPU Jitter Diagnosis, and Large Transaction Recognition Diagnosis. For more information, see Using Diagnostic Views.
Custom View
On the Custom View tab, click Add Monitoring Dashboard to view trends for the metrics that you want to monitor. For more information about the performance parameters for each metric, see the Performance Parameter Table.
Click Add Node And Metric Monitoring to select nodes and metrics to add to the dashboard.
You can choose how metrics are displayed: Merged Display or Separate Display.
Merged View: Displays multiple metrics in a single trend chart.
Separate Display: Displays each metric in a separate trend graph.
You can use Chart Layout to set how many metric trend charts are displayed per row.
Click Details on a metric trend graph to zoom in and adjust the time range.
On the Standard Monitoring page, click the Old Version button in the upper-right corner to revert to the previous monitoring version.
Use diagnostic views
Memory OOM diagnosis
You can use the Memory OOM Diagnosis view to analyze out-of-memory (OOM) problems.
Memory Usage:
If the InnoDB Buffer Pool usage remains unchanged while the memory usage slowly and continuously increases for a long period, such as more than seven days, a memory leak may have occurred.
If the memory usage suddenly increases while the InnoDB Buffer Pool usage remains unchanged, the increase may be caused by traffic spikes.
If both the memory and the InnoDB Buffer Pool usage increase, the InnoDB Buffer Pool is being gradually filled, which is normal.
Resident Memory: The amount of physical memory used.
Open files, Temp File Size, Temp Disk Tables, and Sort Rows are common metrics that indicate memory consumption.
Memory growth is related to business metrics. SQL statements that cause sudden memory spikes are often untraceable because of OOM. Therefore, we recommend that you:
Check business logs to determine the cause of the sudden memory increase.
Upgrade the memory specifications and enable SQL Explorer and Audit. If a sudden memory spike occurs, you can check the running time of SQL queries to determine the cause.
Read-only instance latency diagnosis
You can use the Read-only Instance Delay Diagnosis view to diagnose delays for read-only instances.
Active Session: Check for blocking from metadata locks.
Typically, queries on large amounts of data prevent DDL statements from obtaining metadata locks. In this case, the DDL statements block other sessions, which causes connections to accumulate.
DML Rows Processed, Pages Requested, DML/DDL Operations, and Temp Disk Space Used: Displays common business metrics.
Replication Delay: The latency metric.
Full storage space diagnosis
You can use the Diagnosis Of Space Full Problem view to analyze insufficient space issues.
You can view the types of files that occupy the storage space of the instance and their change trends. The following metrics are commonly associated with storage usage:
Data files (user_data_size): You can use Space Analysis to view the space usage of each database and table, and then scale out or delete unnecessary data. For more information, see Solutions for a Full Instance Caused by Data Files.
Temporary files (temp_file_size): Temporary tables may be generated when you execute SQL statements to sort and group data or associate tables. Binary log cache files are generated before large transactions are committed. These tables and files occupy storage space. For more information, see Resolve full instance storage caused by temporary files.
Binary logs (binlog_size): Large transactions can quickly generate binary logs. These logs occupy storage space. For more information about how to manage binary logs, see Resolve full instance storage caused by MySQL binary log files.
NoteIf your services subscribe to the binary logs of the database, the logs may not be cleared promptly and can occupy space.
Undo logs (undo_log_size): In most cases, long-running queries prevent undo logs from being cleared. You can check for long-running queries that have not been completed.
NoteIn MySQL 5.6 and earlier, undo logs do not have a separate tablespace.
Slow log (slowlog_size): If the slow log uses too much space, you can use the
truncatecommand to clear it during off-peak hours.NoteSupport for the
truncatecommand was added in version 20210630 of MySQL 5.7 and version 20210930 of MySQL 8.0.General logs (general_log_size): The total size of an instance's error, Performance Agent, and recovery logs, which is typically stable and under 1 GB. If the size significantly exceeds this value, please submit a ticket to contact the product team. This metric represents data that is periodically generated by the MySQL kernel, not the size of the general_log file in MySQL.
CPU jitter diagnosis
You can use the CPU Jitter Diagnostics view to analyze CPU jitter issues. Relevant metrics include the following:
Business metrics:
Page Request: Typically, Buffer Pool requests fluctuate in sync with CPU utilization.
Rows Processed: Examine the relationship between CPU utilization and the number of rows processed to determine if a spike in the number of rows corresponds to a change in CPU utilization.
Queries: View the main types of SQL statements that are executed when CPU utilization changes.
Connections:
Thread Running: High concurrency can cause high CPU utilization. MDL stacking or row locks can also cause a buildup of connections, which increases CPU utilization.
Common causes of CPU jitter:
Changes in business metrics, such as Page Request or Rows Processed, can affect CPU utilization. If this occurs, you can select the time range of the change in CPU utilization and execute Diagnosis to obtain a detailed root cause analysis.
An increase in active connections causes CPU consumption. In this case, you must investigate the issue from the business side.
Large transaction diagnosis
You can use the Large Transaction Recognition Diagnosis view to analyze large transaction issues.
Threads Connected, Temp File Size, and Binlog Space: These are the three core metrics that indicate a large transaction. A large transaction is present in the database if one of the following events occurs:
Active sessions accumulate.
The temporary space first increases and then decreases.
After the temporary space decreases, the Binlog space increases.
Rows Processed, Logical Page Write, and Queries per Second: These metrics are used to determine the type of a large transaction.
For example, if there are few queries but many rows are deleted, it indicates a large transaction that deletes data.
Large transactions can block binary log writes:
When an instance has a large transaction, the temporary tablespace (binlog cache) first increases gradually and then stabilizes.
When the temporary tablespace is stable, the Binlog space increases. Because binary log writing is globally serial, other transactions are blocked, which causes connections to accumulate.
If the instance runs RDS High-availability Edition, the probe statements from the high-availability (HA) component on the primary and secondary instances are also blocked, and a primary/secondary failover occurs.
We recommend that you split large transactions into small transactions and execute them separately. For example, in a delete statement, add a where clause to limit the amount of data that is deleted in each operation, splitting a single delete operation into multiple smaller delete operations.
API reference
API | Description |
Queries the performance data of an RDS instance |
What's next
Troubleshoot slow SQL statements on an ApsaraDB RDS for MySQL instance
Troubleshoot memory consumption issues on an ApsaraDB RDS for MySQL instance
Troubleshoot insufficient storage issues on an ApsaraDB RDS for MySQL instance
Troubleshoot high I/O issues on an ApsaraDB RDS for MySQL instance
Troubleshoot issues caused by excessive active threads on an ApsaraDB RDS for MySQL instance
Causes and solutions for high IOPS usage on an RDS for MySQL instance
Appendix: Legacy monitoring
Overview of metrics in legacy monitoring
View legacy monitoring data
Log on to the ApsaraDB RDS console and go to the Instances page. In the top navigation bar, select the region where your instance resides, find the instance, and click its ID.
In the left navigation pane, click Monitoring and Alerts.
On the Standard Monitoring tab, click Old Version.

Select Resource Monitoring, Engine Monitoring, or Deployment Monitoring, then set a time range to view the data. For Cluster Edition instances, you can also filter by instance or node ID. You can query data from the last 30 days.