Database Autonomy Service (DAS) lets you monitor database instances through performance trend charts, detect anomalies automatically, and diagnose issues—either on automatically detected events or over a custom time range you define.
Prerequisites
Before you begin, ensure that:
The database instance is connected to DAS and in the Accessed state
View performance trends
Log on to the DAS console.
In the left-side navigation pane, click Instance Monitoring.
Find the database instance you want to manage and click its instance ID. The instance details page appears.
In the left-side navigation pane, click Dashboard.
Use the tabs described in the following sections to monitor and diagnose your instance.
Performance Trends tab
View trend charts for metrics such as transactions per second (TPS), queries per second (QPS), and throughput within a specific time range.
On the Performance Trends tab:
Click More Metrics to select which metrics to display.
Click the
 icon next to a metric name to view details about that metric.
Drag to select a time range in a trend chart, then click Diagnose to analyze the metric trend over that period.
Click Details in the upper-right corner of a trend chart to open an enlarged view. Change the time range to focus on a different period.
Select one or more event levels to display detected events in the MySQL CPU Utilization/Memory Usage and Session trend charts.
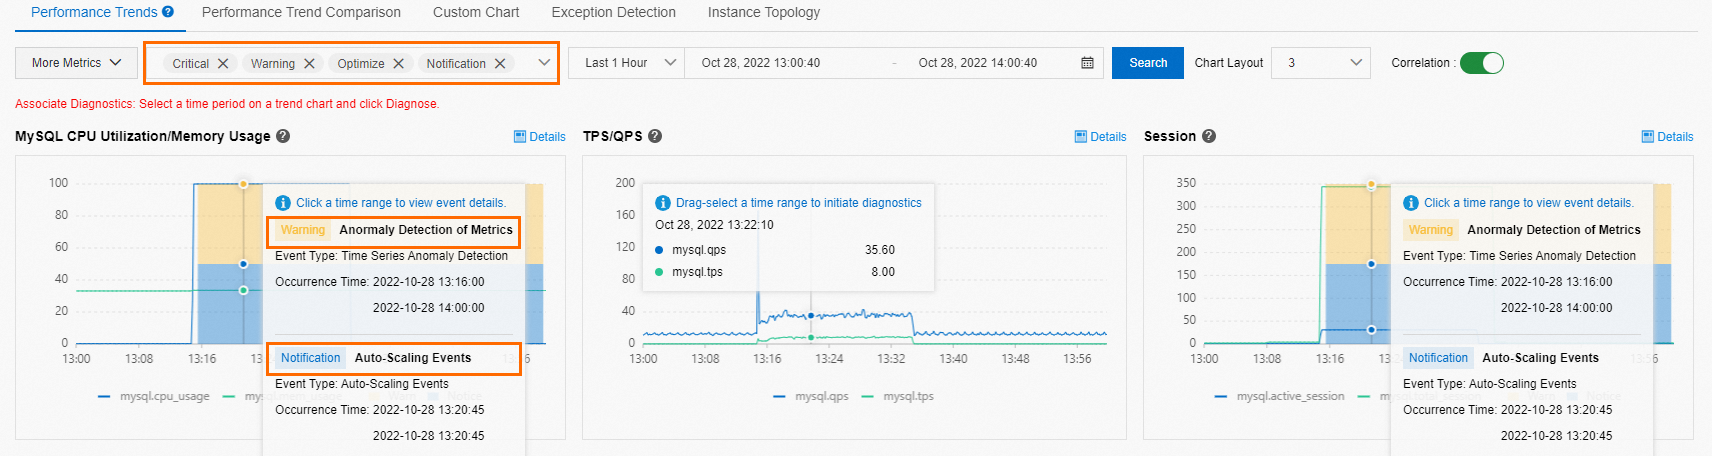
Click an event marker in a trend chart to view its diagnostic result.
Diagnose performance issues
Use performance trend charts and event markers together to locate the root cause of an issue:
Check the trend charts for metrics such as TPS, QPS, or CPU utilization. Look for spikes or sustained anomalies.
If anomalies are present, select one or more event levels to overlay detected events on the MySQL CPU Utilization/Memory Usage and Session charts. Event markers indicate when DAS detected an issue.
Click an event marker to view the diagnostic result, including root cause analysis and suggested actions.
To investigate a specific time window further, drag to select that range in the trend chart and click Diagnose.
Performance Trend Comparison tab
Compare how a metric behaves across different time ranges side by side. Click More Metrics to select which metrics to compare. This is useful for identifying regressions after a deployment or configuration change.
Custom Charts tab
Create dashboards that group multiple metrics together, making it easier to correlate indicators and pinpoint performance issues.
Click Add Monitoring Dashboard. In the Create Monitoring Dashboard dialog box, enter a name in the Dashboard Name field and click OK.
Click Add Node and Metrics. In the Select Metrics of Monitoring Chart dialog box, select the nodes and metrics to display, then click the
 icon.
icon.Click OK.
Exception Detection tab
View anomaly detection results and predictions for core metrics. Click More Metrics to select the metrics to monitor. For details, see Performance anomaly detection.
Instance Topology tab
View the topology of the instance.