When memory usage on an ApsaraDB RDS for MySQL instance climbs abnormally, the instance risks memory exhaustion and degraded query performance. This topic explains how to check memory metrics, identify common root causes, and resolve them.
Key concepts
Two metrics indicate whether memory consumption is healthy:
| Metric | What it measures | Problem signal |
|---|---|---|
| Memory usage | Percentage of instance memory in use | If frequently above 75%, investigate workload or upgrade |
| InnoDB buffer pool hit ratio | Percentage of read requests served from memory without disk I/O | A low hit ratio forces disk reads, increasing I/O and query latency |
The InnoDB buffer pool uses the least recently used (LRU) caching algorithm to manage data pages. By default, the buffer pool is allocated 75% of the instance memory capacity.
Check memory metrics
Check from the console
The ApsaraDB RDS console provides two paths to view memory metrics.
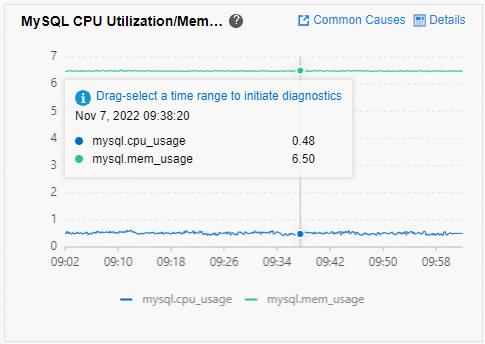
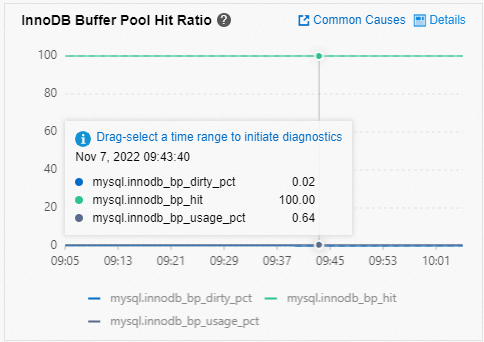
Monitoring and Alerts
In the left-side navigation pane, click Monitoring and Alerts. On the page that appears, click the Standard Monitoring tab to view the MySQL CPU Utilization/Memory Usage and InnoDB Buffer Pool Hit Ratio metrics.
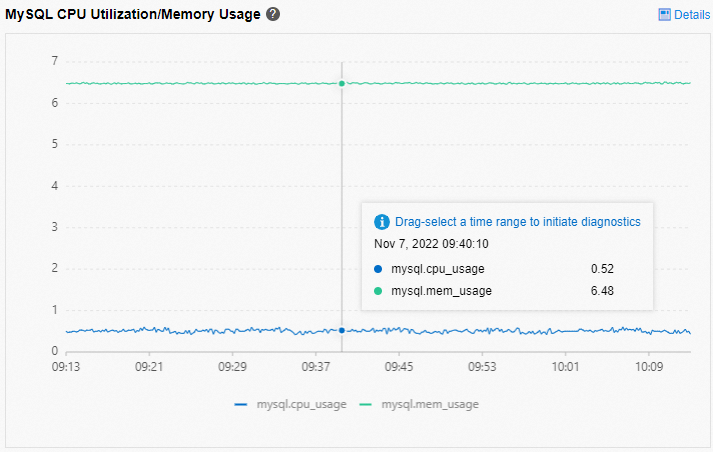
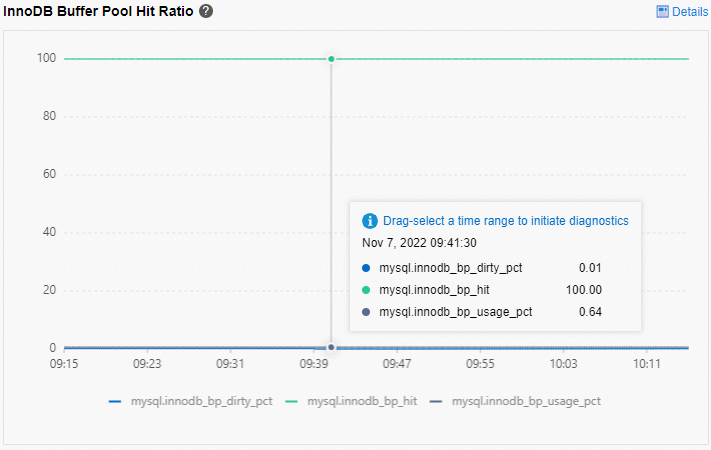
Database Autonomy Service (DAS)
In the left-side navigation pane, choose Autonomy Service > Dashboard. On the page that appears, click the Performance Trends tab to view the MySQL CPU Utilization/Memory Usage and InnoDB Buffer Pool Hit Ratio metrics.
Check with PERFORMANCE_SCHEMA
The performance_schema storage engine aggregates per-thread, per-user, and per-host memory usage into memory summary tables. For full details, see the MySQL documentation on memory use.
Enable at instance startup
Set the performance_schema parameter before restarting the instance, then restart for the change to take effect:
MySQL 5.6: set
performance_schematoONMySQL 5.7 or MySQL 8.0: set
performance_schemato1
For parameter configuration steps, see View the parameters of an ApsaraDB RDS for MySQL instance.
Enable at runtime (no restart required)
UPDATE performance_schema.setup_instruments SET enabled = 'yes' WHERE name LIKE 'memory%';Memory summary tables
After enabling, query the following tables to identify which accounts, hosts, threads, or users consume the most memory:
| Table | Dimension |
|---|---|
memory_summary_by_account_by_event_name | Account (user + host combination) |
memory_summary_by_host_by_event_name | Host |
memory_summary_by_thread_by_event_name | Thread |
memory_summary_by_user_by_event_name | User |
memory_summary_global_by_event_name | Event name (global) |
Diagnose and resolve common causes
The InnoDB buffer pool is normally the largest consumer of instance memory. Memory is also dynamically allocated for in-memory temporary tables, table caches, adaptive hash indexes, and large BLOB fields.
Buffer pool issues
Low hit ratio after restart or cold read
After a restart, the buffer pool starts empty. Queries must read data pages from disk until the pool warms up, causing elevated latency. The same effect occurs after reading large amounts of cold data.
Before you upgrade your RDS instance or launch a sales promotion, we recommend that you sufficiently pre-warm data pages.
Dirty page accumulation
InnoDB tracks modified (dirty) pages in a flush list and writes them to disk periodically. If the difference between the earliest and current log sequence numbers (LSNs) of dirty pages exceeds 76%, InnoDB triggers synchronous flushing from a user thread, which significantly degrades performance.
To reduce dirty page pressure:
Balance write loads to avoid sustained high write throughput.
Adjust parameters that control dirty page flushing frequency.
Upgrade the instance to one with more I/O capacity.
Lock contention at high QPS
If the instance has a large memory capacity but innodb_buffer_pool_instances is set to a small value, high queries per second (QPS) can cause heavy contention for locks within the buffer pool.
Set innodb_buffer_pool_instances to 8, 16, or a larger value to reduce contention.
Multi-statement queries
MySQL supports sending multiple SQL statements in a single query, separated by semicolons (;). Some memory allocated to execute these statements is not released until all statements in the batch complete. A large batch can cause a sudden memory spike of several hundred MB, potentially exhausting available memory.
To detect multi-statement queries, check for sudden spikes in network traffic using Monitoring and Alerts or SQL Explorer. Avoid batching large numbers of SQL statements in a single query.
Temporary table issues
In-memory temporary tables are bounded by the smaller of tmp_table_size and max_heap_table_size. When a table exceeds this limit, MySQL converts it to an on-disk temporary table. If many connections create large temporary tables simultaneously, memory usage rises sharply.
MySQL 8.0 introduces the TempTable engine, which bounds the total size of in-memory temporary tables across all threads using the temptable_max_ram parameter (default: 1 GB). When the total exceeds this limit, older in-memory temporary tables spill to disk.
To reduce temporary table pressure, rewrite queries to avoid large intermediate result sets, and keep tmp_table_size and max_heap_table_size at reasonable values for your workload.
Table cache and other sources
Each open table consumes memory from the table cache. If the instance has a large number of tables or a high QPS, the table cache can consume a significant amount of memory. Avoid creating a large number of tables and avoid setting table_open_cache to an excessively large value, as this increases memory consumption.
Additional memory sources:
| Source | Details |
|---|---|
| Adaptive hash index | Consumes 1/64 of the buffer pool size by default |
| BLOB fields | Querying or writing large BLOB fields triggers dynamic memory allocation proportional to the field size |
For general MySQL memory management details, see the MySQL documentation on memory use.