Slow SQL statements on an ApsaraDB RDS for MySQL instance typically stem from one of several root causes: schema or index issues, resource exhaustion, version-upgrade side effects, misconfigured parameters, cache stampedes, heavy batch operations, unclosed transactions, or scheduled tasks. Each cause has distinct symptoms and a corresponding resolution.
How to approach troubleshooting
Start with monitoring before investigating any specific cause. Follow this sequence:
Open Monitoring and Alerts in the ApsaraDB RDS console and check the Standard Monitoring tab. Click Resource Monitoring to review CPU utilization, IOPS (input/output operations per second), disk usage, connections, cache hit ratio, queries per second (QPS), and transactions per second (TPS).
If a metric is near 100%, start with instance limits or batch operations.
If metrics look normal but queries are still slow, check unclosed transactions and SQL exceptions.
Open SQL Explorer and Audit to identify the specific slow statements. Two metrics help prioritize which statements to address first:
Execution time: Long-running queries hold locks longer and block other operations. Fix these first.
Execution count: Frequently executed queries create high cumulative load even if each individual run is fast. These are strong optimization candidates.
Troubleshoot slow SQL statements caused by SQL exceptions
Causes
SQL exceptions occur when queries are inherently inefficient due to schema design issues, missing indexes, or an excessively large number of rows that need to be scanned.
How to identify
In the ApsaraDB RDS console, go to SQL Explorer and Audit in the navigation pane. Review the execution time and execution count for each slow SQL statement to determine which queries need attention.
Resolution
Optimize the problematic SQL statements based on your business requirements. For details, see SQL optimization.
Troubleshoot slow SQL statements caused by instance limits
Causes
An instance reaches its performance ceiling for several reasons:
Workloads grow without a corresponding increase in storage capacity or compute resources.
The physical host ages, degrading overall instance performance.
Data volume increases and data structure changes slow down certain SQL statements over time.
How to identify
In the ApsaraDB RDS console, go to Monitoring and Alerts in the navigation pane. On the Standard Monitoring tab, click Resource Monitoring and check whether all resource usage metrics are close to 100%. If they are, the instance has reached its performance ceiling.
Resolution
Use SysBench to benchmark the maximum performance of your instance. The QPS and TPS values measured by SysBench represent the upper bound, even under complex query workloads. For benchmark procedures, see Test guidelines.
If the instance has reached its performance ceiling, upgrade to a higher specification. For details, see Change instance specifications.
Troubleshoot slow SQL statements caused by version upgrades
Causes
Upgrading an RDS instance can change the query plans for existing SQL statements. MySQL query plans use join types that vary in efficiency. In descending order of efficiency: system, const, eq_ref, ref, fulltext, ref_or_null, index_merge, unique_subquery, index_subquery, range, index, and all. For details, see the official MySQL documentation.
When the query plan for a frequently executed statement shifts to a less efficient join type (such as range or index), the statement runs more slowly. If many such statements are parallelized simultaneously, threads accumulate faster than they are released, exhausting the connection pool and affecting all workloads on the instance.
How to identify
In the ApsaraDB RDS console, go to Monitoring and Alerts in the navigation pane. On the Standard Monitoring tab, click Resource Monitoring and check the number of active connections. A sudden spike in connections after an upgrade is a strong indicator.
Resolution
Use EXPLAIN to analyze the query plans for slow statements. Identify join types, index usage, and the number of rows scanned for each statement. Based on this analysis, reconstruct the SQL statements or adjust indexes to restore query efficiency. For details, see SQL optimization.
Troubleshoot slow SQL statements caused by unsuitable parameter settings
Causes
Incorrect values for the innodb_buffer_pool_instances and join_buffer_size parameters can degrade SQL execution performance.
How to identify
In the ApsaraDB RDS console, go to Parameters in the navigation pane. On the Edit History tab, review the reconfiguration history for these parameters to see whether a recent change coincides with the performance degradation.
Troubleshoot slow SQL statements caused by the expiration of cached entries
Causes
When cached entries expire simultaneously (a cache stampede), a large volume of requests bypasses the cache and hits the database directly. ApsaraDB RDS does not guarantee a 100% cache hit ratio, so this scenario is possible under high concurrency.
How to identify
In the ApsaraDB RDS console, go to Monitoring and Alerts in the navigation pane. On the Standard Monitoring tab, click Resource Monitoring and check the cache hit ratio alongside QPS and TPS. A sudden drop in cache hit ratio combined with a spike in QPS indicates a cache stampede.
Resolution
Enable the following features to handle the increased load and reduce the impact of cache misses:
Thread Pool: Manages connection concurrency and prevents thread exhaustion. See Thread Pool.
Fast query cache: Caches query results to reduce repeated computation. See Fast query cache.
Automatic SQL throttling: Limits the rate of incoming SQL requests to protect the instance. See Automatic SQL throttling.
Troubleshoot slow SQL statements caused by batch operations
Causes
Large-scale data imports, deletions, or queries running concurrently with normal workloads compete for disk I/O and transaction resources, slowing down all SQL execution.
How to identify
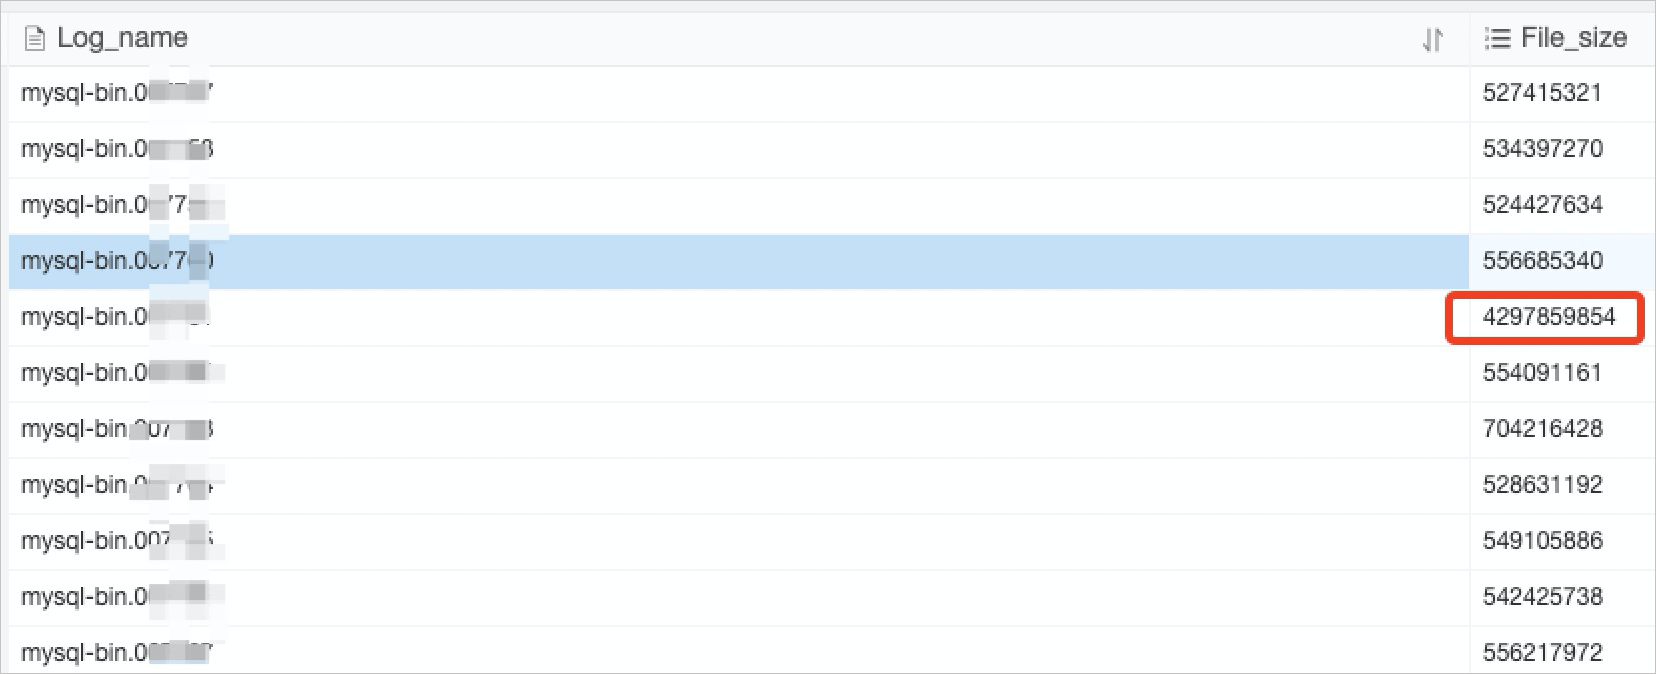
Check disk usage, SQL logs, or slow query statistics. One useful signal: binary log (binlog) files are normally 500 MB each. If a binlog file exceeds 500 MB, investigate whether a batch operation is the cause.
In the ApsaraDB RDS console, go to Monitoring and Alerts in the navigation pane. On the Standard Monitoring tab, click Resource Monitoring to review disk usage and IOPS. Click Engine Monitoring to review TPS.
Resolution
Schedule batch operations during off-peak hours. If off-peak scheduling is not possible, split each batch operation into smaller requests and submit them sequentially to reduce the peak load.
Troubleshoot slow SQL statements caused by unclosed transactions
Causes
Unclosed transactions hold locks and block other queries. The affected queries queue up, appear as slow SQL statements, and cause the number of active sessions to grow.
How to identify
If a workload suddenly slows down but CPU utilization and IOPS remain normal, and the number of active sessions keeps increasing, unclosed transactions are likely the cause. This often occurs when SQL statements are run manually through Data Management Service (DMS) or outside of normal application flows.
Resolution
Identify the transactions that are holding locks. Check for lock conflicts between transactions, then terminate the blocking SQL statements to release the locks.
Troubleshoot slow SQL statements caused by scheduled tasks
Causes
Scheduled tasks that perform batch writes or updates run at fixed intervals. Even if they are configured for off-peak hours, they can compete with other workloads due to locking and I/O pressure, causing slow SQL statements during the overlap period.
How to identify
If instance load spikes at regular, predictable intervals, scheduled tasks are likely involved. Review the monitoring information on the Standard Monitoring tab of the Monitoring and Alerts page to correlate load patterns with task schedules.
Resolution
Adjust the schedule so that tasks run during periods of lowest traffic. Stagger multiple scheduled tasks to avoid overlapping their peak load.
What's next
Use the following tools and topics to investigate slow SQL statements further: