Fast Query Cache is a query cache built by Alibaba Cloud that replaces the native MySQL query cache with a lock-free, high-concurrency design. It significantly improves queries per second (QPS) in read-heavy workloads while adding minimal overhead in mixed read/write scenarios.
Fast Query Cache is available only on RDS instances running MySQL 5.7 with a minor engine version of 20200331 or later, and requires the dedicated proxy service to be disabled.
Prerequisites
Before you begin, make sure that:
Your RDS instance runs MySQL 5.7 with a minor engine version of 20200331 or later
The dedicated proxy service is disabled for your RDS instance. For details, see Disable the dedicated proxy service for an ApsaraDB RDS for MySQL instance
How it works
A query cache improves performance by storing result sets for qualifying queries. When the same query runs again, the database returns the cached result directly — skipping SQL parsing, optimization, and execution — which reduces CPU overhead and response time for high-frequency, simple queries.
Why not use the native MySQL query cache?
The native MySQL query cache uses a global lock on all cache operations. Under high concurrency, this lock becomes a bottleneck: adding more CPU cores can actually reduce QPS rather than increase it. Poor memory management compounds the problem — fragmentation accumulates, reclamation is slow, and low cache hit ratios cause significant performance degradation. These issues led MySQL to remove the native query cache entirely in MySQL 8.0 and disable it by default in earlier versions.
How Fast Query Cache addresses these problems
Alibaba Cloud redesigned the query cache from the ground up:
| Improvement area | What changed |
|---|---|
| Concurrency | Removed the global lock. Uses a lock-free design with sharding, enabling true multi-core parallel processing with no lock contention |
| Memory management | Allocates memory on demand. Intelligent reclamation policies reduce fragmentation and improve utilization |
| Cache policy | Monitors cache hit ratio in real time and dynamically adjusts the eviction policy and cache validity period to prevent stale entries from occupying resources |
| Write compatibility | Uses incremental invalidation to partially invalidate only the cache entries affected by a write, reducing the impact on cached reads |
Enable Fast Query Cache
Fast Query Cache is controlled by two parameters: query_cache_type (on/off switch) and query_cache_size (memory allocation).
Parameters
| Parameter | Description |
|---|---|
query_cache_type | Controls the cache switch. Valid values: 0 — disabled (default); 1 — enabled for all qualifying queries (SQL_NO_CACHE skips caching per statement); 2 — disabled globally, but SQL_CACHE enables caching for specific statements |
query_cache_size | Memory allocated to the cache. Valid values: 0 to 10,485,760,000 bytes (must be a multiple of 1,024). Unit: bytes |
Steps
Because Fast Query Cache consumes extra memory, reconfigure innodb_buffer_pool_size first to free up space:
Reduce
innodb_buffer_pool_sizeto 90% of its current value. The 10% you free up becomes available for the query cache. For example, if the current value is{DBInstanceClassMemory*7/10}, set it to{DBInstanceClassMemory*63/100}. For details, see Change the size of the InnoDB buffer pool.Set
query_cache_sizebased on your workload. For details on modifying parameters, see Modify instance parameters.If you know the result set size: set
query_cache_sizeto 20% of the result set size.If you don't know the result set size: set
query_cache_sizeto 10% of `innodb_buffer_pool_size`.
ImportantWhen you resize your RDS instance,
query_cache_sizedoes not scale automatically. Reconfigure it immediately after the specification change takes effect.Set
query_cache_typeto 1 to enable Fast Query Cache. For details, see Modify instance parameters.
Test at the session level
Before changing the global configuration, test Fast Query Cache on a single connection without affecting other users:
-- Enable Fast Query Cache for this session only
SET SESSION query_cache_type = 1;

-- Disable Fast Query Cache for this session only
SET SESSION query_cache_type = 0;
Verify the cache is working
After enabling Fast Query Cache, run the following statement to check cache activity:
SHOW STATUS LIKE 'Qcache%';Key metrics to review:
| Metric | What it tells you |
|---|---|
Qcache_hits | Number of queries served from cache. A rising value confirms the cache is active |
Qcache_inserts | Number of queries added to the cache |
Qcache_lowmem_prunes | Number of cache entries evicted due to memory pressure. A high value means query_cache_size is too small |
Qcache_not_cached | Number of queries that were not cached (ineligible query types or SQL_NO_CACHE) |
A healthy cache shows Qcache_hits growing faster than Qcache_inserts.
Performance benchmarks
The following benchmarks compare QPS across three configurations on a dedicated RDS instance (4 CPU cores, 8 GB memory, 250 MB test data using Sysbench):
QC-OFF: no query cache
MySQL-QC: native MySQL query cache
Fast-QC: Fast Query Cache
All-hit read workload (100% cache hit ratio, 512 MB cache)
Uses the oltp_point_select script with POINT SELECT statements on primary keys.
Table 1. QPS for read queries with a cache hit ratio of 100%
| Number of concurrent queries | QC-OFF | MySQL-QC (QPS increase compared with QC-OFF) | Fast-QC (QPS increase compared with QC-OFF) |
|---|---|---|---|
| 1 | 8,093 | 8,771 (8.38%) | 9,261 (14.43%) |
| 8 | 62,262 | 65,686 (5.50%) | 75,313 (20.96%) |
| 16 | 97,083 | 73,027 (-24.78%) | 139,323 (43.51%) |
| 32 | 97,337 | 60,567 (-37.78%) | 200,978 (106.48%) |
| 64 | 106,283 | 60,216 (-43.34%) | 221,659 (108.56%) |
| 128 | 107,781 | 62,844 (-41.69%) | 231,409 (114.70%) |
| 256 | 106,694 | 63,832 (-40.17%) | 222,187 (108.25%) |
| 512 | 101,733 | 64,866 (-36.24%) | 203,789 (100.32%) |
| 1,024 | 89,548 | 62,291 (-30.44%) | 203,542 (127.30%) |
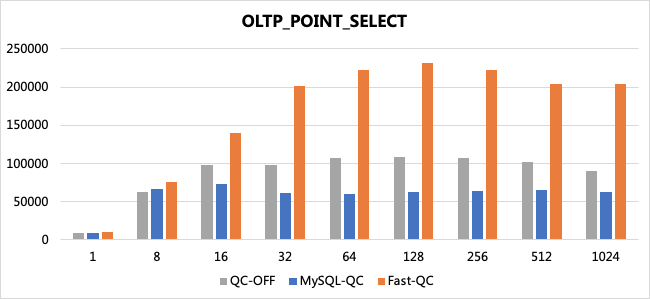
As concurrency increases, the native MySQL query cache QPS drops sharply — by up to 43% at 64 threads. Fast Query Cache QPS continues to climb, exceeding QC-OFF by up to 127% at 1,024 threads.
High hit-rate read workload (>80% cache hit ratio, 512 MB cache)
Uses the oltp_read_only script with range queries that return multiple records.
Table 2. QPS for read queries with a cache hit ratio higher than 80%
| Number of concurrent queries | QC-OFF | MySQL-QC (QPS increase compared with QC-OFF) | Fast-QC (QPS increase compared with QC-OFF) |
|---|---|---|---|
| 1 | 5099 | 6467 (26.83%) | 7022 (37.71%) |
| 8 | 28782 | 28651 (-0.46%) | 45017 (56.41%) |
| 16 | 35333 | 31099 (-11.98%) | 66770 (88.97%) |
| 32 | 34864 | 27610 (-20.81%) | 67623 (93.96%) |
| 64 | 35503 | 27518 (-22.49%) | 75981 (114.01%) |
| 128 | 35744 | 27733 (-22.41%) | 80396 (124.92%) |
| 256 | 35685 | 27738 (-22.27%) | 80925 (126.78%) |
| 512 | 35308 | 27398 (-22.40%) | 79323 (124.66%) |
| 1024 | 34044 | 26861 (-22.10%) | 75742 (122.48%) |
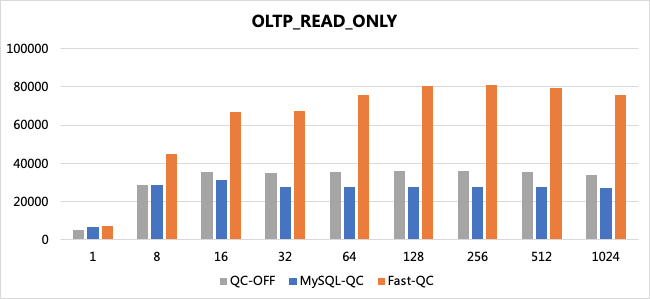
Fast Query Cache QPS continues to increase with concurrency and peaks at over 124% above QC-OFF. The native MySQL query cache degrades to 22% below QC-OFF at high concurrency.
Low hit-rate read workload (~10% cache hit ratio, 16 MB cache)
Uses the oltp_read_only script. A 16 MB cache is far smaller than the data set, causing frequent evictions and a hit ratio near 10%.
Table 3. QPS for read queries with a cache hit ratio of about 10%
| Number of concurrent queries | QC-OFF | MySQL-QC (QPS increase compared with QC-OFF) | Fast-QC (QPS increase compared with QC-OFF) |
|---|---|---|---|
| 1 | 5,004 | 4,727 (-5.54%) | 5,199 (3.90%) |
| 8 | 28,795 | 22,542 (-21.72%) | 28,578 (-0.75%) |
| 16 | 35455 | 24,064 (-32.13%) | 35,682 (0.64%) |
| 32 | 34,526 | 21,330 (-38.22%) | 35,871 (3.90%) |
| 64 | 35,514 | 19,791 (-44.27%) | 36,051 (1.51%) |
| 128 | 35,983 | 19,519 (-45.75%) | 36,253 (0.75%) |
| 256 | 35,695 | 19,168 (-46.30%) | 36,337 (1.80%) |
| 512 | 35,182 | 18,420 (-47.64%) | 35,972 (2.25%) |
| 1,024 | 33,915 | 20,168 (-40.53%) | 34,546 (1.86%) |
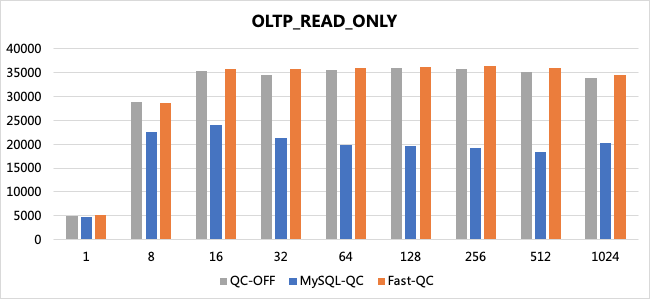
The native MySQL query cache loses up to 48% QPS in low hit-rate conditions. Fast Query Cache stays within 1–4% of QC-OFF, adding virtually no overhead even when the cache is mostly missing.
Mixed read/write workload
Uses the oltp_read_write script with frequent table updates that constantly invalidate cached entries.
Table 4. QPS for read and write queries
| Number of concurrent queries | QC-OFF | Fast-QC (QPS increase compared with QC-OFF) |
|---|---|---|
| 1 | 4,152 | 4,098 (-1.30%) |
| 8 | 21,359 | 21,195 (-0.77%) |
| 16 | 26,020 | 25,548 (-1.81%) |
| 32 | 27,595 | 26,996 (-2.17%) |
| 64 | 29,229 | 28,733 (-1.70%) |
| 128 | 29,265 | 28,828 (-1.49%) |
| 256 | 29,911 | 29,616 (-0.99%) |
| 512 | 29,148 | 28,816 (-1.14%) |
| 1,024 | 29,204 | 28,824 (-1.30%) |
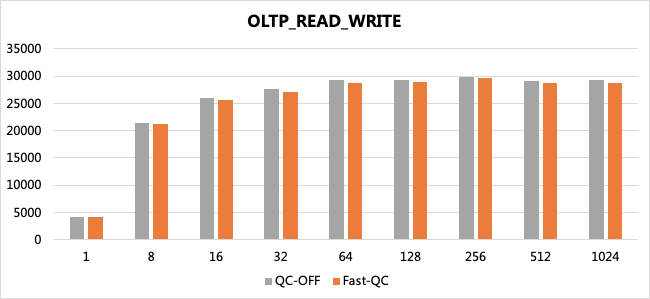
Fast Query Cache reduces QPS by at most 2.17% in mixed read/write workloads — the incremental invalidation mechanism keeps cache maintenance overhead low even under constant writes.
Cache sizing
query_cache_size directly affects hit ratio and QPS. The following benchmark shows the relationship between cache size and performance on a 10 GB dataset (100 tables, 400,000 records per table, 20% hot data, 64 concurrent threads, innodb_buffer_pool_size = 6 GB):
Table 5. QPS with different cache sizes
| query_cache_size (MB) | QC-OFF | Fast-QC hit ratio | Fast-QC (QPS increase compared with QC-OFF) |
|---|---|---|---|
| 64 | 98,236 | 22% | 99,440 (1.23%) |
| 128 | 98,236 | 45% | 114,155 (16.21%) |
| 256 | 98,236 | 72% | 140,668 (43.19%) |
| 512 | 98,236 | 82% | 151,260 (53.98%) |
| 1,024 | 98,236 | 84% | 153,866 (56.63%) |
| 2,048 | 98,236 | 87% | 159,597 (62.46%) |
| 4,096 | 98236 | 92% | 169,412 (72.45%) |
Key observations from this test:
Fast Query Cache never reduces QPS regardless of cache size, even at a 22% hit ratio.
For primary key queries, Fast Query Cache outperforms the native MySQL query cache at any hit ratio — in some cases by more than 90%.
For range queries and queries with
ORDER BY, Fast Query Cache provides better performance than the native MySQL query cache when the hit ratio is below 90%, and saves significant CPU resources.
The actual result set size for this test was 2.5 GB. Sizing to cover hot data (20% of 10 GB = 2 GB) would require roughly 512 MB–1 GB of query_cache_size to reach an 80%+ hit ratio in this scenario.
Allocating too much memory to query_cache_size reduces the memory available to the InnoDB Buffer Pool, which can hurt overall performance. Always reduce innodb_buffer_pool_size proportionally when increasing query_cache_size.
When to use Fast Query Cache
Use Fast Query Cache when
Your workload is read-intensive with low write frequency — for example, e-commerce product detail pages or reporting queries.
You want to cache specific tables with high read/write ratios. Check the
TABLE_STATISTICStable to identify these tables, then use theSQL_CACHEkeyword withquery_cache_type = 2to cache only those queries. For details on queryingTABLE_STATISTICS, see Performance Insight.
Before enabling Fast Query Cache globally, check your InnoDB Buffer Pool hit ratio:
SHOW GLOBAL STATUS LIKE 'Innodb_buffer_pool_reads';
SHOW GLOBAL STATUS LIKE 'Innodb_buffer_pool_read_requests';
Hit ratio = 1 - (Innodb_buffer_pool_reads / Innodb_buffer_pool_read_requests)
If the InnoDB Buffer Pool hit ratio is below 80%, the buffer pool is already under memory pressure. Enabling Fast Query Cache in this state — which requires reducing innodb_buffer_pool_size — is likely to hurt performance. Increase the instance memory or optimize queries before enabling the cache.
Avoid Fast Query Cache when
Write-intensive workloads: Frequent writes cause constant cache invalidation, adding overhead with little caching benefit. For high-frequency transaction systems, keep
query_cache_type = 0.Real-time data requirements: Cached results may lag behind live data. For use cases like financial market data where stale reads are unacceptable, disable the cache or use
SQL_NO_CACHEper query.
Choose the right query_cache_type value
query_cache_type supports session-level changes, so you can adjust caching behavior per connection without modifying the global setting:
SET SESSION query_cache_type = 1;  -- enable for this session
SET SESSION query_cache_type = 0; -- disable for this session| Value | Behavior | Best for |
|---|---|---|
| 0 | Globally disable Fast Query Cache | Write-intensive workloads or very low hit-rate scenarios |
| 1 | Enable for all qualifying queries; use SQL_NO_CACHE to skip specific statements | Read-intensive workloads with infrequent data changes |
| 2 | Disabled globally; only caches queries with SQL_CACHE | Large datasets, unpredictable access patterns, or when you need table-level caching control |