In business scenarios, jobs often need to produce results within a specific timeframe to support decision-making. You can use the MaxCompute Logview feature to monitor job status and diagnose slow jobs. This topic describes common causes of slow jobs, analysis methods, and potential solutions.
Analyze failed jobs
When a job fails, you can view the error message on the Result tab in Logview. Logview opens this tab by default for failed jobs.
Common causes of job failure include:
SQL syntax errors. In this case, no Directed Acyclic Graphs (DAGs) or Fuxi jobs are generated because the job is not submitted to the compute cluster.
User-defined function (UDF) errors. On the Job Details tab, check the DAG to identify the problematic UDF. Then, check the StdOut or StdErr logs for error messages.
Other errors. For more information, see Error codes and solutions.
Analyze slow jobs
Compilation phase
In the compilation phase, a job has a Logview ID but no execution plan. The sub-status history (SubStatusHistory) shows sub-phases such as scheduling, optimization, physical execution plan generation, and cross-cluster data replication.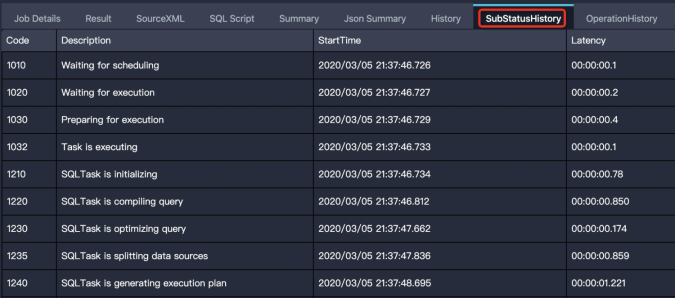 Issues in this phase usually cause the job to get stuck in a sub-phase. The following sections describe causes and solutions for jobs stuck in each sub-phase.
Scheduling phase
Symptom: The sub-status is
Waiting for cluster resource, and the job is queued for compilation.Cause: The compute cluster has a resource shortage.
Solution: Check the cluster status. Wait for resources to become available. Subscription customers can consider scaling out resources.
Optimization phase
Symptom: The sub-status is
SQLTask is optimizing query, indicating the optimizer is generating the execution plan.Cause: The execution plan is complex and requires a long time to optimize.
Solution: Wait for the process to complete. This usually takes less than 10 minutes.
Physical execution plan generation phase
Symptom: The sub-status is
SQLTask is generating execution plan.Cause 1: Too many partitions are being read.
Solution: Optimize your SQL queries to read fewer partitions. Use partition pruning, filter unnecessary partitions, or break large jobs into smaller ones. For more information, see Evaluating Partition Pruning Effectiveness.
Cause 2: There are too many small files. This is often caused by:
Incorrect Tunnel upload operations. For example, creating a new
upload sessionfor each uploaded file. For details, see Tunnel Command FAQ.INSERT INTOoperations on a partitioned table generating a new file in the partition directory.
Solution:
Use the TunnelBufferedWriter interface to upload files. This helps avoid creating excessive small files.
Manually merge small files. For details, see Merge small files.
NoteYou can merge small files if the count exceeds 10,000. The system attempts to merge small files daily, but manual merging may be required if automatic merging fails.
Cross-cluster data replication phase
Symptom: The sub-status list shows multiple
Task rerunentries, and the Result tab shows errorFAILED: ODPS-0110141:Data version exception. The job status is Running. This indicates cross-cluster data replication is active.Cause 1: The project was recently migrated to a new cluster. Cross-cluster replication is common for the first few days after migration.
Solution: This is expected behavior. Wait for replication to complete.
Cause 2: The project was migrated, but partition filtering was not handled correctly, causing older partitions to be read.
Solution: Filter out old partitions that do not need to be read.
Execution phase
In the Execution phase, the Job Details page shows an execution plan, but the job status remains Running. Common causes for delays include resource waiting, data skew, inefficient UDFs, and data bloat.
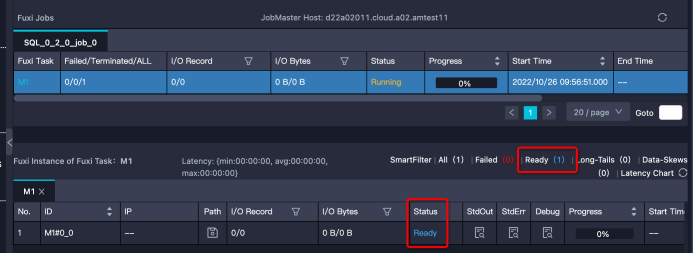
Waiting for resources
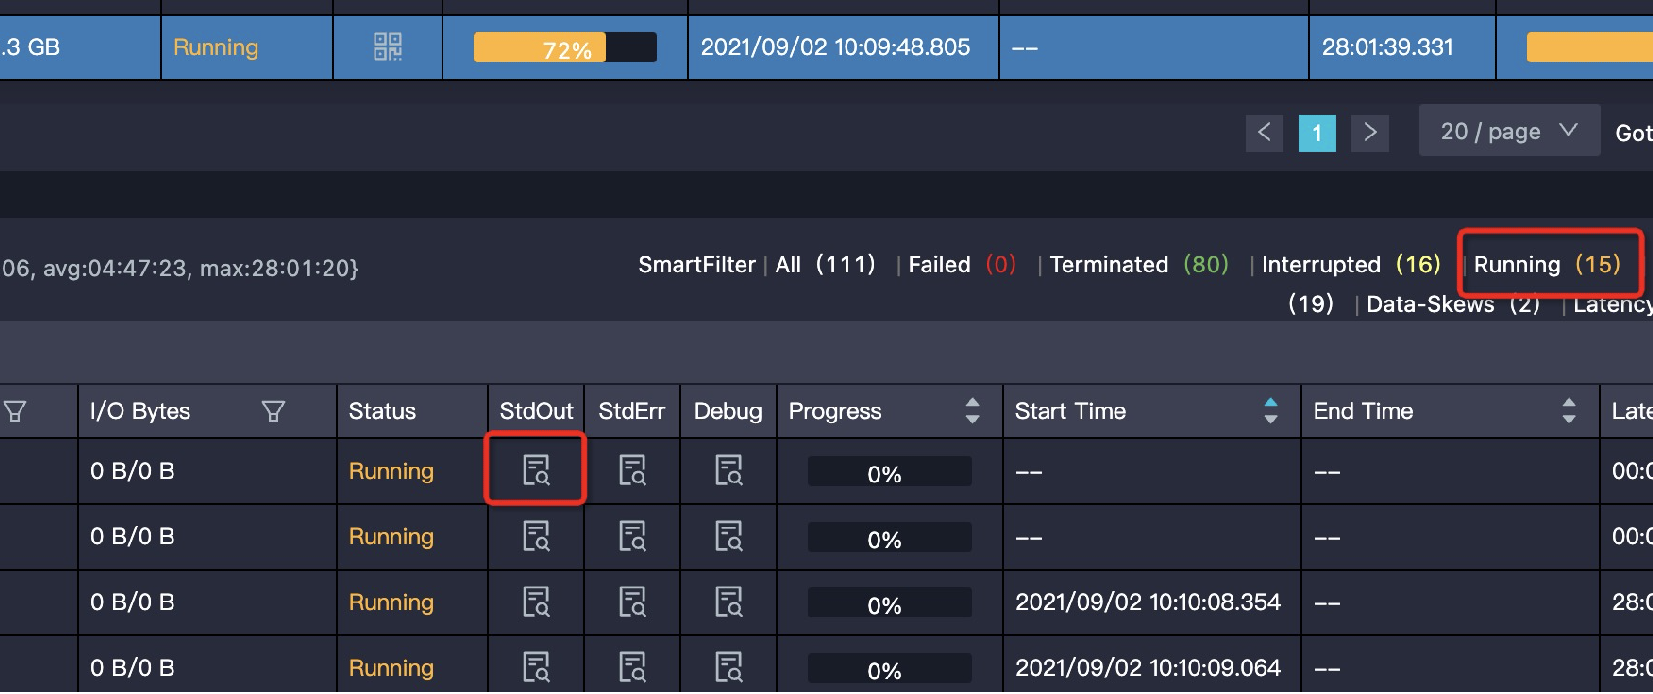
Characteristic: Instances are in Ready status, or some are Running while others are Ready. Note: If an instance is Ready but has a Debug history, it might be retrying after failure, not waiting for resources.
Solution:
Check if queuing is normal. Check
Queue Lengthin Logview.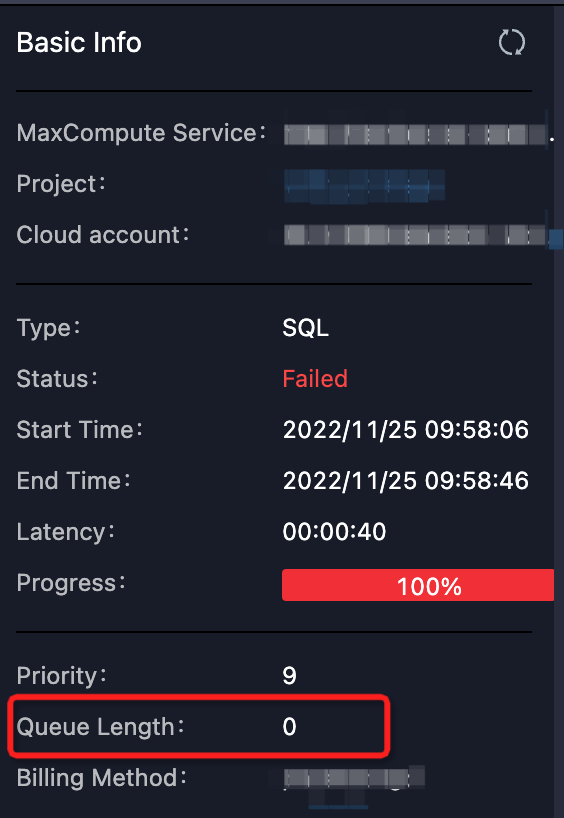 Or check quota group resource usage in the MaxCompute console. If usage is high, queuing is expected.
Check running jobs in the quota group.
A large low-priority job (or many small jobs) might be consuming resources. Contact the job owner to suspend the job if needed.
Use a project in a different quota group.
Scale out resources (for subscription customers).
Data skew
Characteristic: Most instances have finished, but a few "long tail" instances are still running. In the figure, most are done, but 21 are still Running, likely processing more data.
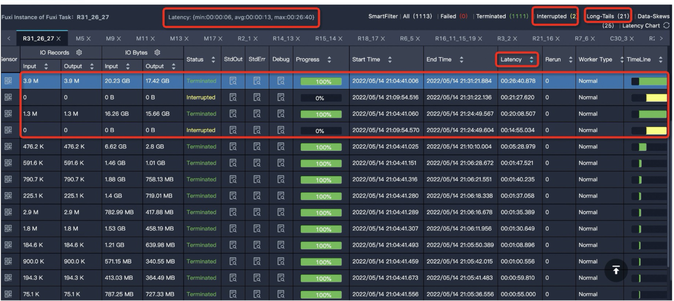
Solution: See Data skew optimization for causes and solutions.
Inefficient UDF execution
This includes UDFs, UDAFs, UDTFs, UDJs, and UDTs.
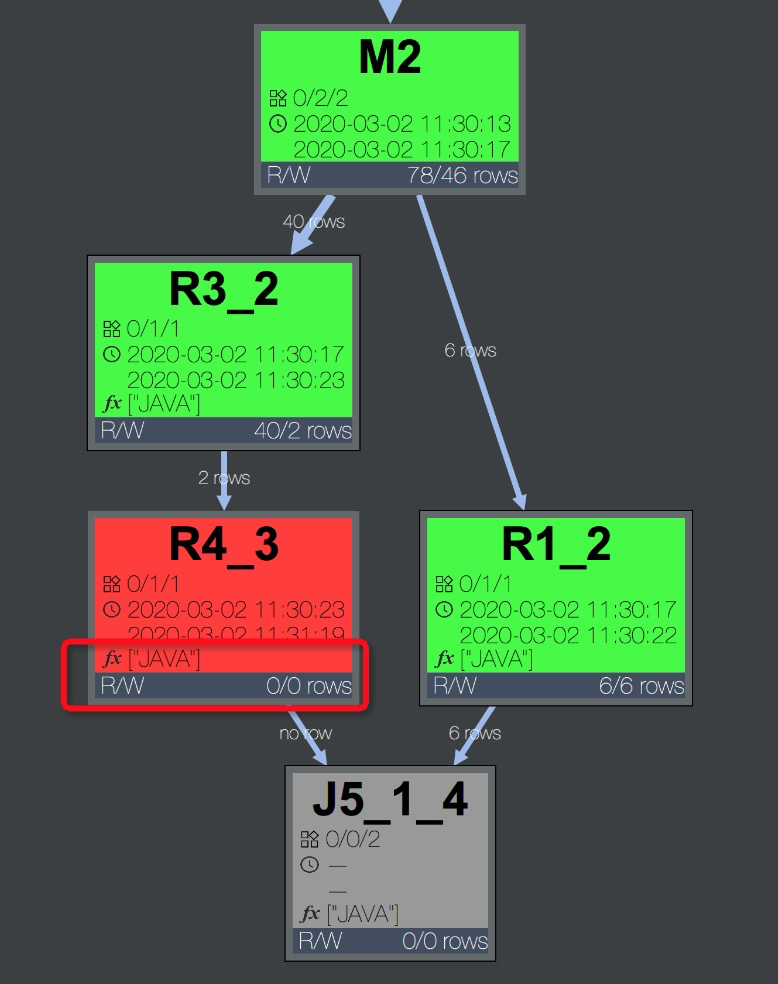
Characteristic: The task is inefficient and contains a user-defined extension. Errors like
Fuxi job failed - WorkerRestart errCode:252,errMsg:kInstanceMonitorTimeoutmay occur.Troubleshooting: Check the DAG on the Job Details tab for UDFs. For example, task R4_3 in the figure uses a Java UDF.
 Expand the Operator view to see UDF names.
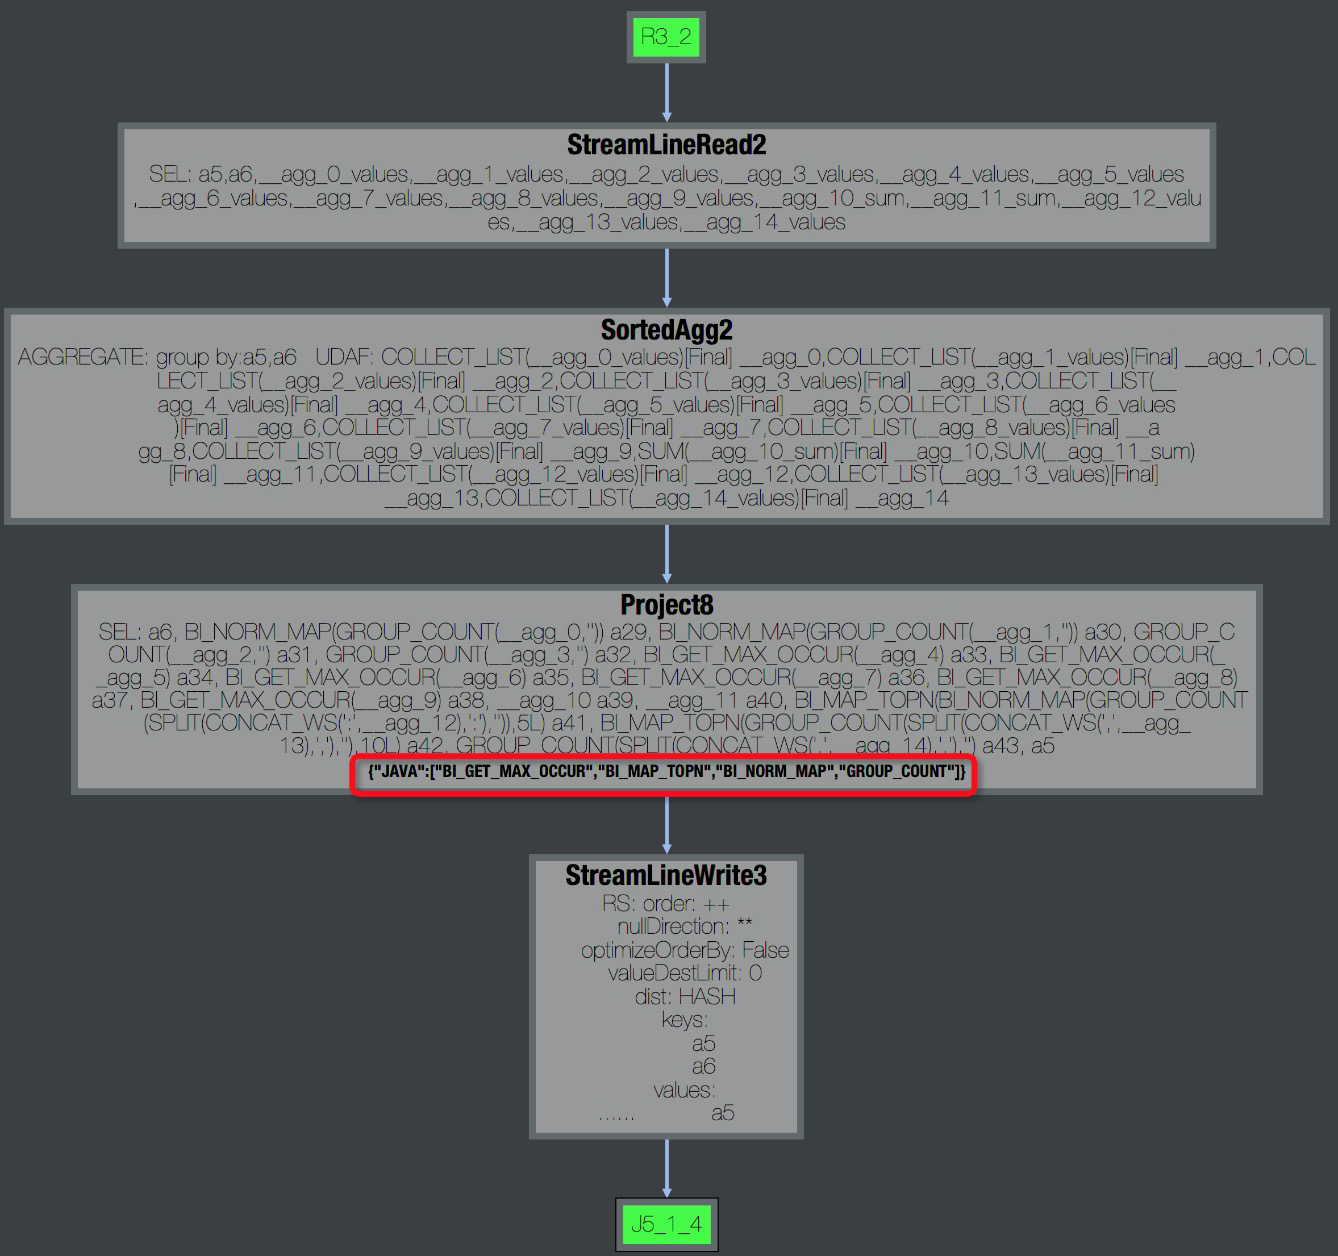 Check StdOut for processing speed. Speeds below tens of thousands of records/s often indicate performance issues.
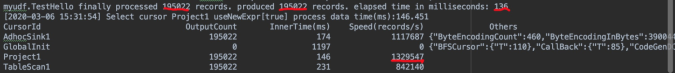
Solution:
Check UDF for errors.
Errors can be data-dependent (e.g., infinite loops). Download sample data via MaxCompute Studio for local debugging. See Java UDF and Python UDF.
Check for naming conflicts with built-in functions.
Ensure your UDF does not unintentionally override a built-in function.
Use built-in functions.
Built-in functions are more efficient and optimized. See Built-in functions.
Split UDFs. Use built-in functions for supported parts and UDFs only where necessary.
Optimize the UDF `evaluate` method.
Perform one-time initializations outside the `evaluate` method to avoid repetition.
Estimate UDF execution time.
Simulate locally to estimate runtime. The default limit is 30 minutes. UDFs must return data or report `context.progress()` within this time. You can extend the timeout if needed:
-- Set UDF timeout in seconds (default 600, range 0-3600)
set odps.sql.udf.timeout = 1800;
Adjust memory parameters.
Inefficiency can stem from memory issues (e.g., sorting large data in memory, frequent GC).
Adjust JVM memory if needed, but address the root cause in business logic.
-- Set max JVM heap memory in MB (default 1024, range 256-12288) set odps.sql.udf.jvm.memory = 2048;NoteTo allow partition pruning with UDFs, use the
UdfPropertyannotation to mark the function as deterministic:@com.aliyun.odps.udf.annotation.UdfProperty(isDeterministic = true) public class AnnotatedUdf extends com.aliyun.odps.udf.UDF { public String evaluate(String x) { return x; } }Rewrite SQL to use UDFs in partition filtering:
-- Original
SELECT * FROM t WHERE pt = udf('foo');
-- Rewritten
SELECT * FROM t WHERE pt = (SELECT udf('foo'));
Data bloat
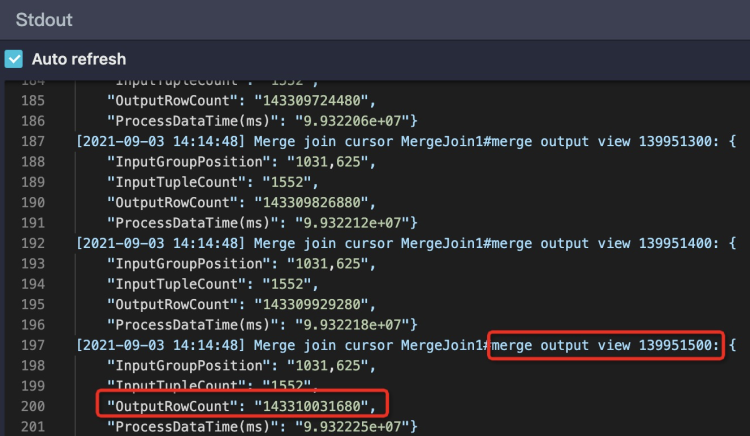
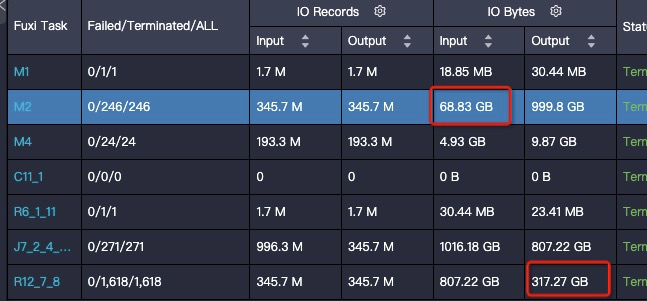
Characteristic: Output volume is significantly larger than input volume (e.g., 1 GB becomes 1 TB). Check I/O Records. If stuck in Join phase, check StdOut for Merge Join logs. Excessive output records indicate data bloat.
Solution:
Check for code errors: Incorrect JOIN conditions, Cartesian products, or UDTF errors.
Check for aggregation-induced bloat:
Issues arise when:
Using `DISTINCT` with aggregation on different dimensions.
Using GROUPING SETS, CUBE, or ROLLUP, or functions like COLLECT_LIST and MEDIAN that retain intermediate data.
Avoid join-induced bloat.
Aggregate dimension tables before joining to avoid row expansion.
Manage Grouping Set bloat. Manually set parallelism for downstream tasks:
set odps.stage.reducer.num = xxx;
set odps.stage.joiner.num = xxx;
Final phase
Sometimes, a job status remains Running even after Fuxi jobs are Terminated.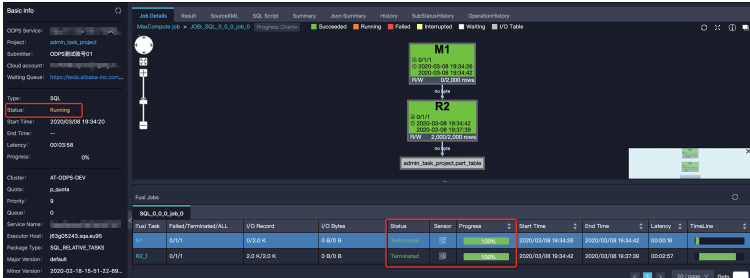 This generally occurs when:
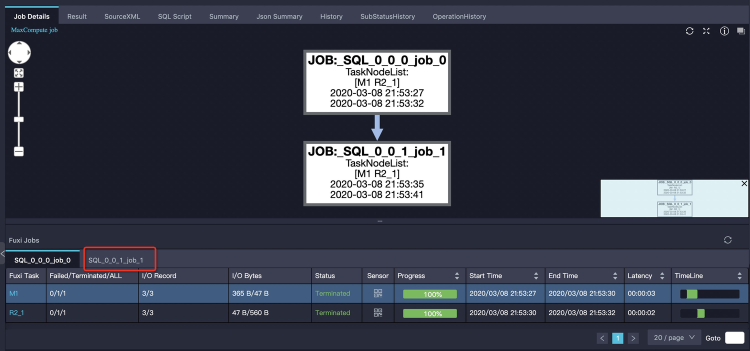
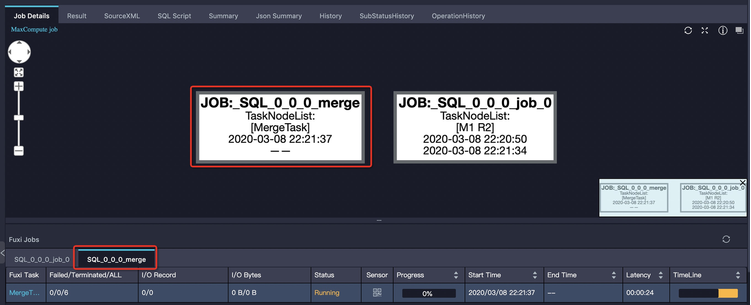
The SQL job contains multiple Fuxi jobs (e.g., subqueries, automatic merge jobs).
Metadata updates or other control cluster operations take a long time.
Subquery multi-stage execution
Some subqueries (e.g.,
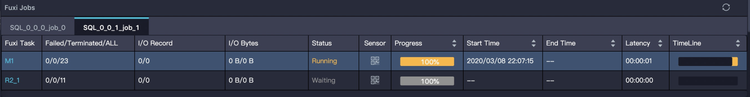
SELECT DISTINCTused inINclause) execute separately first.SELECT product, sum(price) FROM sales WHERE ds in (SELECT DISTINCT ds FROM t_ds_set) GROUP BY product;Check the Logview tabs. The first tab might be done while the second is running.
Too many small files
Excessive small files affect storage (Pangu pressure) and computation (low efficiency).
Solution: Check for a separate Merge Task tab in Logview. This task merges small files to improve downstream performance.
Avoid using
SELECTstatements that output many small files. Use Tunnel commands instead. Ensure the small file merge threshold is configured correctly. See Merge small files.Dynamic partition metadata update
Symptom: Metadata updates for many dynamic partitions can be slow. Logview shows
SQLTask is updating meta information.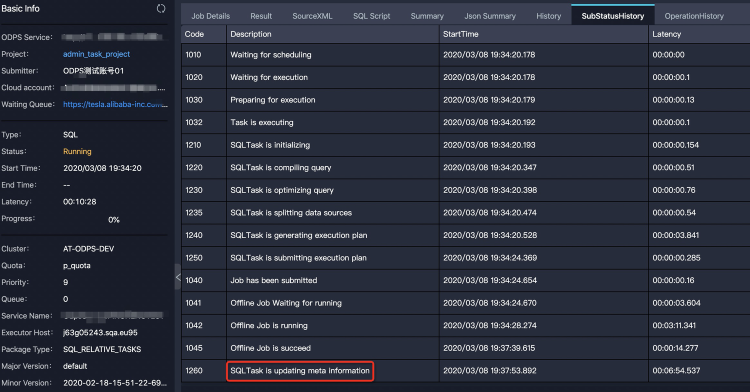
Output file size increases
Symptom: Output file size is much larger than input, despite similar record counts.
Solution: Data distribution affects compression. Sorting data improves compression. In a JOIN, ensure the sorting column (Join Key) groups similar data. For example, change:
on t1.query = t2.query and t1.item_id = t2.item_idto:
on t1.item_id = t2.item_id and t1.query = t2.queryif `item_id` has better grouping characteristics.
Alternatively, use Z-order sorting or
DISTRIBUTE BY ... SORT BYto improve compression, though this increases computation cost.