Alibaba Cloud Logstash includes the logstash-input-jdbc plug-in by default. Use this plug-in with a pipeline configuration to continuously pull full or incremental data from ApsaraDB RDS for MySQL and index it into Alibaba Cloud Elasticsearch — no additional installation required. This approach is suitable if you want to synchronize full data and can accept latency of a few seconds, or if you want to query specific data at a time.
How it works
The plug-in queries ApsaraDB RDS for MySQL on a configurable schedule using a SQL statement. On each run, it records the highest value of a tracking column (such as update_time) and uses that value as the lower bound for the next query. This polling approach captures newly inserted and updated rows, but it cannot detect deleted rows — deletions must be handled separately in Elasticsearch.
Limitations
Understand these constraints before you begin:
-
Same time zone required. The RDS instance, Elasticsearch cluster, and Logstash cluster must be in the same time zone. A mismatch causes timestamp fields to have a time zone offset after synchronization.
-
Document IDs must map to the MySQL primary key. Set
document_idto%{id}in the output configuration, whereidis the primary key column in MySQL. This mapping allows the plug-in to overwrite the correct Elasticsearch document when a row is updated in MySQL. Elasticsearch handles overwrites the same way as a standard update operation: it deletes the old document and indexes the new one. -
Deletions are not propagated. The plug-in queries only rows inserted or updated after
sql_last_value, so it cannot detectDELETEoperations in MySQL. To remove a document from Elasticsearch, run the corresponding delete command directly on the cluster. -
Each row must include an insert/update timestamp column. The plug-in uses this column as the tracking column to determine which rows to fetch on the next run. By default,
sql_last_valuestarts at Thursday, 1 January 1970. -
Security parameters are mandatory. Always append
allowLoadLocalInfile=false&autoDeserialize=falsetojdbc_connection_string. Without these parameters, the pipeline configuration check fails.
Prerequisites
Before you begin, ensure that you have:
-
An ApsaraDB RDS for MySQL instance (this example uses MySQL 5.7)
-
An Alibaba Cloud Elasticsearch cluster (this example uses Elasticsearch V7.10)
-
An Alibaba Cloud Logstash cluster
Deploy all three resources in the same virtual private cloud (VPC) to keep traffic private and avoid NAT configuration. If your RDS instance uses a public endpoint, configure a Source Network Address Translation (SNAT) entry for the Logstash cluster, enable the public endpoint on the RDS instance, and add the Logstash node IP addresses to the RDS whitelist. For details, see Configure a NAT gateway for data transmission over the Internet.
Synchronize data from ApsaraDB RDS for MySQL to Elasticsearch
Step 1: Prepare the environment
-
Enable the Auto Indexing feature for your Elasticsearch cluster so that Logstash can create indexes automatically. For details, see Access and configure an Elasticsearch cluster.
-
Upload a JDBC driver that is compatible with your MySQL version to the Logstash cluster. This example uses
mysql-connector-java-5.1.48.jar. For details, see Configure third-party libraries. -
Create a test table and insert sample data in your RDS instance:
CREATE table food ( id int PRIMARY key AUTO_INCREMENT, name VARCHAR (32), insert_time DATETIME, update_time DATETIME ); INSERT INTO food values(null,'Chocolates',now(),now()); INSERT INTO food values(null,'Yogurt',now(),now()); INSERT INTO food values(null,'Ham sausage',now(),now()); -
Add the Logstash cluster node IP addresses to the RDS whitelist. Find the IP addresses on the Basic Information page of your Logstash cluster.
Step 2: Configure a Logstash pipeline
-
Go to the Logstash Clusters page in the Alibaba Cloud Elasticsearch console.
-
In the top navigation bar, select the region where your cluster resides. On the Logstash Clusters page, click the cluster ID.
-
In the left-side navigation pane, click Pipelines, then click Create Pipeline.
-
Enter a Pipeline ID and paste the following configuration into the Config Settings field. Replace the placeholder values with your own.
To get your Logstash cluster ID, see View the basic information of a cluster. For the full list of supported input parameters, see Logstash Jdbc input plugin. For output parameters, see Logstash configuration files.
input { jdbc { # JDBC driver class for MySQL jdbc_driver_class => "com.mysql.jdbc.Driver" # Path to the driver JAR uploaded in Step 1.2. # Format: /ssd/1/share/<Logstash cluster ID>/logstash/current/config/custom/<driver filename> jdbc_driver_library => "/ssd/1/share/<Logstash cluster ID>/logstash/current/config/custom/mysql-connector-java-5.1.48.jar" # RDS connection string. Use the internal endpoint when instances share a VPC. # allowLoadLocalInfile=false and autoDeserialize=false are required — omitting them causes a check failure. jdbc_connection_string => "jdbc:mysql://rm-bp1xxxxx.mysql.rds.aliyuncs.com:3306/<Database name>?useUnicode=true&characterEncoding=utf-8&useSSL=false&allowLoadLocalInfile=false&autoDeserialize=false" # Credentials for the RDS database user jdbc_user => "xxxxx" jdbc_password => "xxxx" # Enable paging and set page size to control memory usage on large tables (default: false) jdbc_paging_enabled => "true" jdbc_page_size => "50000" # Fetch only rows updated after the last recorded value (incremental sync) statement => "select * from food where update_time >= :sql_last_value" # Run every minute (Rufus cron expression) schedule => "* * * * *" # Persist the last run value so the next run starts where this one ended record_last_run => true # Store the tracking value in this file. Use the /ssd/1/<cluster ID>/logstash/data/ path # to ensure write permissions. Replace <Logstash cluster ID> with your cluster ID. last_run_metadata_path => "/ssd/1/<Logstash cluster ID>/logstash/data/last_run_metadata_update_time.txt" # Set clean_run to true to reset and re-sync all data from the beginning clean_run => false # Track by timestamp column to capture inserts and updates. # The values in this column must be sorted in ascending order. tracking_column_type => "timestamp" use_column_value => true tracking_column => "update_time" } } filter { } output { elasticsearch { hosts => "http://es-cn-0h****dd0hcbnl.elasticsearch.aliyuncs.com:9200" index => "rds_es_dxhtest_datetime" user => "elastic" password => "xxxxxxx" # Map the Elasticsearch document ID to the MySQL primary key document_id => "%{id}" } } -
Click Next to configure pipeline parameters.
WarningSaving and deploying the pipeline triggers a restart of the Logstash cluster. Confirm that a restart will not affect your workloads before proceeding.
Parameter Description Default Pipeline Workers Number of threads running filter and output plug-ins in parallel. Increase this value when CPU resources are underutilized or events are backing up. Number of vCPUs Pipeline Batch Size Maximum events a single worker collects from inputs before running filters and outputs. Higher values increase throughput but require more JVM heap memory. 125 Pipeline Batch Delay How long a worker waits for additional events before starting a small batch, in milliseconds. 50 Queue Type Internal queue model for buffering events. MEMORY: in-memory queue. PERSISTED: disk-based ACKed queue for durability. MEMORY Queue Max Bytes Maximum size of the queue on disk. Must be less than your available disk capacity. 1024 MB Queue Checkpoint Writes Maximum events written before a checkpoint is forced (persistent queues only). Set to 0 for no limit. 1024 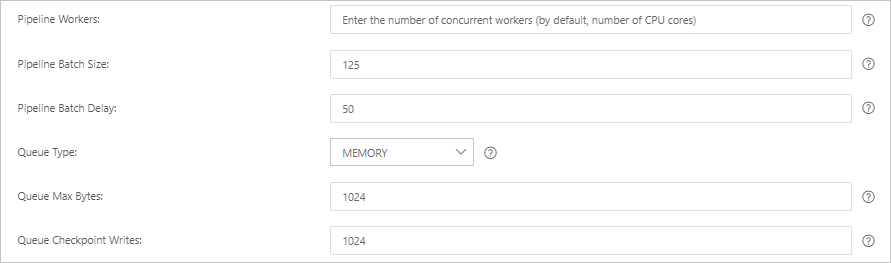
-
Click Save and Deploy to restart the Logstash cluster and apply the configuration immediately. Alternatively, click Save to store the configuration and trigger a cluster change, but the settings do not take effect yet. To deploy later, go to the Pipelines page, find the pipeline, and click Deploy Now in the Actions column.
Step 3: Verify the synchronization
-
Log on to the Kibana console of your Elasticsearch cluster. For details, see Log on to the Kibana console.
-
In the upper-left corner, click the
 icon and choose .
 -
On the Console tab, run the following command to confirm the three rows were synchronized:
GET rds_es_dxhtest_datetime/_count
{
  "query": {"match_all": {}}
}
Expected response:
{ "count" : 3, "_shards" : { "total" : 1, "successful" : 1, "skipped" : 0, "failed" : 0 } } -
Update and insert rows in MySQL to test incremental synchronization:
UPDATE food SET name='Chocolates',update_time=now() where id = 1; INSERT INTO food values(null,'Egg',now(),now()); -
After the next scheduled run (up to one minute), query Elasticsearch to confirm the changes:
-
Search for the updated row:
GET rds_es_dxhtest_datetime/_search
{
  "query": {
    "match": {
      "name": "Chocolates"
    }
  }
}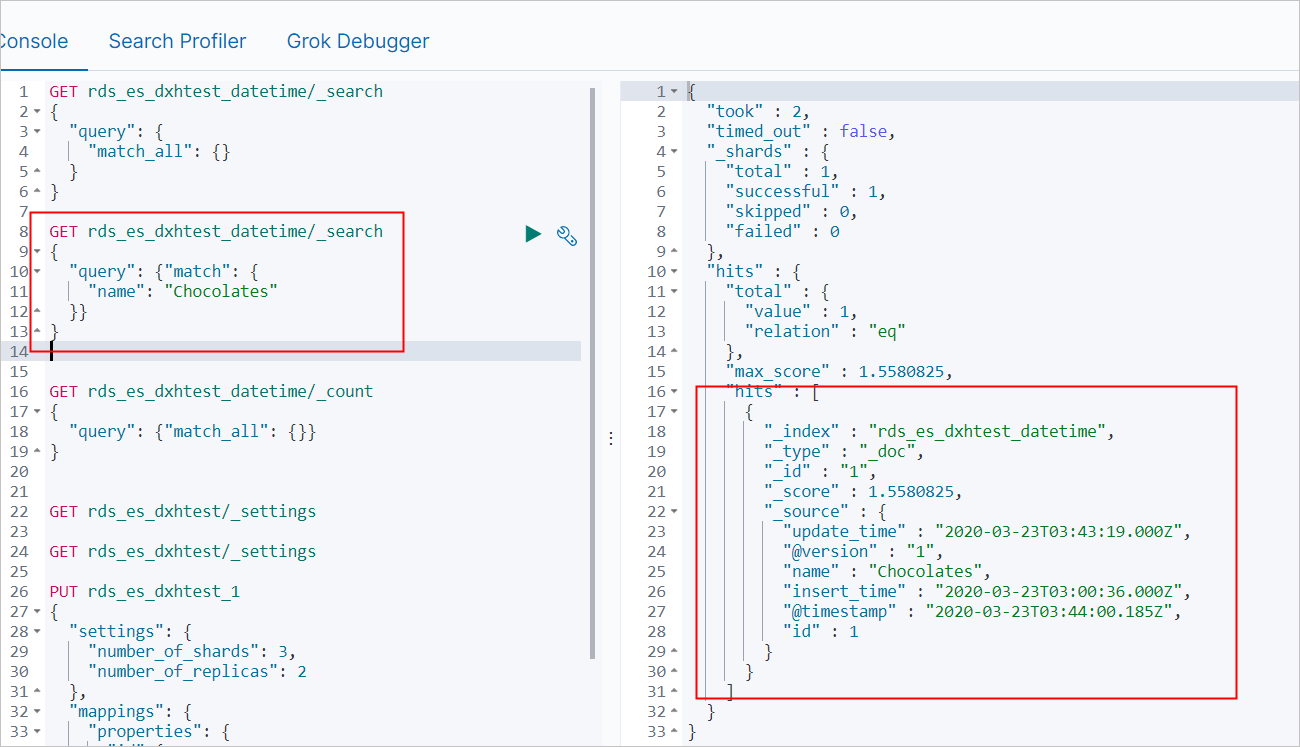
-
Query all documents:
GET rds_es_dxhtest_datetime/_search
{
  "query": {
    "match_all": {}
  }
}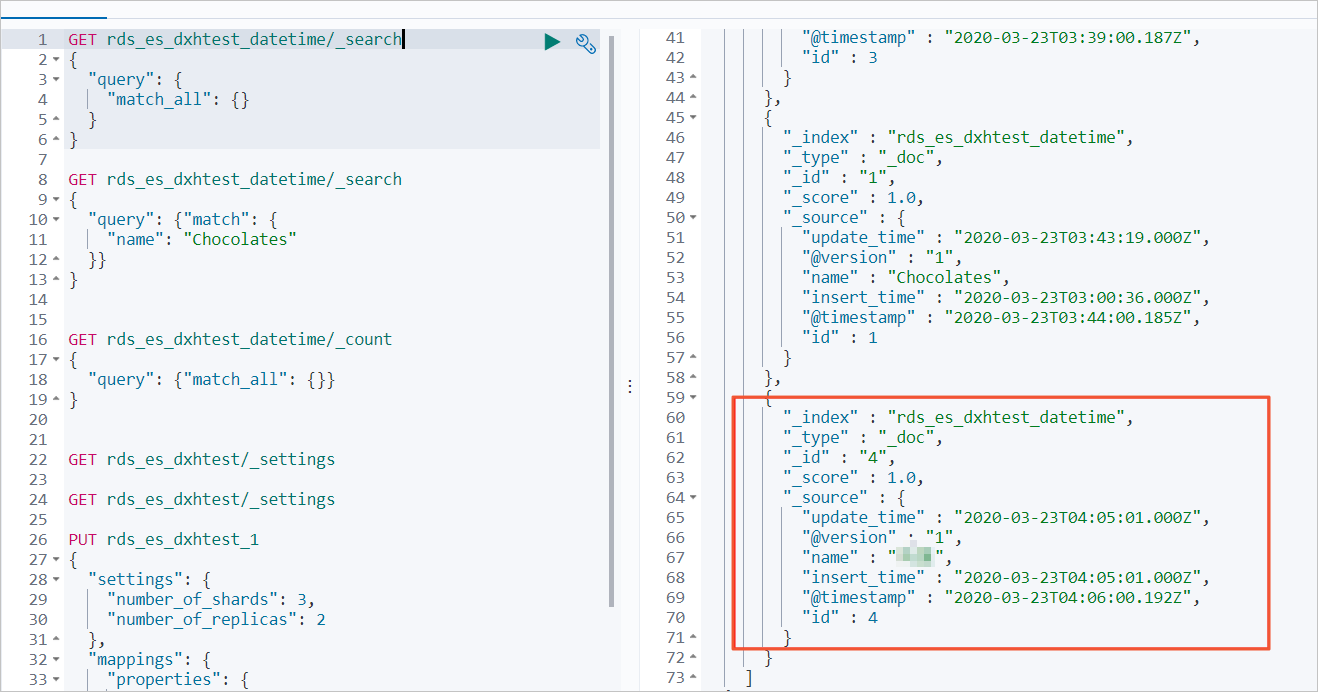
-
FAQ
My pipeline is stuck in the initializing state, data is inconsistent after sync, or the database connection fails. What should I do?
Check the Logstash cluster logs first. Go to the Logstash console and use the Query logs feature to view error details. For details, see Query logs.
If a cluster update is in progress when you apply a fix, pause the update first. See View the progress of a cluster task. After the fix, the system restarts the cluster and resumes the update automatically.
The following table lists common causes and solutions:
| Cause | Solution |
|---|---|
| Logstash node IP addresses not in the RDS whitelist | Add the Logstash node IP addresses to the RDS whitelist. To get the IP addresses, see View the basic information of a cluster. For whitelist configuration, see Use a database client or the CLI to connect to an ApsaraDB RDS for MySQL instance. |
| Syncing from a self-managed MySQL on ECS: node private IPs and ports not in the ECS security group | Add the Logstash node private IP addresses and internal ports to the ECS security group. See Add a security group rule. |
| Elasticsearch cluster not in the same VPC as the Logstash cluster | Either purchase an Elasticsearch cluster in the same VPC, or configure a NAT gateway for cross-Internet access. See Create an Alibaba Cloud Elasticsearch cluster and Configure a NAT gateway for data transmission over the Internet. |
| Incorrect RDS endpoint or non-standard port | Get the correct endpoint and port from the RDS console. See View and manage instance endpoints and ports. Use the internal endpoint. For public endpoint access, configure a NAT gateway first. |
| Auto Indexing disabled on the Elasticsearch cluster | Enable Auto Indexing. See Configure the YML file. |
| Cluster load too high | Upgrade the cluster configuration. See Upgrade the configuration of a cluster. To diagnose load issues, enable X-Pack Monitoring on the Logstash cluster. See Enable the X-Pack Monitoring feature. |
| JDBC driver not uploaded | Upload the driver file. See Configure third-party libraries. |
file_extend specified in the pipeline config but logstash-output-file_extend not installed |
Install the plug-in, or remove the file_extend parameter. See Install or remove a Logstash plug-in. |
For more troubleshooting guidance, see FAQ about data transfer by using Logstash.
How do I sync data from multiple MySQL tables to separate Elasticsearch indexes?
Define multiple jdbc blocks in the input section, assign a type value to each, and use if[type] conditions in the output section to route each table's data to a different index:
input {
    jdbc {
      jdbc_driver_class => "com.mysql.jdbc.Driver"
      jdbc_driver_library => "/ssd/1/share/<Logstash cluster ID>/logstash/current/config/custom/mysql-connector-java-5.1.48.jar"
      jdbc_connection_string => "jdbc:mysql://rm-bp1xxxxx.mysql.rds.aliyuncs.com:3306/<Database name>?useUnicode=true&characterEncoding=utf-8&useSSL=false&allowLoadLocalInfile=false&autoDeserialize=false"
      jdbc_user => "xxxxx"
      jdbc_password => "xxxx"
      jdbc_paging_enabled => "true"
      jdbc_page_size => "50000"
      statement => "select * from tableA where update_time >= :sql_last_value"
      schedule => "* * * * *"
      record_last_run => true
      last_run_metadata_path => "/ssd/1/<Logstash cluster ID>/logstash/data/last_run_metadata_update_time.txt"
      clean_run => false
      tracking_column_type => "timestamp"
      use_column_value => true
      tracking_column => "update_time"
      type => "A"
    }
    jdbc {
      jdbc_driver_class => "com.mysql.jdbc.Driver"
      jdbc_driver_library => "/ssd/1/share/<Logstash cluster ID>/logstash/current/config/custom/mysql-connector-java-5.1.48.jar"
      jdbc_connection_string => "jdbc:mysql://rm-bp1xxxxx.mysql.rds.aliyuncs.com:3306/<Database name>?useUnicode=true&characterEncoding=utf-8&useSSL=false&allowLoadLocalInfile=false&autoDeserialize=false"
      jdbc_user => "xxxxx"
      jdbc_password => "xxxx"
      jdbc_paging_enabled => "true"
      jdbc_page_size => "50000"
      statement => "select * from tableB where update_time >= :sql_last_value"
      schedule => "* * * * *"
      record_last_run => true
      last_run_metadata_path => "/ssd/1/<Logstash cluster ID>/logstash/data/last_run_metadata_update_time.txt"
      clean_run => false
      tracking_column_type => "timestamp"
      use_column_value => true
      tracking_column => "update_time"
      type => "B"
    }
}
output {
    if[type] == "A" {
        elasticsearch {
            hosts => "http://es-cn-0h****dd0hcbnl.elasticsearch.aliyuncs.com:9200"
            index => "rds_es_dxhtest_datetime_A"
            user => "elastic"
            password => "xxxxxxx"
            document_id => "%{id}"
        }
    }
    if[type] == "B" {
        elasticsearch {
            hosts => "http://es-cn-0h****dd0hcbnl.elasticsearch.aliyuncs.com:9200"
            index => "rds_es_dxhtest_datetime_B"
            user => "elastic"
            password => "xxxxxxx"
            document_id => "%{id}"
        }
    }
}