This topic describes how to configure X-Pack monitoring for your Alibaba Cloud Logstash cluster. After you enable X-Pack monitoring and associate an Alibaba Cloud Elasticsearch cluster, you can monitor your Logstash cluster in the Kibana console.
Prerequisites
Before you begin, ensure that you have completed the following:
Create an Alibaba Cloud Logstash cluster. For instructions, see Create an Alibaba Cloud Logstash cluster.
Create an Alibaba Cloud Elasticsearch cluster. For instructions, see Create an Alibaba Cloud Elasticsearch cluster. This cluster must be in the same virtual private cloud (VPC) as your Logstash cluster. We recommend using the same major version for both clusters. If the versions differ, ensure they are compatible.
After you create the Alibaba Cloud Elasticsearch cluster, complete the following tasks:
Enable public access to Kibana. For instructions, see Connect to a cluster by using Kibana.
Enable auto indexing for the cluster, or manually add the +.monitoring-logstash* or +.monitoring* index patterns. For more information, see Configure YML parameters and Index API.
Procedure
Go to the Logstash Clusters page.
Navigate to the target cluster.
In the top navigation bar, select the region where the cluster resides.
On the Logstash Clusters page, find the cluster and click its ID.
In the left-side navigation pane, click Cluster Monitoring.
In the Monitoring and Alerting Configuration section, click X-Pack Monitoring to the right of Edit.
In the Modify Configuration panel, select Enable and select the Alibaba Cloud Elasticsearch cluster to associate.
Parameter
Description
Elasticsearch Clusters
Select the Alibaba Cloud Elasticsearch cluster to associate. The cluster must be in the same virtual private cloud (VPC) as your Logstash cluster. We recommend that the clusters run the same major version. If the major versions differ, ensure they are compatible.
Username
The username for the Alibaba Cloud Elasticsearch cluster.
Password
The password for the Alibaba Cloud Elasticsearch cluster.
Click Test Connectivity.
If no error is reported, the connection is successful.
WarningModifying the X-Pack monitoring configuration triggers a cluster restart. Proceed only if this restart will not disrupt your services.
Click OK.
The system returns to the Cluster Monitoring page and triggers a cluster restart.
After the restart is complete, view the Logstash monitoring data.
After the restart is complete, the status of X-Pack Monitoring changes to Enable, and the associated Alibaba Cloud Elasticsearch cluster appears on the page.
ImportantYou can view Logstash monitoring data in the Kibana console only after the restart is complete.
On the Cluster Monitoring page, click Kibana Console.
Enter your username and password to log in to the Kibana console.
For instructions, see Log in to the Kibana console.
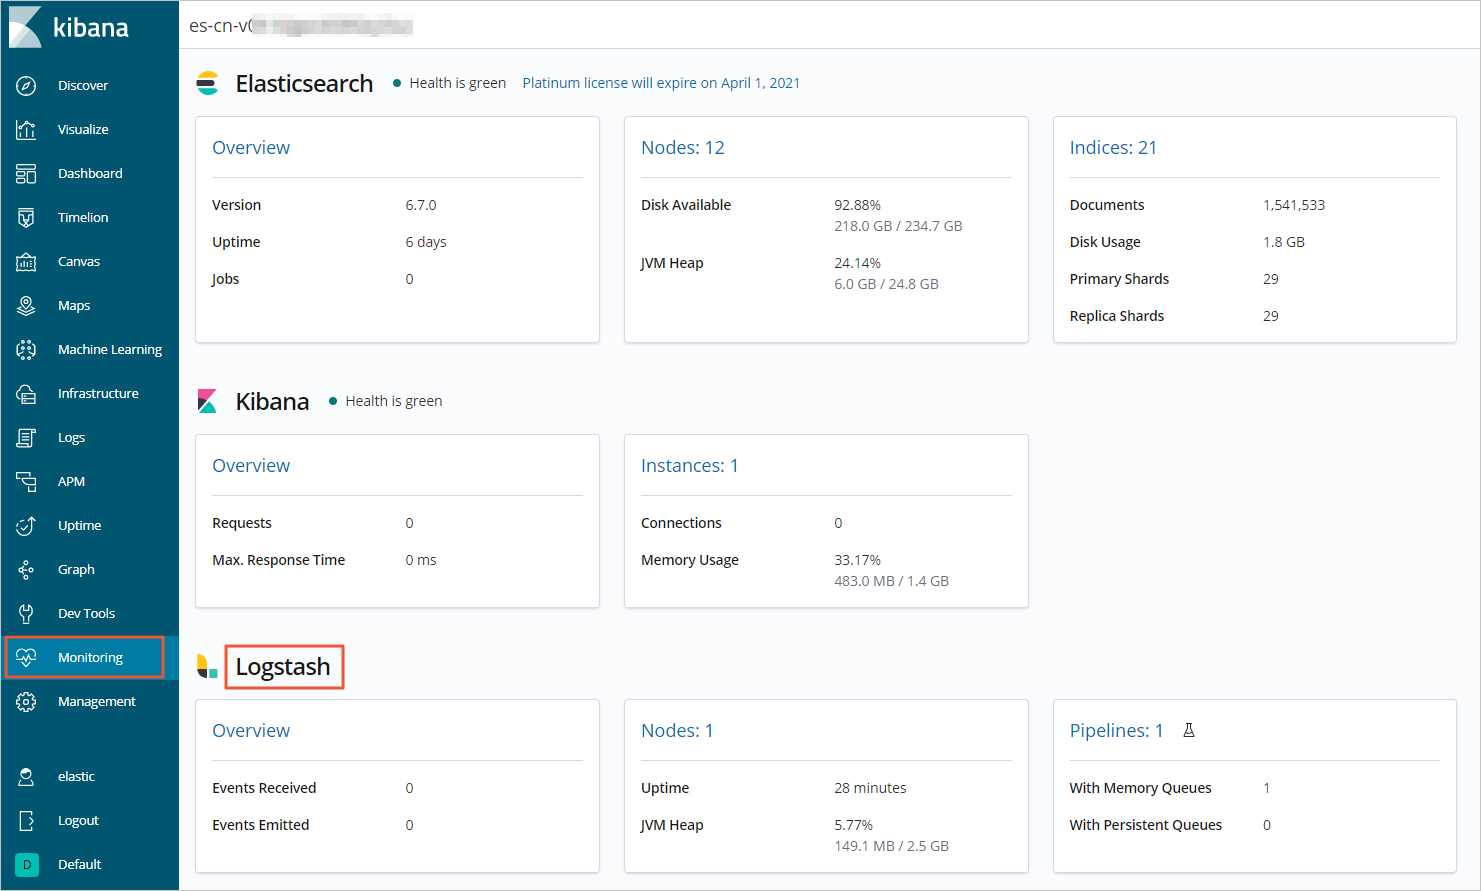
Follow the on-screen prompts to reach the home page. In the left-side navigation pane, click Monitoring.
NoteThis topic uses the Kibana console for Elasticsearch 6.7 as an example. The steps and UI may differ for other versions.
In the Logstash section, view the Logstash monitoring data.