Kibana is built into the Alibaba Cloud Elasticsearch (ES) console for exploring, analyzing, and visualizing your cluster data. Alibaba Cloud ES includes all X-Pack features for free, with role-based access control (RBAC) for fine-grained permissions on clusters, indices, and fields.
Usage notes
ES clusters use two control architectures: basic control (v2) and cloud-native control (v3). Connection methods vary by architecture, so follow the instructions for your cluster type. The v3 architecture offers significant improvements in features, stability, and security. We recommend upgrading v1 or v2 instances to v3 as soon as possible. For more information, see Upgrade the instance architecture.
Identify the ES cluster architecture version
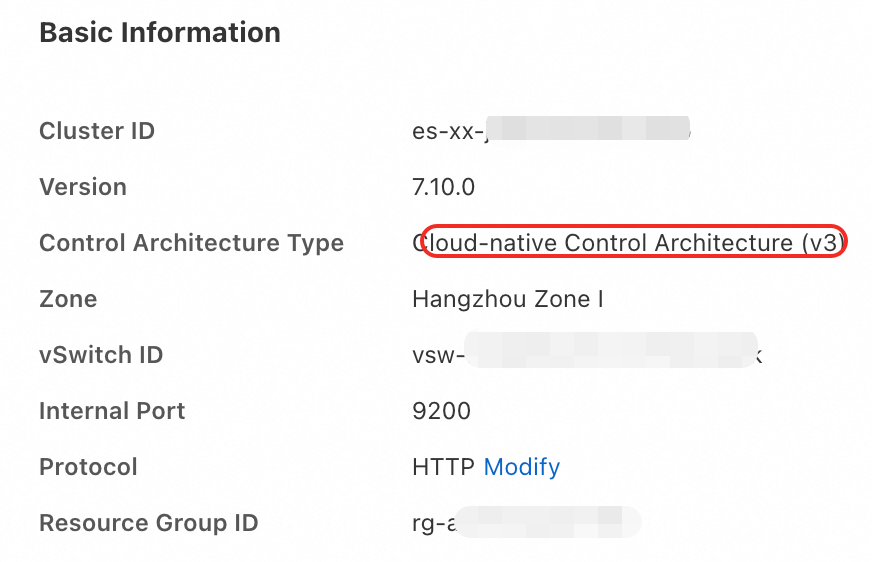
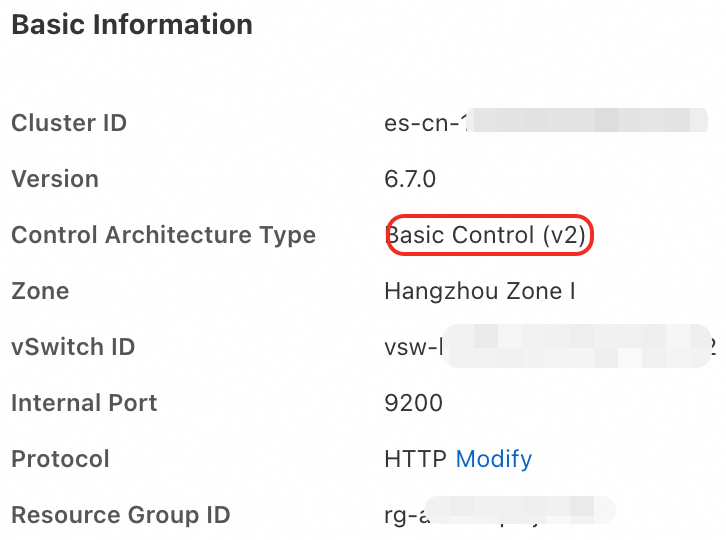
Log in to the Alibaba Cloud Elasticsearch console and navigate to the Basic Information page for your instance. The Control Architecture Type field will show either Cloud-native Control Architecture (v3) or Basic Control Architecture (v2).
Kibana endpoints
Endpoints and port numbers
|
Architecture version |
Access method |
Default status |
Port |
Configuration method |
|
v2 |
Public network |
Enabled by default, but the default whitelist is |
5601 |
Configure the public access whitelist to add the IP address of your device. |
|
Private network |
Disabled by default. |
5601 |
Enable private network access in the console and configure a private whitelist. |
|
|
v3 |
Public network |
Enabled by default, but the default whitelist is |
443 |
Configure the public access whitelist to add the IP address of your device. |
|
Private network |
Disabled by default. |
5601 |
Enable private network access in the console and create a PrivateLink endpoint. |
Private network access requires Kibana nodes with at least 2-core CPUs and 4 GB of memory.
Endpoint format
|
Access method |
Endpoint format |
|
Public network |
|
|
Private network |
|
Parameter descriptions:
-
{region-abbreviation}: Replace with the actual region abbreviation (for example,cnfor sites in the Chinese mainland). -
{full-region-id}: Replace with the full region ID (for example,cn-hangzhoufor China (Hangzhou)). -
{instance-id}: Replace with your ES instance ID. -
Key difference: Private endpoints contain the
.internal.identifier, while public endpoints do not. -
{port}: Use the port number corresponding to the architecture version.
Kibana account and authentication method
|
Architecture version |
Authentication method |
Default username |
Password source |
|
v2 |
ES instance access password (single-factor authentication) |
|
Password set during instance creation |
|
v3 |
Alibaba Cloud account + ES instance access password (two-factor authentication) |
|
Password set during instance creation |
-
Default user: The
elasticuser is the super administrator for the ES cluster and has the highest level of permissions. -
To reset the password, go to the Basic Information page for your instance in the ES console and click Reset Password.
-
Security recommendation: For production environments, we recommend that you do not use the default
elasticaccount. Instead, use the Elasticsearch X-Pack RBAC mechanism to create custom roles and users for fine-grained permission management. For more information, see Manage user permissions with Elasticsearch X-Pack roles.
Log in to Kibana via public network (v2/v3)
-
Log on to the Alibaba Cloud Elasticsearch console, and navigate to the Basic Information page of the target instance.
-
In the navigation pane on the left, click . In the Kibana section, click Modify Configuration.

-
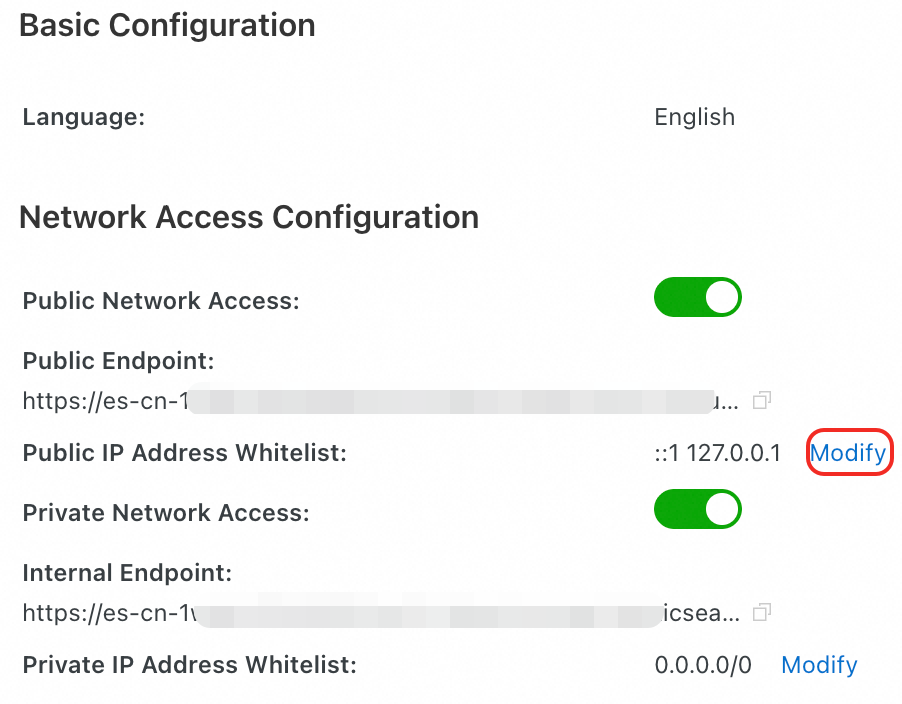
In the Network Access Configuration section, configure the Public IP Address Whitelist and Authentication Method for Public Network Access.

-
Configure the Public IP Address Whitelist: By default, the public access whitelist is set to
127.0.0.1, which denies access from all IPv4 addresses. To access Kibana, you must add your device's public IP address to the whitelist.-
Obtain the required IP address based on your scenario.
Scenario
Required IP address
Method
Access Kibana from an on-premises device over the public network.
The public IP address of the on-premises device.
NoteIf your on-premises device is on a home network or a corporate LAN, add the public egress IP address of the LAN.
You can run the
curl ipinfo.io/ipcommand to query the public IP address of your local device.Access Kibana from an ECS instance over the public network.
If the ECS instance and the ES cluster are in different VPCs, you can access Kibana by using the public IP address of the ECS instance. In this case, you must add the public IP address of the ECS instance to the Kibana public whitelist.
Log on to the ECS console and view the public IP address of the instance in the instance list.
-
In the Public IP Address Whitelist section, click Edit.
-
Click Configure next to the default group and add the IP whitelist in the dialog box that appears.
You can also click Add a new IP whitelist group to create a group with a custom name. Groups are for IP address management only and do not affect access permissions.

Configuration type
Format and example values
Important notes
IPv4 address format
-
Single IP:
192.168.0.1 -
CIDR block:
192.168.0.0/24. We recommend that you consolidate individual IP addresses into a CIDR block.
A single cluster can have up to 300 IP addresses or CIDR blocks. Separate multiple entries with a comma (,) and do not add spaces before or after the comma.
0.0.0.0/0: Allows all IPv4 access.Important-
We strongly recommend that you do not configure
0.0.0.0/0. This configuration poses a high-security risk. -
Some clusters and regions do not support
0.0.0.0/0. The information displayed on the UI or in error messages prevails.
IPv6 address format
(Supported only for v2 architecture clusters in the China (Hangzhou) region)
-
Single IP:
2401:XXXX:1000:24::5 -
CIDR block:
2401:XXXX:1000::/48
A single cluster can have up to 300 IP addresses or CIDR blocks. Separate multiple entries with a comma (,) and do not add spaces before or after the comma.
-
::1: Blocks access from all IPv6 addresses. -
::/0: Allows all IPv6 accessImportant-
We strongly recommend that you do not configure
::/0because it poses a high risk. -
Some cluster versions do not support
::/0. Refer to the console UI or error messages for confirmation.
-
-
-
After completing the configuration, click OK.
-
-
Configure the Authentication Method for Public Network Access:
For v3 architecture clusters, the default method is two-factor authentication: you must first log in with your Alibaba Cloud account and then authenticate with your ES instance password.

For v2 architecture clusters, authentication uses the ES instance access password by default. This setting cannot be changed.
-
-
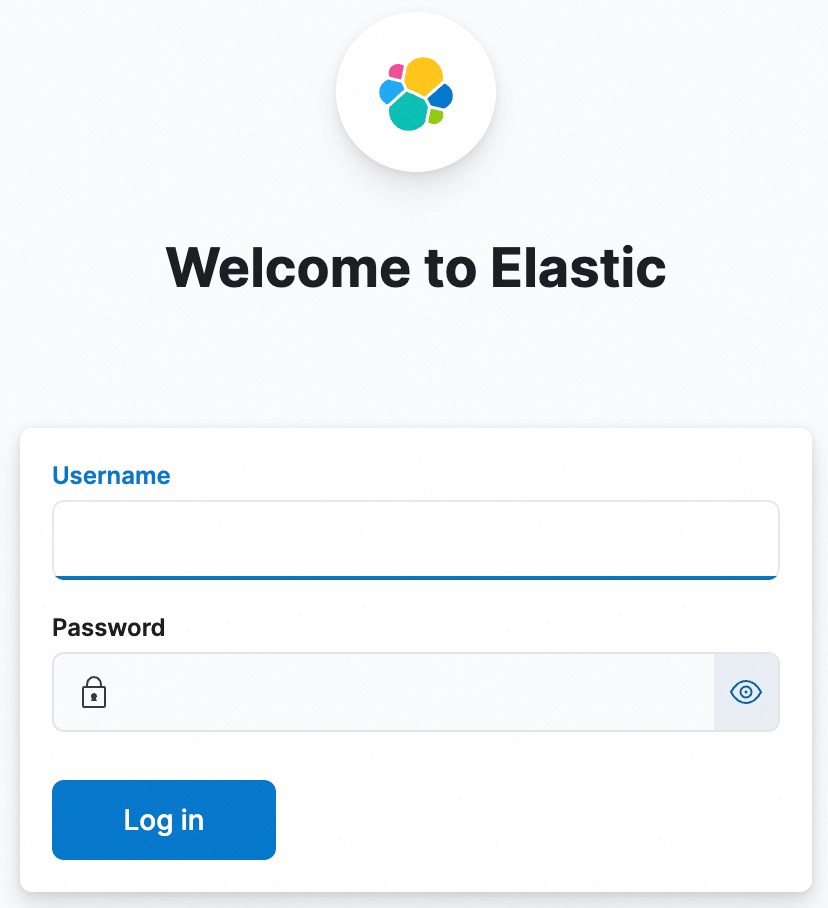
Return to the Kibana section and click Access over Internet. On the Kibana login page, enter your username and password. A successful login takes you to the Kibana console, where you can start exploring your ES data.

Alternatively, enter the endpoint directly in your browser. Ensure your device's IP address is in the Kibana public whitelist.
-
v2:
https://es-{region-abbreviation}-{instance-id}-kibana.elasticsearch.aliyuncs.com:{port} -
v3:
https://es-{region-abbreviation}-{instance-id}-kibana.{full-region-id}.elasticsearch.aliyuncs.com:{port}
-
Log in to Kibana via private network (v3)
In the v3 architecture, private network access to Kibana is disabled by default. To enable it, use Alibaba Cloud PrivateLink to create an endpoint within your VPC. The endpoint is included in the ES service at no extra charge.
Configure the Kibana private endpoint
-
On the Network Access Configuration page, turn on the Private Network Access switch.

-
Configure the endpoint information as prompted on the page.

Parameter
Description
Endpoint Name
The endpoint name is automatically generated but can be modified.
VPC
The VPC must be the same as your ES instance. You can find the instance's VPC on the Basic Information page.
Zone
You can find the instance's Zone on its Basic Information page.
vSwitch
The vSwitch must be the same one that your ES instance belongs to. You can find the instance's vSwitch ID on its Basic Information page.
Security Group
Security group rules control network access to Kibana over the private network. Select an existing security group or create a new one. To configure rules, go to the ECS console to modify security group rules.
-
The destination port range must include the Kibana private port 5601.
-
The access source must include the IP address of the device used for access.
-
When you modify the security group for private access to Kibana, you must select a security group of the same type as the one you initially chose:
-
If you initially selected a basic security group, you can only change it to another basic security group.
-
If you initially selected an enterprise security group, you can only change it to another enterprise security group.
-
-
To quickly create a security group:
-
Click Create below the Security Group text box.
-
Enter a name for the security group.
The name is automatically generated but can be modified.
-
Enter the authorized IP address.
This is the private IP address of the authorized device. For example, if you access Kibana from an ECS instance over a private network, you must enter the private IP address of that ECS instance. Log on to the ECS console to view the private IP address in the instance list.
-
Authentication Method for Private Network Access
The default method is two-factor authentication, which requires both an Alibaba Cloud account and the ES instance access password.
After you click OK, wait for the configuration to complete. The Kibana private endpoint is ready when its connection status changes to Connected.

-
After creation, only the endpoint name can be modified. To manage security groups, go to the ECS console.
-
Turning off the Private Network Access switch automatically releases the associated endpoint resources. Re-enabling it requires creating a new endpoint, but the Kibana access endpoint address remains unchanged.
-
Connection examples
-
The following example shows how to use VNC to remotely connect to an ECS instance (running Windows) and then access Kibana by using the private endpoint.

Enter your username and password, and then click Log In. We recommend using the Elasticsearch X-Pack features in Kibana to create roles for fine-grained permission management.
-
The following example shows how to use Workbench to remotely connect to an ECS instance and then run the following command to connect to Kibana by using the private endpoint:
curl.exe -u elastic:password! -k -I "https://es-cn-xxxxxxxxxxxxxxxxx-kibana.internal.elasticsearch.aliyuncs.com:5601/"A successful connection returns the following information:

Log in to Kibana via private network (v2)
In the v2 architecture, private network access requires Kibana nodes with at least 2-core CPUs and 4 GB of memory. Enable it in the console and add your device's IP address to the private whitelist before logging in.
-
In the navigation pane on the left, click Data Visualization. In the Kibana area, click Modify Configuration.
-
In the Network Access Configuration section, enable the Private Network Access switch and configure the access whitelist.
-
To access Kibana from an ECS instance over a private network, both the ECS instance and the ES cluster must be in the same VPC. Log on to the ECS console and view the private IP address of the instance in the instance list.
-
In the Private IP Address Whitelist section, click Edit. You can add the private IP address of the ECS instance to the default group or create a new group by clicking Add a new IP whitelist group.
ImportantWe strongly recommend that you do not configure
0.0.0.0/0because it poses a high security risk, and some clusters and regions do not support0.0.0.0/0. Please refer to the UI or error messages for confirmation.
-
-
The following example shows how to use Workbench to remotely connect to an ECS instance and run a command to connect to Kibana by using its private endpoint:
curl.exe -u elastic:password! -k -I "https://es-xx-xxxxxxxxxxxxxxxxx-kibana.internal.elasticsearch.aliyuncs.com:5601/"A successful connection returns the following information:

Access Kibana via Nginx proxy (v3 example)
Configure an Nginx proxy
Before accessing Kibana through an Nginx proxy, configure or obtain the following information:
-
Kibana endpoint:
-
Private endpoint and authentication method: To configure a private endpoint, see Log in to Kibana over a private network (v3 deployment architecture). When accessing Kibana through an Nginx proxy, the only supported authentication method is the ES instance access password.
-
Public endpoint, whitelist, and authentication method: For information about obtaining the endpoint and configuring the whitelist, see Log in to Kibana over the public network (v2/v3 deployment architectures). Only the ES instance access password can be used as the authentication method.
-
-
Security group configuration: If you access Kibana from a local browser through an Nginx proxy (for example, on an ECS server), you need to add the IP address of your on-premises device and port 80 to the security group of the ECS instance.
-
Modify the Nginx configuration. The key parameters are described as follows:
-
server_name: The domain name of the server. You can replace it with the actual domain name of your server.
-
proxy_pass: Proxies requests to the backend Kibana service. You must replace the value with the Kibana private or public connection information (endpoint and port number).
server
 {
    listen 80;
     # Replace server_name with the actual domain name of your server.
    server_name _ ;
    # Security settings
    add_header Strict-Transport-Security "max-age=31536000; includeSubDomains" always; add_header X-Frame-Options DENY; add_header X-Content-Type-Options nosniff;

    location / {
        # Proxy requests to the backend Kibana service.
        proxy_pass https://es-xx-xxxxxxxxxxxxxxxxx-kibana.internal.elasticsearch.aliyuncs.com:5601;

        # Certificate verification (use a valid certificate in a production environment).
        proxy_ssl_verify off; proxy_ssl_server_name on;

        # Header settings
        # You can remove the Host configuration or set it to the backend Kibana service.
        proxy_set_header Host es-xx-xxxxxxxxxxxxxxxxx-kibana.internal.elasticsearch.aliyuncs.com; proxy_set_header X-Real-IP $remote_addr; proxy_set_header X-Forwarded-For $proxy_add_x_forwarded_for; proxy_set_header
        X-Forwarded-Proto $scheme;

        # WebSocket support
        proxy_http_version 1.1; proxy_set_header Upgrade $http_upgrade; proxy_set_header Connection "upgrade"; proxy_cache_bypass $http_upgrade;

        # Timeout settings
        proxy_connect_timeout 60s; proxy_send_timeout 60s; proxy_read_timeout 60s;
    }
}
-
Modify the Kibana basePath
If you access Kibana through a subpath under your own domain name, you also need to modify the basePath and related settings in kibana.yml.
On the instance details page in the ES console, click Configuration and Management > Data Visualization in the left-side navigation pane. On the Kibana Configuration page, in the Basic Configuration section, find Other Configuration and modify the kibana.yml file.
-
Version 7.10 and earlier
Configure the following parameters:
server.basePath: "/subpath" server.rewriteBasePath: trueNoteAfter you set
server.rewriteBasePathto true, Nginx does not require additional rewrite configuration. -
Versions later than 7.10
Configure the following parameters:
server.basePath: "/subpath" server.rewriteBasePath: true server.publicBaseUrl: "https://es-xx-xxxxxxxxxxxxxxxxx-kibana.internal.elasticsearch.aliyuncs.com:5601/subpath"NoteBy default, the
server.publicBaseUrlfor Kibana on Alibaba Cloud is set tohttp://0.0.0.0:5601. If you configure a basePath, you need to modify this setting to include the basePath value. After you setserver.rewriteBasePathto true, Nginx does not require additional rewrite configurations.
Configure Kibana
Modify basic Kibana settings such as the display language and encryption keys from the Kibana configuration page. Configuring encryption keys enables enterprise features such as Alerts and the AI Assistant.
This feature is available only for instances with the cloud-native control (v3) architecture and ES versions 6.7.0 and later. If your instance uses the basic control (v2) architecture, we recommend upgrading to v3 to use this feature.
-
Log on to the Alibaba Cloud Elasticsearch console and navigate to the Basic Information page of the target instance.
-
In the navigation pane on the left, click Data Visualization. In the Kibana section, click Modify Configuration.
-
In the Basic Configuration section, click Modify Configuration.
-
In the Modify Basic Configuration panel, modify the following settings as needed:
Language: Changes the Kibana display language. Kibana supports Chinese and English (default).
xpack.security.encryptionKey: Encrypts Kibana session information. Must be a string of at least 32 characters.
xpack.encryptedSavedObjects.encryptionKey: Encrypts saved objects and enables features like Alerts and Actions. Must be a string of at least 32 characters.
xpack.reporting.encryptionKey: Encrypts sensitive data in Kibana reports. Must be a string of at least 32 characters.
Other Configuration: Add other Kibana settings in YAML format.NoteIf you have not configured these keys, click One-Click Generate to create them automatically.
-
Click OK.
FAQ
-
Q: How do I distinguish between V2 and V3 deployment architectures?
A: Clusters have two control deployment modes: cloud-native control (v3) and basic control (v2).

-
Q: Does enabling public or private access to Kibana affect the ES cluster?
A: No, it does not. Enabling public or private access to Kibana affects only the Server Load Balancer (SLB) that connects to Kibana.
NoteEnabling private access to Kibana for the first time triggers a restart of the Kibana node, but it does not trigger changes to the ES cluster.
-
Q: I added an IP address to the whitelist, but I still cannot access Kibana. What should I do?
A: Check the following items to troubleshoot the issue:
-
The ES instance must be in a healthy state.
-
The IP address configuration might be incorrect: If you access the Kibana service from an on-premises device, visit www.cip.cc in your browser to verify that the obtained IP address is in the Kibana public access whitelist.
-
If you have configured an access whitelist for the ES instance, you must also configure a public or internal-facing access whitelist to log on to Kibana. You can modify the Kibana whitelist configuration in the section of the ES instance.
-
Clear the browser cache and retry.
-
Restart the Kibana node and retry.
-
-
Q: Why can't I modify security group rules in the ES console?
A: Adjusting security group rules affects all scenarios that use them for access control. Therefore, you cannot modify security group rules in the ES console. To modify security group rules, go to the ECS Security Group console.
-
Can I access services on the internet (such as Baidu Maps or AMAP) from the Kibana console?
-
What do I do if I cannot access Kibana through an Nginx proxy?
-
What do I do if I cannot access Kibana using a custom domain name with a CNAME record?
References
-
API documentation:
-
To enable or disable public or private access to Kibana, see the TriggerNetwork API operation.
-
To update the public or private access whitelist for Kibana, see the ModifyWhiteIps API operation.
-
-
If you encounter problems when you log on to or use Kibana, see Kibana FAQ.