The PC canvas editor provides tools for canvas configuration and component management, helping you build data dashboards efficiently.
Enter the canvas editor
Access the DataV console.
-
In the All Applications interface, hover over the desired dashboard and click Edit to access the dashboard canvas editor.
Before you manage the canvas and configure components, learn about the interface layout and feature overview of the canvas editor.
Interface layout and feature overview
The following figure and table describe the interface layout and features of the DataV-Board 7.0 PC canvas editor.

|
Ordinal number |
Name |
Description |
|
1 |
Toolbar |
The toolbar at the top of the editor provides canvas and blueprint switching, beautification, filtering, global searching for layers, instructions, components, and design libraries, canvas refreshing, right-side panel visibility control, theme switching, error viewing, snapshot generation, and dashboard previewing and publishing. |
|
2 |
Left tab list |
The left tab list provides access to layers, component library, design library, global variables, filters, history, and data management. |
|
3 |
Canvas settings |
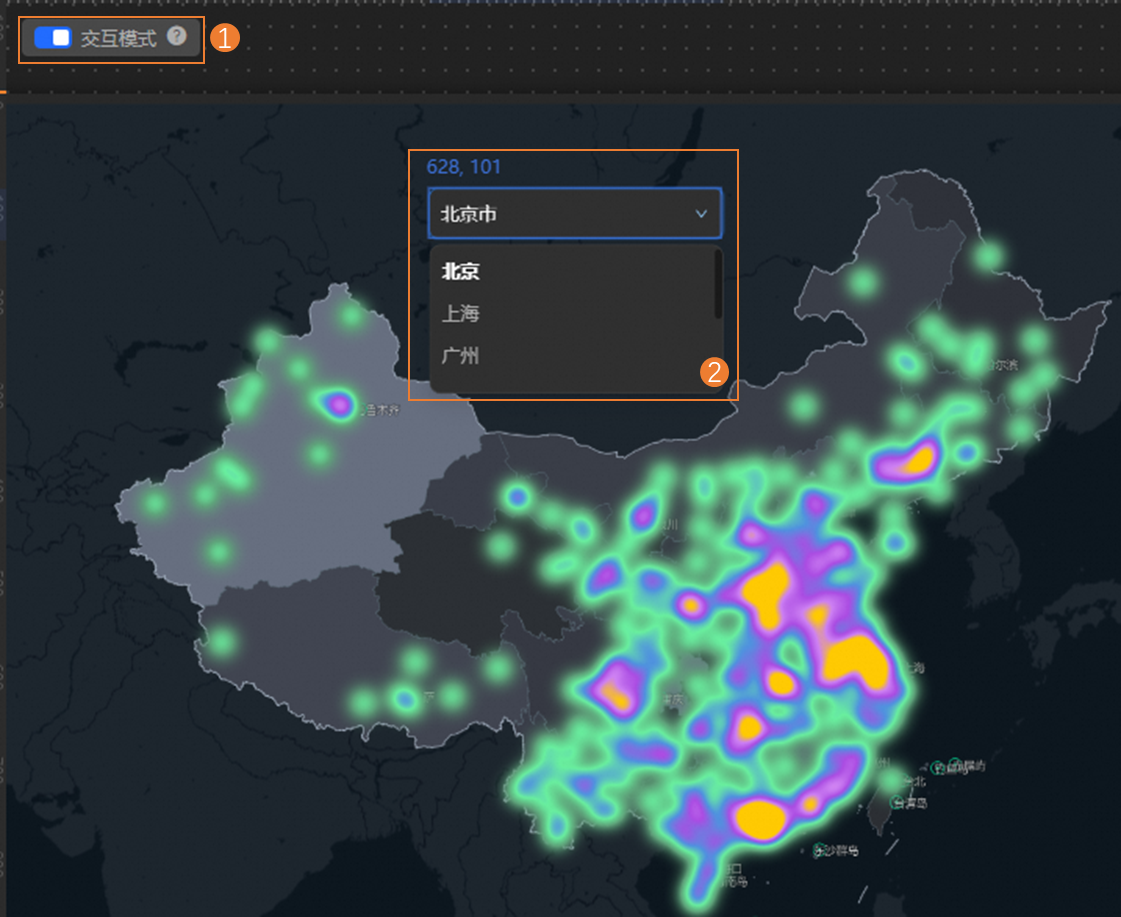
The canvas settings area in the center of the editor provides dashboard layout control and interaction mode:
|
|
4 |
Page configuration |
The Page configuration panel appears on the right when no component is selected on the canvas. You can modify screen size, set background transparency and color, choose screen scaling methods, and create thumbnails. |
|
5 |
Help page |
Click the |
|
6 |
Component settings |
Select a component on the canvas to configure its Style, Data Source, and Advanced settings in the panel on the right. For more information, see the configuration item description. |
 icon in the lower-left corner of the canvas to open the help panel, which provides a beginner's guide, quick links, and an editor feature overview.