Overview of core features
Learn about the feature architecture and core capabilities of DataV-Board 7.0.
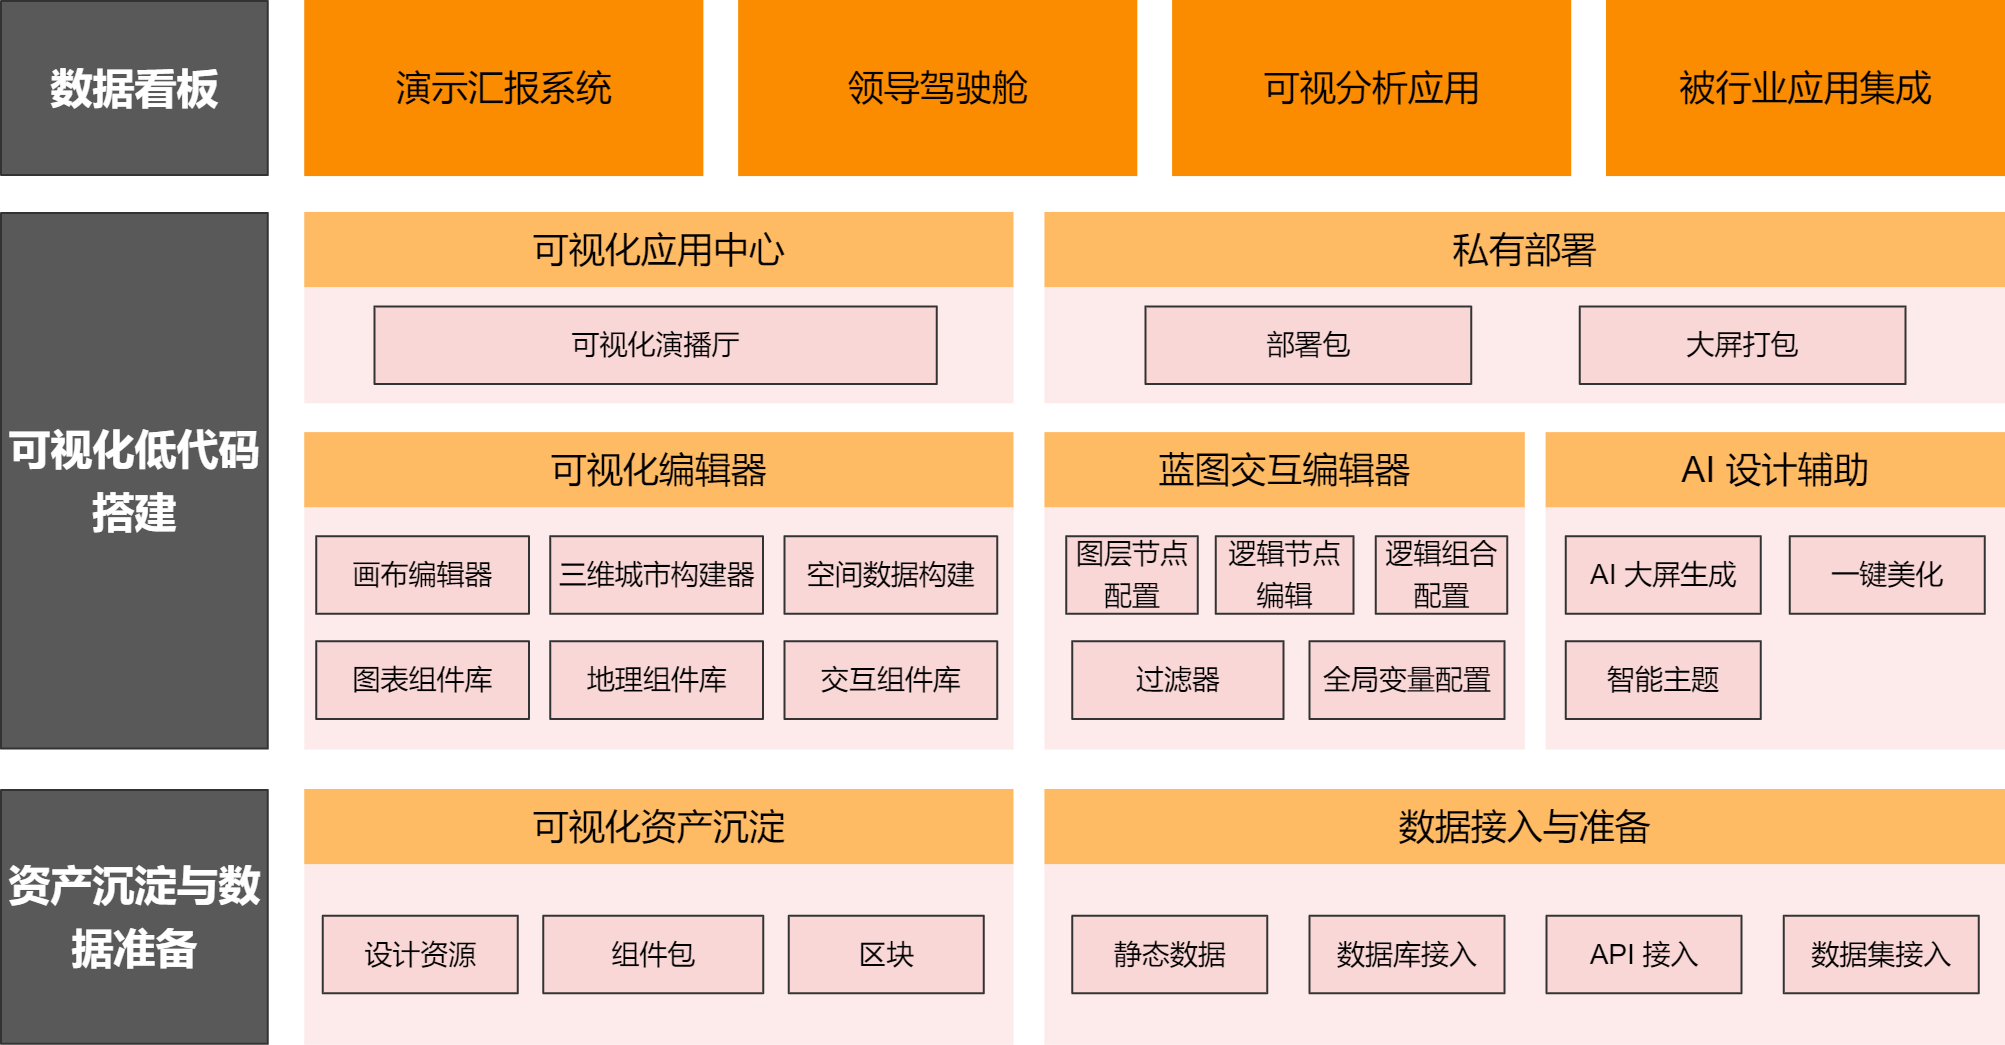
Product feature architecture
The following figure shows the DataV-Board 7.0 feature architecture.
-
Underlying Input: Asset Accumulation and Data Preparation
A data dashboard consists of multiple components that connect to data sources and render visualizations. Start by integrating the required components and data:
-
Components: Use built-in, custom design, and custom components to build visualizations.
-
Data sources: Support static data, databases, and other data types.
-
-
Building Process: Low-Code Visualization Building
Use the visual low-code editor to add components, configure styles, connect data, and define interactions. Core modules:
Category
Overview
Feature
Description
Visual Editor
Core editing area for dashboards.
Canvas Editor
Add and manage components, access data sources, configure styles, and publish and share dashboards.
Supports both PC and mobile dashboards, with device-specific editing.
Component Library
Includes the following component types:
-
Chart Component Library: Displays complex data in intuitive graphical formats.
-
Geographic Component Library: Processes and visualizes geographic data.
-
Interactive Component Library: Adds interactive UI elements for data input, view control, and user operations.
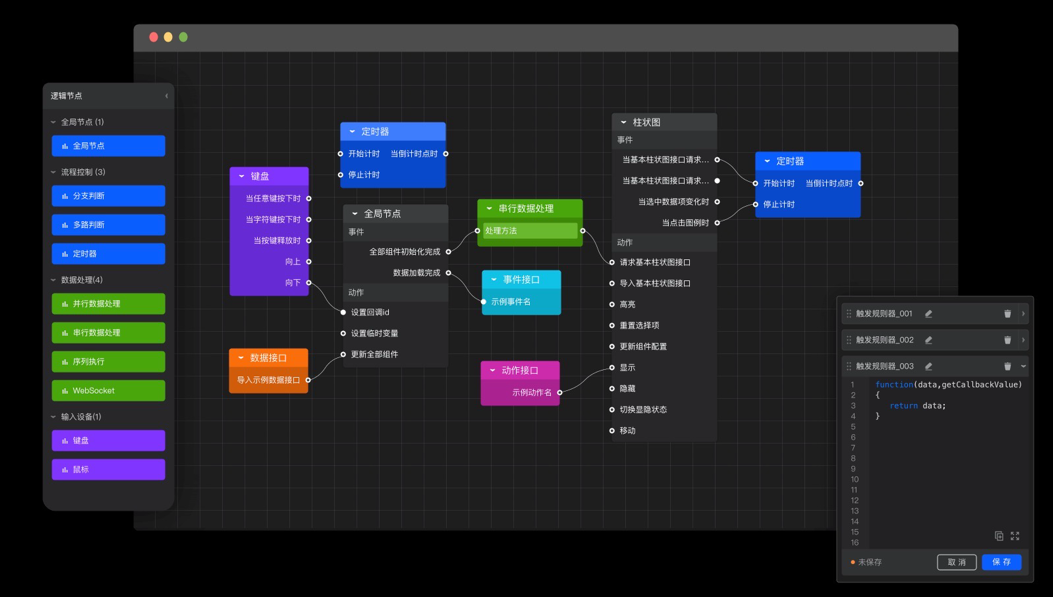
Blueprint Interaction Editor
Core configuration area for component interactions.
Primary interaction entities. Components added in the canvas editor generate corresponding layer nodes.
Define interaction logic between components and variables across the dashboard.
Encapsulate and reuse nodes and connections to simplify repetitive data processing and complex interactions.
NoteThe Logic Combination Nodes and Logic Combinations on the main canvas are linked. Changes to a logic combination's name or content affect all related logic nodes.
Write custom filter code to transform, screen, display, and calculate data.
Available to components and nodes in both editors.
Define global parameters to pass values between components and enable interactions.
Available in both editors.
AI Design Assistance
Uses AI to assist with dashboard creation and style enhancement.
Refine dashboard layout and apply built-in styles for quick overall styling.
Switch the dashboard color scheme to enhance visual appeal.
-
-
Output Result: Data Dashboard
Build dashboards for various industries, such as reporting systems and executive cockpits.
Core capabilities
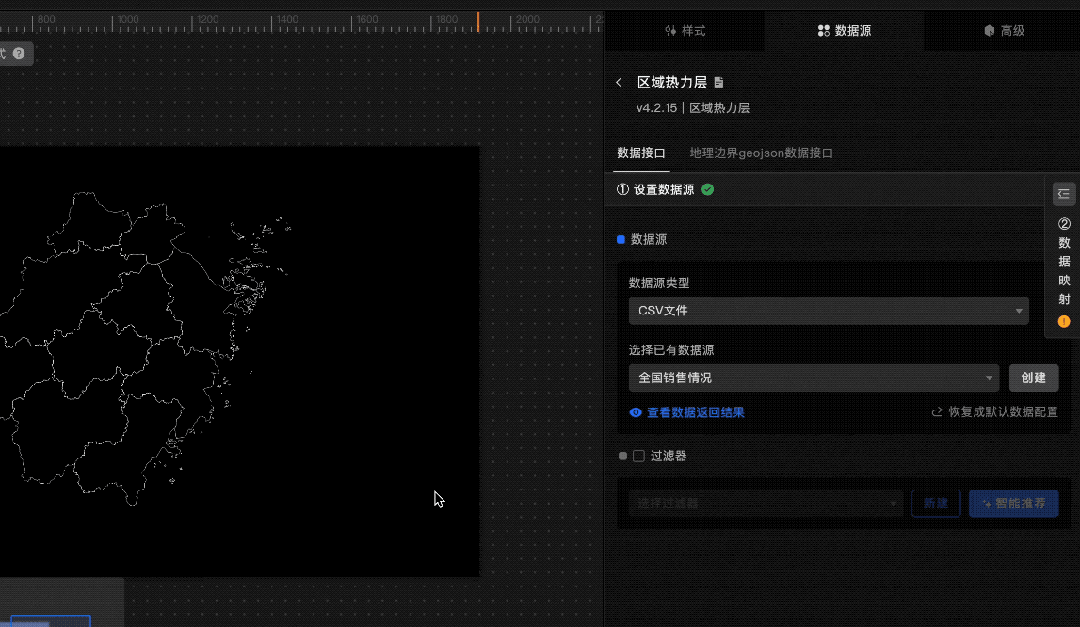
Data access and preparation
-
Supports Alibaba Cloud and open-source data sources.
-
Provides dataset management and lightweight data processing for quick visualization preparation.
-
Supports component-level data processing and intelligent code generation for business data integration.
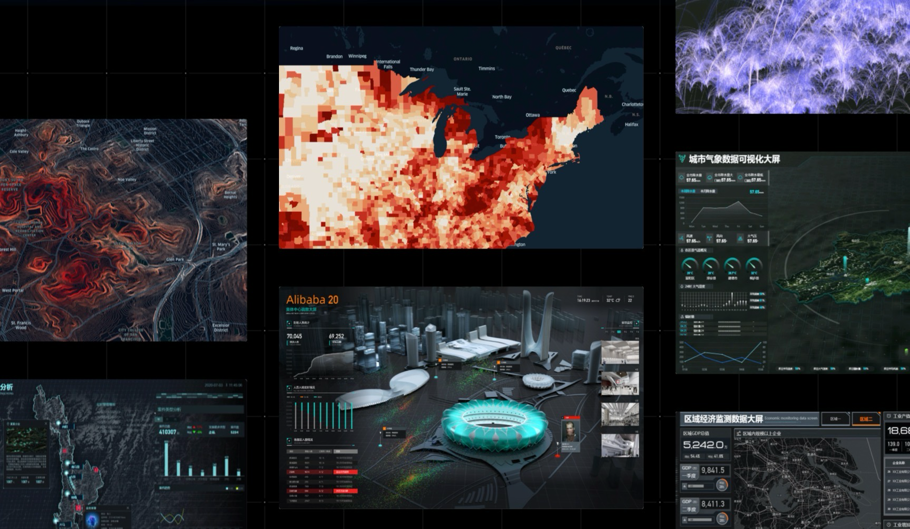
Visualization rendering
-
Offers 400+ visualization components and 100+ geographic primitives for precise, visually rich data representation.
-
Uses a proprietary 2D/3D rendering engine for real-time spatio-temporal data rendering.
Low-code building
-
Provides a low-code blueprint editor that helps novice developers build interactions quickly.
-
Combines rich components and blueprints to build complex interactive visualizations.
-
Visual representation of interaction logic simplifies comprehension, handovers, and maintenance.
AI design assistance
-
Analyzes uploaded images, extracts color themes, and applies them to the dashboard.
-
One-click beautification helps developers quickly optimize design elements.