When microservices communicate across a mesh, identifying failing requests, latency bottlenecks, and misconfigured routing rules requires visibility into real-time traffic. Mesh Topology provides this visibility by combining live request data with ASM configuration into an interactive service graph, so you can monitor service health, trace traffic flow, and pinpoint issues without switching between consoles.
What Mesh Topology shows
| Capability | Details |
|---|---|
| Traffic topology | Interactive graph of real-time request traffic between services. Nodes represent services; edges represent requests. Supports HTTP, gRPC, and TCP traffic types. |
| Configuration overlay | Active ASM configurations displayed directly on topology nodes: peer authentication policies, virtual services, destination rules, throttling rules, and circuit breakers. |
| Health indicators | Color-coded nodes and edges that signal service and request health at a glance, helping you quickly identify abnormal nodes or requests. |
| Traffic replay | Replay traffic from a past time period to trace application traffic conditions during a specific window. |
Prerequisites
Before you begin, make sure that you have:
An ASM instance (to create one, see Create an ASM instance)
A Container Service for Kubernetes (ACK) cluster added to the ASM instance (see Add a cluster to an ASM instance)
A Prometheus instance integrated with ASM for metrics collection -- either Managed Service for Prometheus or a self-managed Prometheus instance (see Integrate Managed Service for Prometheus or Use a self-managed Prometheus instance)
For Managed Service for Prometheus pricing, see Billing overview.
Enable Mesh Topology
The enablement steps depend on whether you are creating a new ASM instance or configuring an existing one.
Enable Mesh Topology on a new ASM instance
Log on to the ASM console. In the left-side navigation pane, choose Service Mesh > Mesh Management.
On the Mesh Management page, click Create ASM Instance.
In the Observability section, select Enable Managed Service for Prometheus, and then configure based on your Prometheus instance type:
NoteSelecting Enable Managed Service for Prometheus only collects metrics for the ASM instance. No Application Real-Time Monitoring Service (ARMS) instances or self-managed Prometheus instances are automatically created.
Clearing both Enable Managed Service for Prometheus and Enable ASM Mesh Topology disables Mesh Topology.
Prometheus instance type Steps Managed Service for Prometheus instance Select Use Managed Service for Prometheus to Collect Metrics, and then select Enable ASM Mesh Topology. Self-managed Prometheus instance Select Integrate the self-built Prometheus to achieve metrics monitoring and Enable ASM Mesh Topology, and then enter the HTTP API address of the self-managed Prometheus instance. Configure the remaining parameters, read and agree to Service Agreement, and then click Create Service Mesh. For parameter descriptions, see Create an ASM instance.
Add an ACK cluster to the ASM instance. See Add a cluster to an ASM instance.
Enable Mesh Topology on an existing ASM instance
Make sure an ACK cluster is already added to the ASM instance. The steps differ by ASM version.
ASM versions earlier than 1.12.4.50
Log on to the ASM console. In the left-side navigation pane, choose Service Mesh > Mesh Management.
On the Mesh Management page, click the name of the ASM instance. In the left-side navigation pane, choose ASM Instance > Base Information. In the upper-right area, click Settings.
In the Settings Update panel, select Enable Managed Service for Prometheus, and then configure based on your Prometheus instance type:
Prometheus instance type Steps Managed Service for Prometheus instance Select Use Managed Service for Prometheus to Collect Metrics, and then select Enable ASM Mesh Topology. Self-managed Prometheus instance Select Integrate the self-built Prometheus to achieve metrics monitoring and Enable ASM Mesh Topology, and then enter the HTTP API address of the self-managed Prometheus instance. Click OK at the bottom of the Settings Update panel.
ASM versions 1.12.4.50 or later
Mesh Topology requires Prometheus integration for metrics. If your ASM instance is not yet integrated with a Prometheus instance, complete the integration first. See Integrate Managed Service for Prometheus or Use a self-managed Prometheus instance.
Log on to the ASM console. In the left-side navigation pane, choose Service Mesh > Mesh Management.
On the Mesh Management page, click the name of the ASM instance. In the left-side navigation pane, choose Observability Management Center > Mesh Topology.
In the Enable ASM Mesh Topology section, follow the steps for your ASM version: For more information about the differences between deployment modes, see Enable Mesh Topology in managed mode.
ASM version Steps Earlier than 1.18.2.112 Click To enable. 1.18.2.112 or later -- in-Kubernetes-cluster mode Click In-Kubernetes-cluster Mode, enter the HTTP API URL of the Prometheus instance, and then click To enable. 1.18.2.112 or later -- managed mode Click Managed Mode, and then click To enable. In the dialog box, configure the required parameters and click OK.
Access Mesh Topology
After enabling Mesh Topology, configure access to its UI. Three methods are available depending on your ASM version and network requirements.
Access through a CLB instance (recommended)
Minimum ASM version: 1.12.4.50
Create a Classic Load Balancer (CLB) instance to expose the Mesh Topology UI. This is the simplest access method.
Log on to the ASM console. In the left-side navigation pane, choose Service Mesh > Mesh Management.
On the Mesh Management page, click the name of the ASM instance. In the left-side navigation pane, choose Observability Management Center > Mesh Topology.
In the Access section, enable CLB access based on your ASM version:
ASM version Steps Earlier than 1.15.3.120 Select Automatically Create an Internet-facing CLB Instance to Access ASM Mesh Topology. 1.15.3.120 to earlier than 1.17.2.19 Turn on Automatically Create an Internet-facing CLB Instance to Access ASM Mesh Topology. In the dialog box, click OK. 1.17.2.19 or later Turn on Create a CLB Instance to Access ASM Mesh Topology. In the dialog box, configure the required parameters and click OK. Wait for the ASM instance to finish updating. To check the status:
In the left-side navigation pane, choose ASM Instance > Base Information.
In the Basic Information section, check the Status field. Updating means the update is in progress. Running means the update is complete.
In the Access section of the Mesh Topology page, click Click here to access ASM Mesh Topology or Copy token and open in new window to open Mesh Topology.
Access through an ASM ingress gateway
Route traffic to Mesh Topology through an ASM ingress gateway for more control over network access and routing.
Create an ingress gateway and add a port for Mesh Topology. See Create an ingress gateway or Create and manage an ingress gateway by using the Kubernetes API. Port configuration example:
   - name: http-kiali
     port: 20001
     protocol: TCP
     targetPort: 20001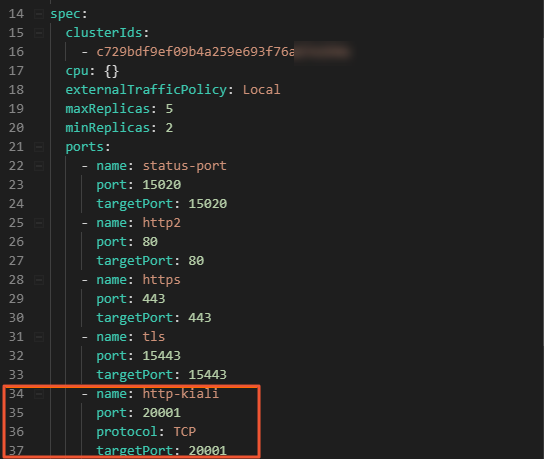
Create an Istio gateway with the following YAML. See Manage Istio gateways.
   apiVersion: networking.istio.io/v1alpha3
   kind: Gateway
   metadata:
     name: kiali-gateway
     namespace: istio-system
   spec:
     selector:
       istio: ingressgateway
     servers:
       - hosts:
           - '*'
         port:
           name: http
           number: 20001
           protocol: HTTP
Create a virtual service with the following YAML. See Manage virtual services.
   apiVersion: networking.istio.io/v1alpha3
   kind: VirtualService
   metadata:
     name: kiali-vs
     namespace: istio-system
   spec:
     gateways:
       - kiali-gateway
     hosts:
       - '*'
     http:
       - route:
           - destination:
               host: kiali
               port:
                 number: 20001
Open the Mesh Topology UI:
Log on to the ASM console. In the left-side navigation pane, choose Service Mesh > Mesh Management.
On the Mesh Management page, click the name of the ASM instance. In the left-side navigation pane, choose ASM Instance > Base Information.
In the Config Info section, click Access from Ingress Gateway next to Enable ASM Mesh Topology.
Access through a custom proxy service
Minimum ASM version: 1.16.4.5
When Mesh Topology is enabled, it creates a Kiali service in the istio-system namespace. You can create a proxy for this service -- for example, an NGINX reverse proxy -- and configure custom access parameters.
Log on to the ASM console. In the left-side navigation pane, choose Service Mesh > Mesh Management.
On the Mesh Management page, click the name of the ASM instance. In the left-side navigation pane, choose Observability Management Center > Mesh Topology.
In the Authentication section, click Show Advanced Settings. In the Customize Access Modes section, configure the parameters and click Save configuration of Mesh Topology.
Parameter Description Customize a Domain Name Custom domain name for Mesh Topology. Configure this if you use a custom domain. During OpenID Connect (OIDC)-based logon, Mesh Topology replaces the domain in the redirect URI with this value. Customize a Port Port on which Mesh Topology listens. Default: 20001.Customize a Service Root Path Root path for Mesh Topology. Default: /. Append this path to the original URL to access Mesh Topology.Select a Protocol (HTTPS/HTTP) Protocol for accessing Mesh Topology. During OIDC-based logon, Mesh Topology replaces the protocol in the redirect URI with this value.
To update your ASM instance, see Update an ASM instance.
Log on to Mesh Topology
Three authentication methods are available. Choose one based on your ASM version and security requirements.
Log on with a token
ASM versions earlier than 1.12.4.50
Get the token from the ACK console:
Log on to the ACK console and click Clusters in the left-side navigation pane.
On the Clusters page, click the cluster name. In the left-side navigation pane, choose Configurations > Secrets.
On the Secrets page, select istio-system from the Namespace drop-down list. Click kiali-service-account-token-****** in the Name column. On the details page, click the copy icon in the token row to copy the token.
On the Mesh Topology logon page, paste the token and click Login.
ASM versions 1.12.4.50 or later
Get the token from the ASM console:
Log on to the ASM console. In the left-side navigation pane, choose Service Mesh > Mesh Management.
On the Mesh Management page, click the name of the ASM instance. In the left-side navigation pane, choose Observability Management Center > Mesh Topology.
In the Access section, click Copy token and open in new window.
On the Mesh Topology logon page, paste the token and click Login.
Log on with OIDC
Minimum ASM version: 1.15.3.120
OpenID Connect (OIDC) enables single sign-on (SSO) through an identity provider (IdP). To update your ASM instance, see Update an ASM instance.
Configure the IdP. See Step 1 and Step 2 in Integrate Alibaba Cloud IDaaS with ASM to implement single sign-on. Set Redirect URIs to the IP address of the CLB instance or ASM gateway that you use to access Mesh Topology:
CLB access:
http://<CLB-IP>:20001(no trailing slashes after the port number)Gateway access:
http://<Gateway-IP>:20001(no trailing slashes after the port number)
ImportantDo not append paths after the port number. Formats like
20001/,20001/xxx, or20001/xxx/yyyare not valid.Log on to Mesh Topology with OIDC:
Log on to the ASM console. In the left-side navigation pane, choose Service Mesh > Mesh Management.
On the Mesh Management page, click the name of the ASM instance. In the left-side navigation pane, choose Observability Management Center > Mesh Topology.
In the Authentication section, select Login with OIDC and configure the parameters. Click Save configuration of Mesh Topology. Then click Click here to access ASM Mesh Topology.
On the Mesh Topology logon page, click Log In With OpenID to redirect to the IdP logon page.
Log on with an Alibaba Cloud account
Minimum ASM version: 1.16.4.5
Use the OIDC protocol to connect to a Resource Access Management (RAM) OAuth application. ASM automatically creates a RAM OAuth application whose name starts with asm-kiali and integrates it with Mesh Topology. To update your ASM instance, see Update an ASM instance.
For background information, see Access Alibaba Cloud APIs from a web application.
Log on to the ASM console. In the left-side navigation pane, choose Service Mesh > Mesh Management.
On the Mesh Management page, click the name of the ASM instance. In the left-side navigation pane, choose Observability Management Center > Mesh Topology.
In the Authentication section, select Logon by Using an Alibaba Cloud Account. In the dialog box, click Add a Redirect URI, enter a callback URL, and click OK. The ASM instance updates briefly. Wait for the update to complete before proceeding.
NoteFor the callback URL format, see Redirect URI in the OIDC logon method.
If you use CLB-based direct access, the callback URL is automatically specified.
On the Mesh Topology logon page, click Log In With OpenID to log on with your Alibaba Cloud account.
FAQ
Why does Mesh Topology fail to load with Managed Service for Prometheus?
If you selected Use ARMS Prometheus to collect monitoring indicators and enabled token-based authentication for the Managed Service for Prometheus instance, Mesh Topology might not be able to access the Prometheus instance. Fix this with one of the following methods:
Disable the Prometheus token: On the Settings page of the ARMS console, disable the token for your Managed Service for Prometheus instance. See HTTP API URLs.
Configure a Prometheus authentication token for Mesh Topology (ASM 1.15.3.120 or later):
Log on to the ASM console. In the left-side navigation pane, choose Service Mesh > Mesh Management.
On the Mesh Management page, click the name of the ASM instance. In the left-side navigation pane, choose Observability Management Center > Mesh Topology.
Under Connection with ARMS Prometheus, enter the authentication token and click Save configuration of Mesh Topology.
For more information, see Import data from Managed Service for Prometheus to a local Grafana system.
Why is only partial traffic visible in Mesh Topology?
Check the following causes:
Traffic type filter: Verify that all relevant traffic types (gRPC, HTTP, TCP) are selected in Mesh Topology.
Namespace selection: Confirm that the correct namespace is selected. Traffic in unselected namespaces is not displayed.
Data collection issues:
Check whether Prometheus metrics collection is working normally. Collection latency or packet loss can cause gaps.
Verify that all workloads in the cluster have sidecar proxies injected. Only sidecar-injected workloads report traffic metrics.
Refresh the Mesh Topology page to get the latest data.
Sidecar proxy or traffic configuration: Some traffic might bypass sidecar proxies due to port or IP exclusions. Check whether traffic is configured to bypass sidecars in the sidecar proxy configuration, and verify that inbound and outbound traffic settings are correct.