Managed Service for Prometheus exposes an HTTP API that any Grafana instance can query as a data source. Add this endpoint to your local Grafana to visualize Prometheus metrics on your own dashboards.
Prerequisites
Before you begin, make sure that you have:
Grafana installed on your on-premises machine or self-managed server
Access to the ARMS console with permissions to view Prometheus instances
Step 1: Get the HTTP API URL
Each Prometheus instance in ARMS publishes a query endpoint that Grafana can use as a data source.
Log on to the ARMS console.
In the left-side navigation pane, choose Managed Service for Prometheus > Instances.
On the Instances page, click the Prometheus instance that you want to manage.
On the instance details page, click the Settings tab and copy the HTTP API URL.
Select the URL based on your network environment:
URL type When to use Public URL Your Grafana instance accesses the endpoint over the Internet Private URL Your Grafana instance runs within the same VPC or can reach the internal network 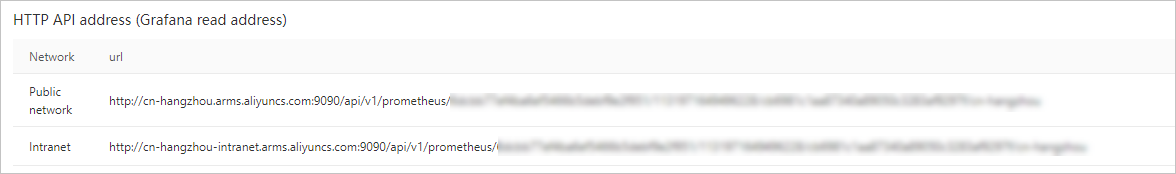 Note
NoteIf your Prometheus instance monitors cloud services, select the HTTP API URL that corresponds to the specific cloud service being monitored.
Step 2: Generate an authentication token (optional)
A token secures communication between your Grafana instance and the Prometheus endpoint. Generate a token to protect read and write operations.
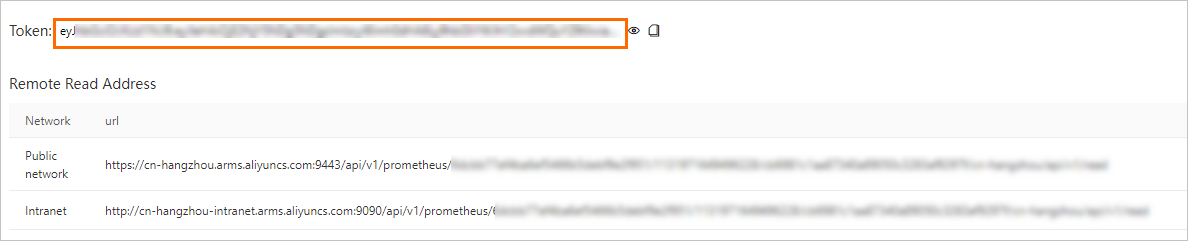
On the Settings tab of your Prometheus instance, click Generate Token.
Copy and save the token. You need it when you configure the data source in Grafana.
ImportantIf you generate a token, you must include it in the Grafana data source configuration. Without it, you may fail to read data from Managed Service for Prometheus.
Step 3: Add a Prometheus data source in Grafana
Add the HTTP API URL from Step 1 as a new Prometheus data source in your local Grafana instance.
Grafana 9.x
In the left-side navigation pane, choose
 > Add data source.
On the Add data source page, click Prometheus.
On the Settings tab, configure the following fields:
Field Value Name A descriptive name for this data source URL The HTTP API URL copied in Step 1 (If you generated a token in Step 2) In the Custom HTTP Headers section, click + Add header and configure the following fields:
Field Value Header AuthorizationValue The token generated in Step 2 
Click Save & Test to verify the connection.
Grafana 10.x
On the Grafana homepage, click the
 icon.
icon.In the left-side navigation pane, choose Management > Data sources.
On the Data sources tab, click + Add data source, then click Prometheus.
On the Settings tab, configure the following fields:
Field Value Name A descriptive name for this data source URL The HTTP API URL copied in Step 1 (If you generated a token in Step 2) In the Custom HTTP Headers section, click + Add header and configure the following fields:
Field Value Header AuthorizationValue The token generated in Step 2 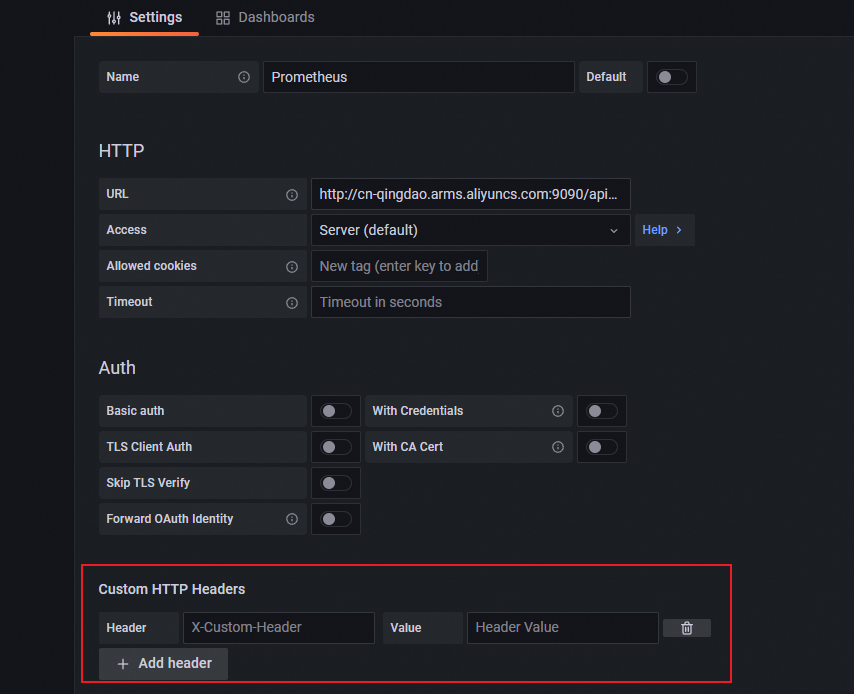
Click Save & Test to verify the connection.
Step 4: Create a dashboard
After you connect the data source, create a dashboard to visualize Prometheus metrics.
Grafana 9.x
In the left-side navigation pane, choose
 > New dashboard.
Click Add a new panel.
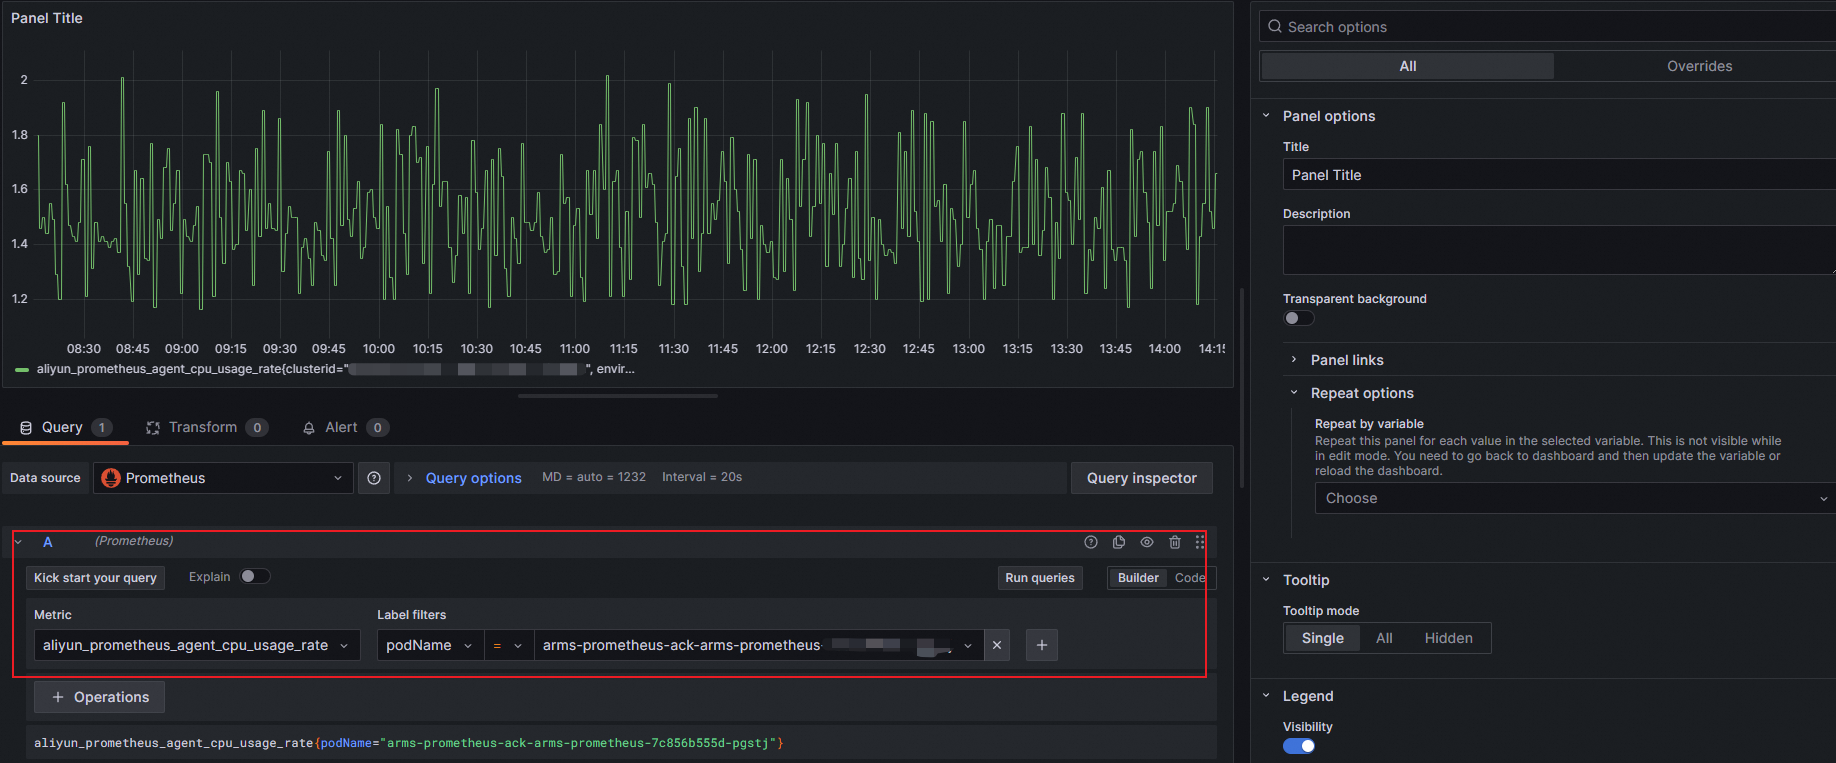
On the Query tab of the Edit Panel page, select the data source you added in Step 3 from the Data source drop-down list.
In the A section of the Query tab, select a metric from the Metric drop-down list, refine the scope with the Labels drop-down list, and click Run queries.
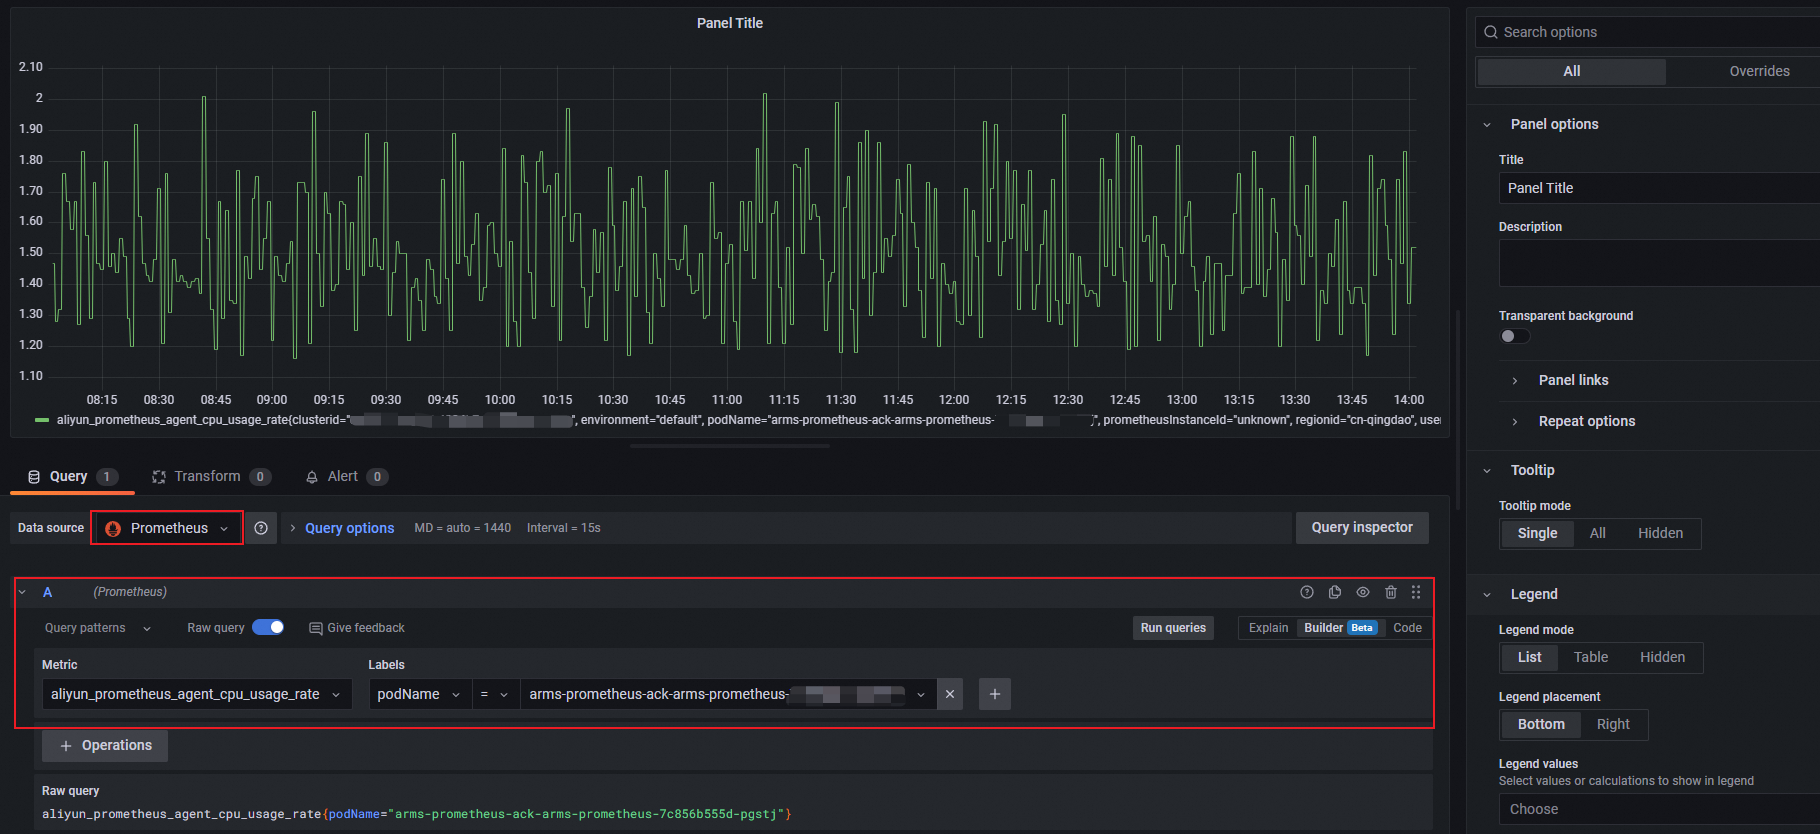
In the right-side pane, specify the chart name, type, and graph styles.
Click Apply.
In the upper-right corner, click the
 icon, enter a dashboard name, select a folder, and click Save.
Grafana 10.x
On the Grafana homepage, click the
icon.In the left-side navigation pane, click Dashboards. From the New drop-down list, select New dashboard.
Click + Add visualization.
On the Select data source page, select the data source you added in Step 3.
In the A section of the Query tab, select a metric from the Metric drop-down list, refine the scope with the Labels drop-down list, and click Run queries.
In the right-side pane, specify the chart name, type, and graph styles.
Click Apply.
In the upper-right corner, click the
icon, enter a dashboard name, select a folder, and click Save.
Step 5: View monitoring data
Open the dashboard you created to verify that Prometheus metrics render correctly.
Grafana 9.x: In the left-side navigation pane, click the icon and click Browse. On the Browse tab, locate the folder that contains your dashboard and click the dashboard name.
Grafana 10.x: On the Grafana homepage, click the icon in the upper-left corner. In the left-side navigation pane, click Dashboards. Locate the folder that contains your dashboard and click the dashboard name.
What to do next
To manage Grafana through Alibaba Cloud, see Managed Service for Grafana. In the left-side navigation pane, choose Managed Service for Grafana > Workspace Management to access your workspaces. You can log on to Grafana with the administrator account and the password configured during workspace creation, or click Sign in with Alibaba Cloud to use your current Alibaba Cloud account.
To learn more about Prometheus metrics and alerting, see the Managed Service for Prometheus documentation.