When CPU usage spikes in production, identifying the exact methods responsible can be difficult from metrics alone. Application Real-Time Monitoring Service (ARMS) continuously profiles active CPU threads by capturing method-level stack snapshots at regular intervals. These snapshots aggregate into flame graphs and method-level statistics, pinpointing which code paths consume the most CPU cycles.
Enabling CPU diagnostics adds approximately 5% CPU overhead. Make sure your instances have enough headroom before you turn it on.
How flame graphs work
ARMS aggregates sampled stack snapshots into a flame graph that encodes two dimensions:
| Dimension | Meaning | How to read it |
|---|---|---|
| Width (X-axis) | Proportion of total CPU time a method consumed | Wider boxes = more CPU time |
| Depth (Y-axis) | Call hierarchy -- bottom is the entry point, top is the leaf method | Look at the top of the graph for methods where CPU cycles are actually spent |
Horizontal position does not represent time progression. Two methods placed side by side did not necessarily run sequentially.
Self time vs. total time
Two metrics help you distinguish between methods that are individually expensive and methods that contribute to high CPU usage through their children:
| Metric | Definition | When to use |
|---|---|---|
| Self | Time or resources a method consumes within the stack, excluding time or resources consumed by child methods | Find methods that are individually expensive |
| Total | Time or resources a method consumes, including time or resources consumed by all child methods | Find call paths that contribute the most overall CPU time |
Self time = Total time - sum of children's Total time. For example, if a method shows 309 ms Total and its only child shows 112 ms Total, the parent's Self time is 197 ms (309 - 112).
Enable CPU diagnostics
Log on to the ARMS console. In the left-side navigation pane, choose Application Monitoring > Application List.
On the Application List page, select a region in the top navigation bar and click the name of the application.
Icons in the Language column indicate the application language:
 Java
Java  Go
Go  Python Hyphen (-): application monitored through Managed Service for OpenTelemetry.
In the left-side navigation pane, click Application Settings. Click the Custom Configuration tab.
In the Continuous profiling section, turn on Main switch and CPU hotspot, then specify the IP address of an application instance or the CIDR blocks for multiple instances.
Click Save.
The change takes effect immediately -- no application restart required.
Identify the root-cause method
The following walkthrough uses a Java method that busy-waits for 500 milliseconds to simulate sustained CPU consumption:
public class CPUPressure {

    // Busy-wait loop that holds the CPU for 500 ms per call
    public void runBusiness() {
        long start = System.currentTimeMillis(), period = 0;
        while (period <= 500L) {
            period = System.currentTimeMillis() - start;
        }
    }
}
Step 1: Open the profiling view
Log on to the ARMS console. In the left-side navigation pane, choose Application Monitoring > Application List.
On the Application List page, select a region in the top navigation bar and click the name of the application.
Icons in the Language column indicate the application language:
Java Go Python Hyphen (-): application monitored through Managed Service for OpenTelemetry.In the left-side navigation pane, click Continuous profiling. Select the target instance and a time range.
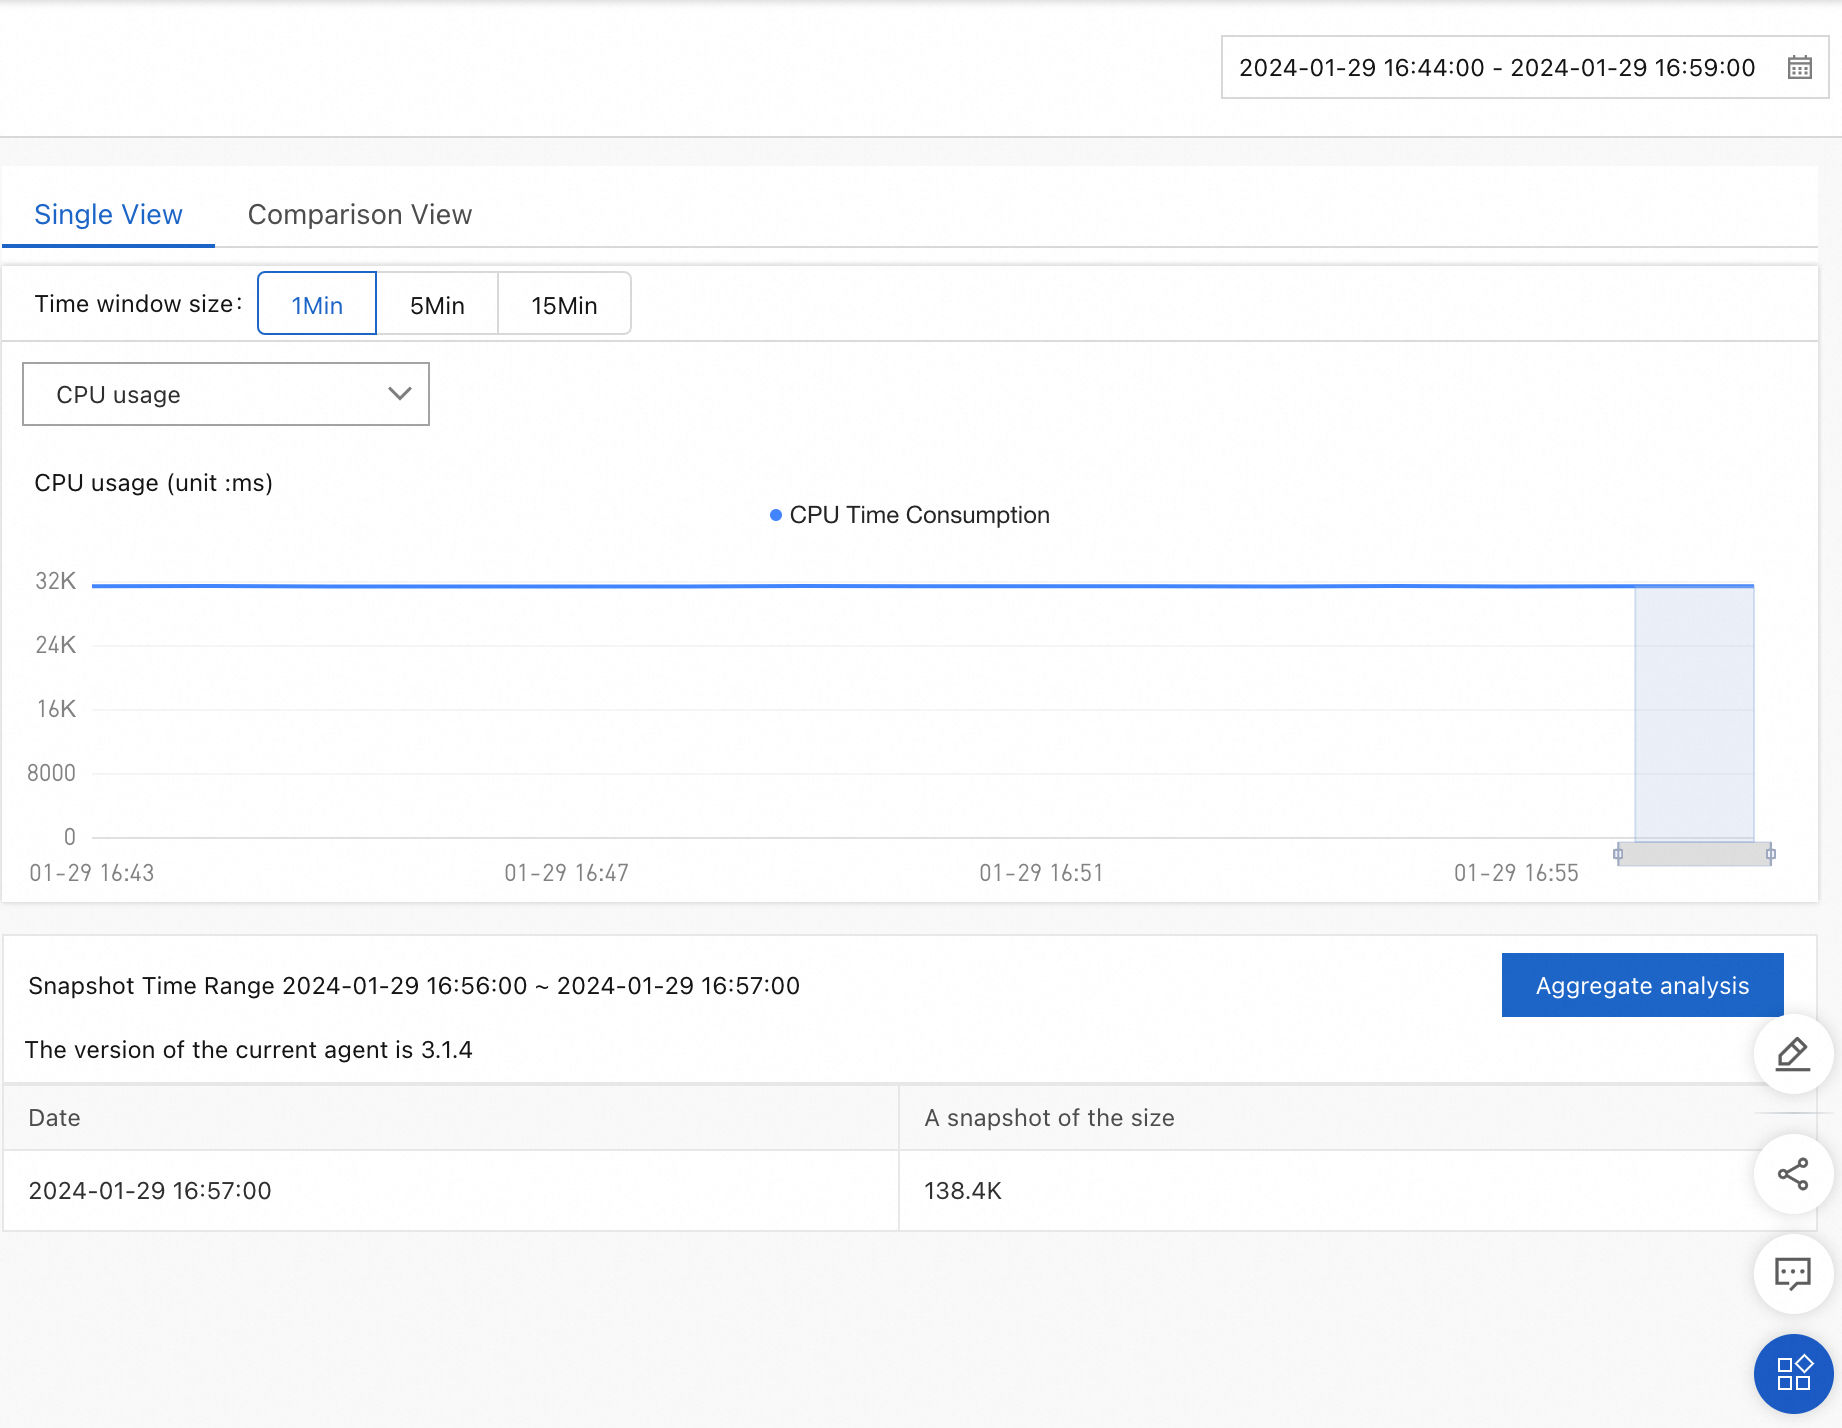
On the Single View tab, query data and view aggregation results.
Three profiling types are available:
CPU Time: CPU cores consumed by each method.
Allocated Memory: Bytes of memory allocated.
Allocations: Number of memory allocation calls -- useful for spotting methods that allocate frequently.
Step 2: Locate the expensive method
Click Aggregation & Analysis. Set Profiling Type to CPU Time. The left panel lists all methods involved in the sampled call stacks. The right panel displays the flame graph.
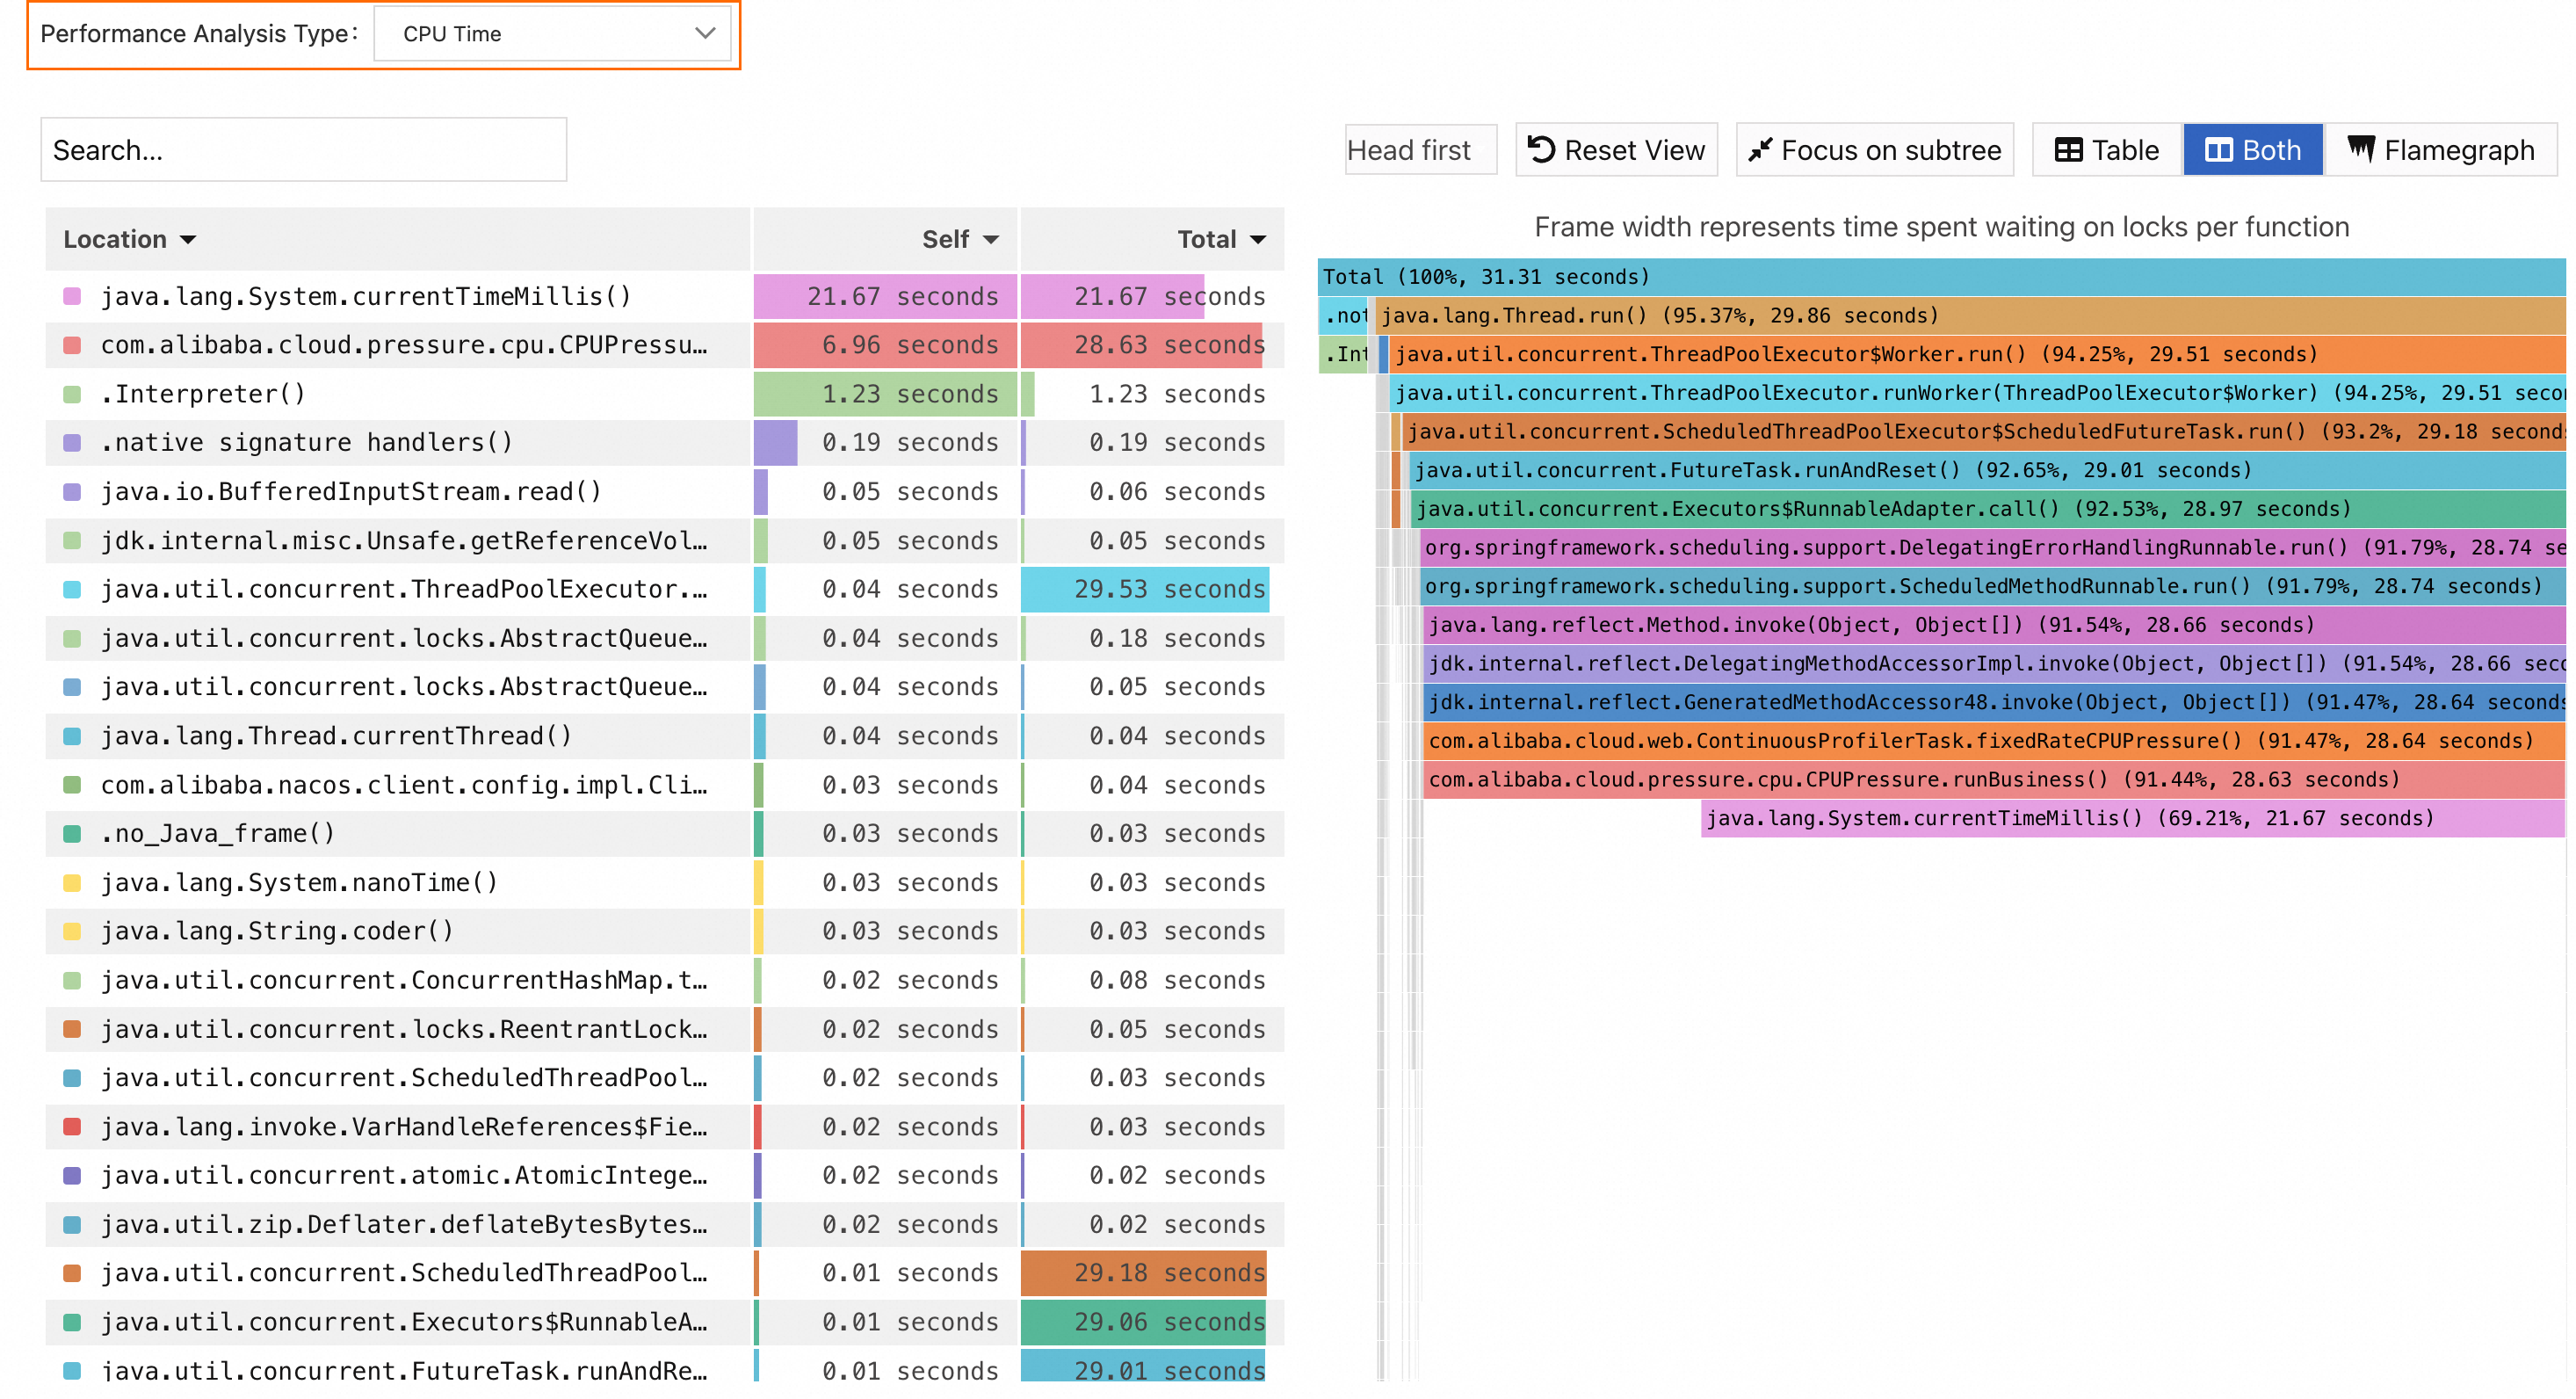
Sort the Self column in ascending order. Find and click the method with the largest Self value. In this example,
java.lang.System.currentTimeMillis()appears at the top. Clicking it highlights the corresponding box in the flame graph.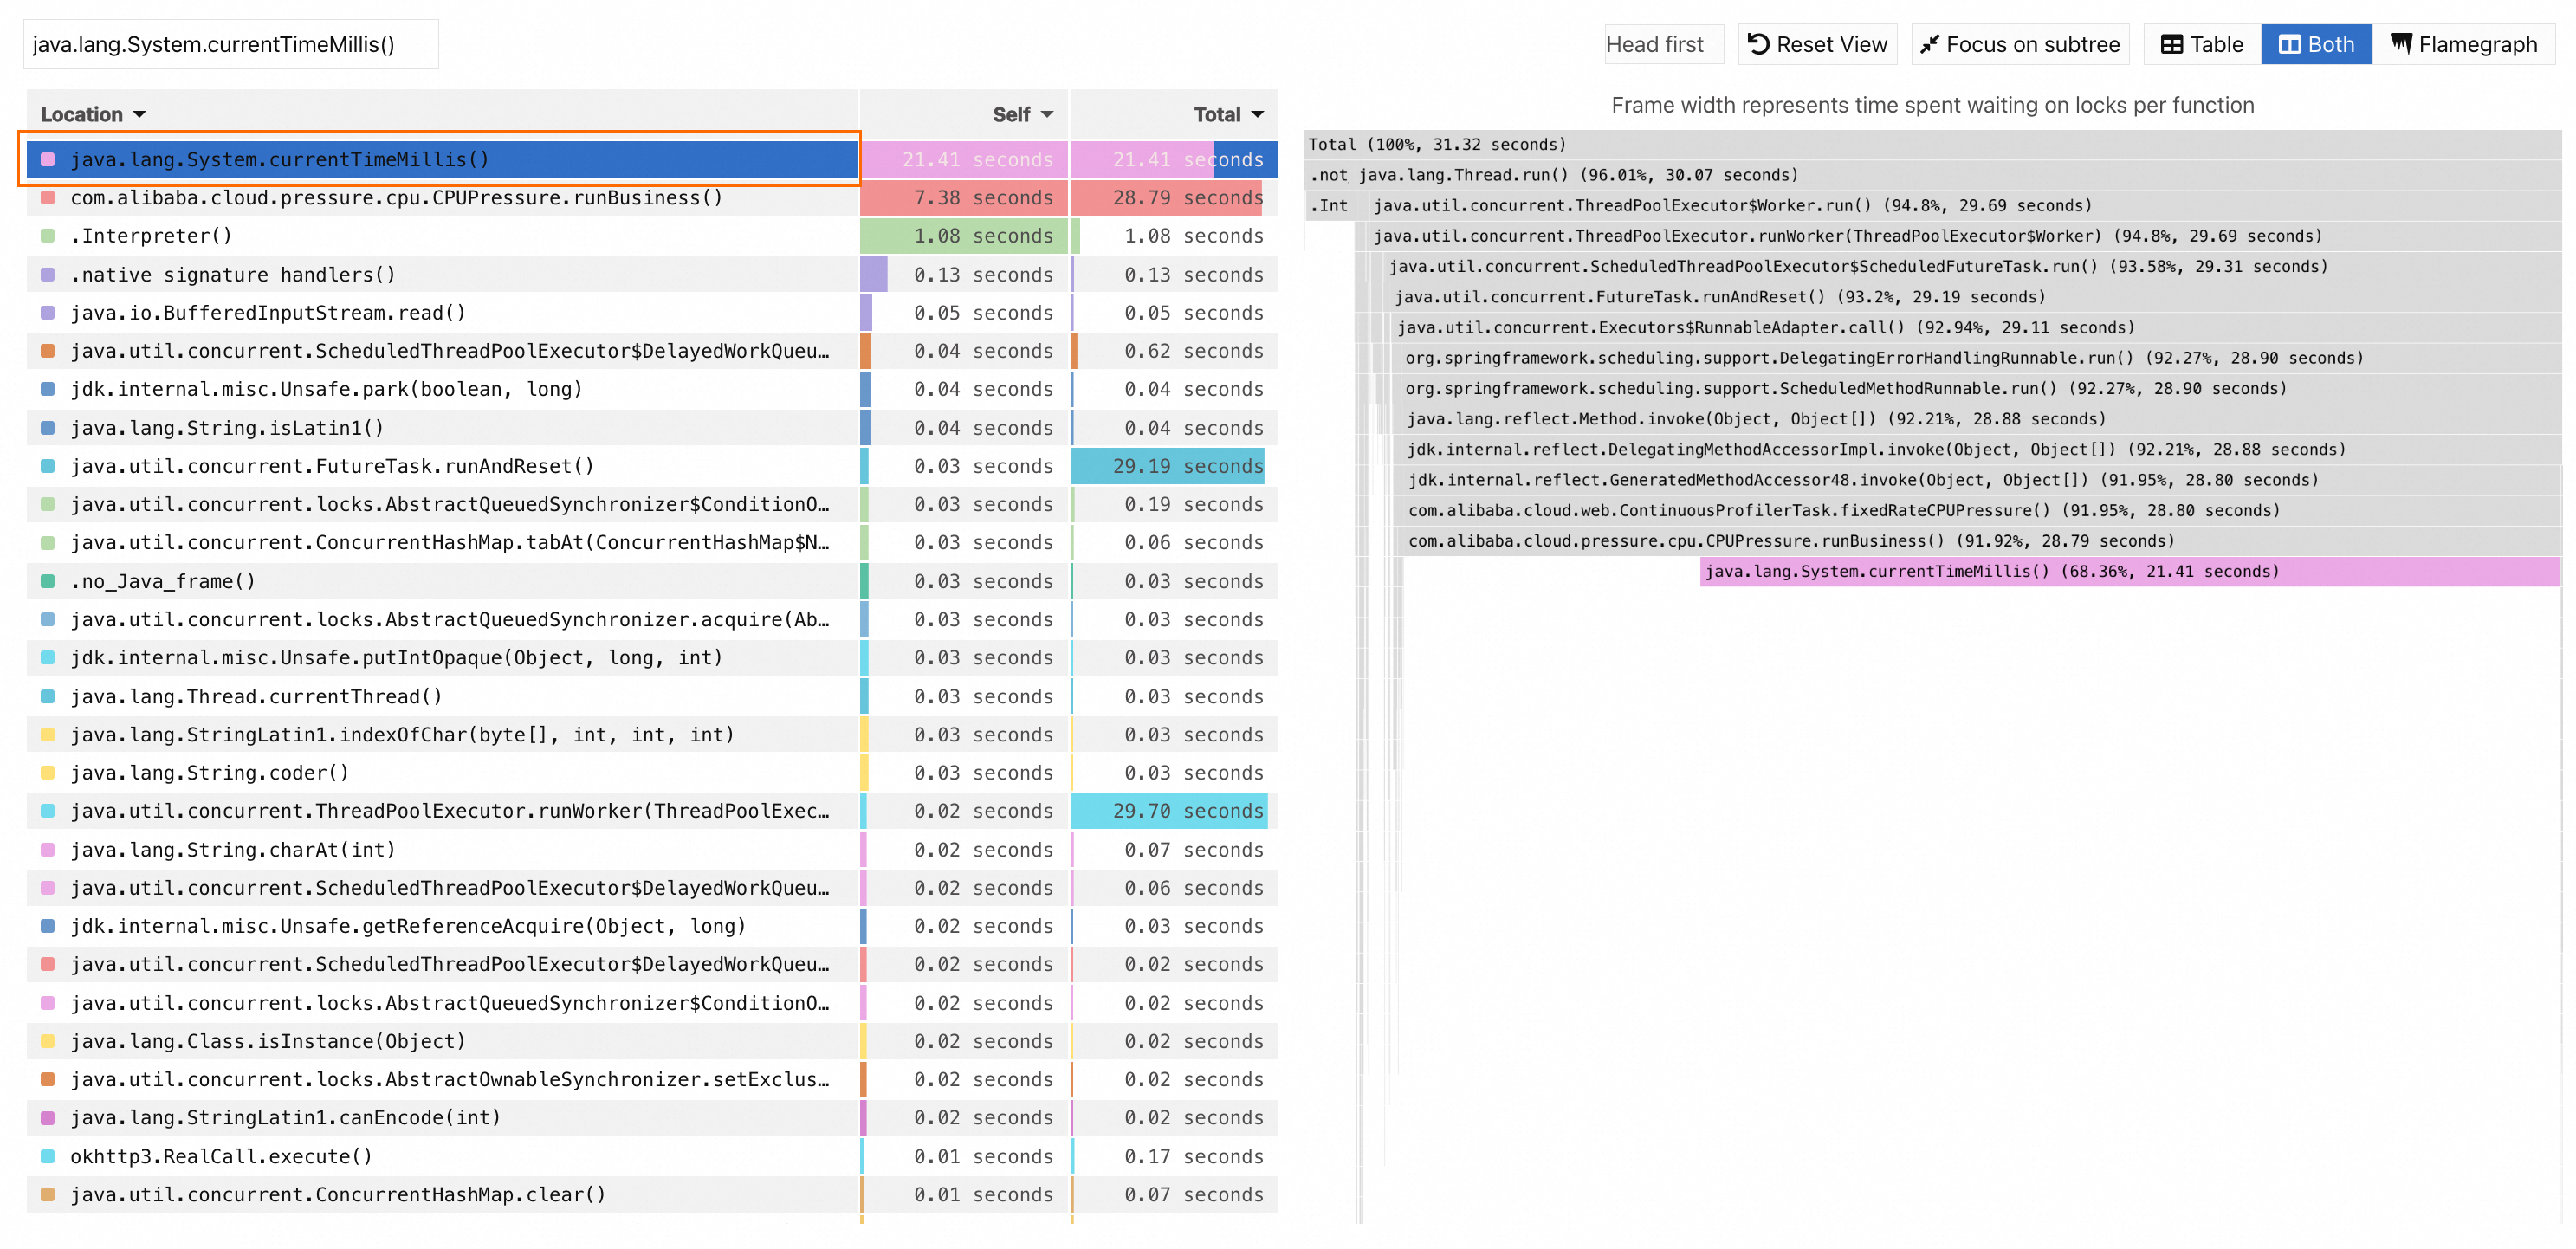
Confirm in the flame graph that
currentTimeMillis()has the widest box at the top of the stack, meaning it consumed the most Self time or resources.
Step 3: Trace back to application code
Since currentTimeMillis() is a JDK library method, look one level down in the call stack to find the application method calling it: com.alibaba.cloud.pressure.memory.CPUPressure.runBusiness().
This method consumed 28.63 seconds over a 1-minute window, accounting for 91.44% of total CPU time. This matches the expected behavior -- runBusiness() busy-waits for 500 ms on each invocation, so it dominates CPU usage under load.