When your application servers show high CPU utilization or memory consumption and you need to find which methods are responsible, a flame graph pinpoints the exact call paths consuming the most resources. Application Real-Time Monitoring Service (ARMS) continuous profiling generates flame graphs for root cause analysis of performance bottlenecks such as high CPU utilization, excessive memory consumption, and latency spikes.
How to read a flame graph
A flame graph visualizes sampled call stack data as a single chart. Each box represents a function in the call stack.
The two axes encode different information:
| Axis | Represents | Details |
|---|---|---|
| X-axis | Proportion of total resource usage | Wider boxes consume more CPU or memory. The x-axis does not represent time progression. Functions are sorted alphabetically to merge identical stack frames, which maximizes frame consolidation and highlights the most significant call paths. |
| Y-axis | Call stack depth | The stack bottom contains the entry-point functions. The stack top contains the most recently called child functions. |
In computer science, a stack is an abstract data type that serves as a collection of elements with two main operations: Push (inserts elements into the stack) and Pop (removes elements from the stack). In a flame graph, the more time a function takes to execute, the more time its parent function consumes and the wider its box appears. By comparing flame graphs at different time points, you can efficiently diagnose and handle performance bottlenecks.
Self time vs. total time
A function's box width represents its total time -- the time spent in the function itself plus all the functions it calls. The portion of the box that has no child function directly below it represents the function's self time -- time spent executing its own code, excluding calls to other functions.
When analyzing bottlenecks, focus on functions with high self time. A wide box does not always indicate a slow function -- it may simply call many child functions.
Flame graph vs. icicle graph
Flame graphs have two layout orientations that display the same data:
| Layout | Stack top | Stack bottom | Analysis direction |
|---|---|---|---|
| Flame graph | Top of the chart | Bottom of the chart | Bottom to top |
| Icicle graph | Bottom of the chart | Top of the chart | Top to bottom |
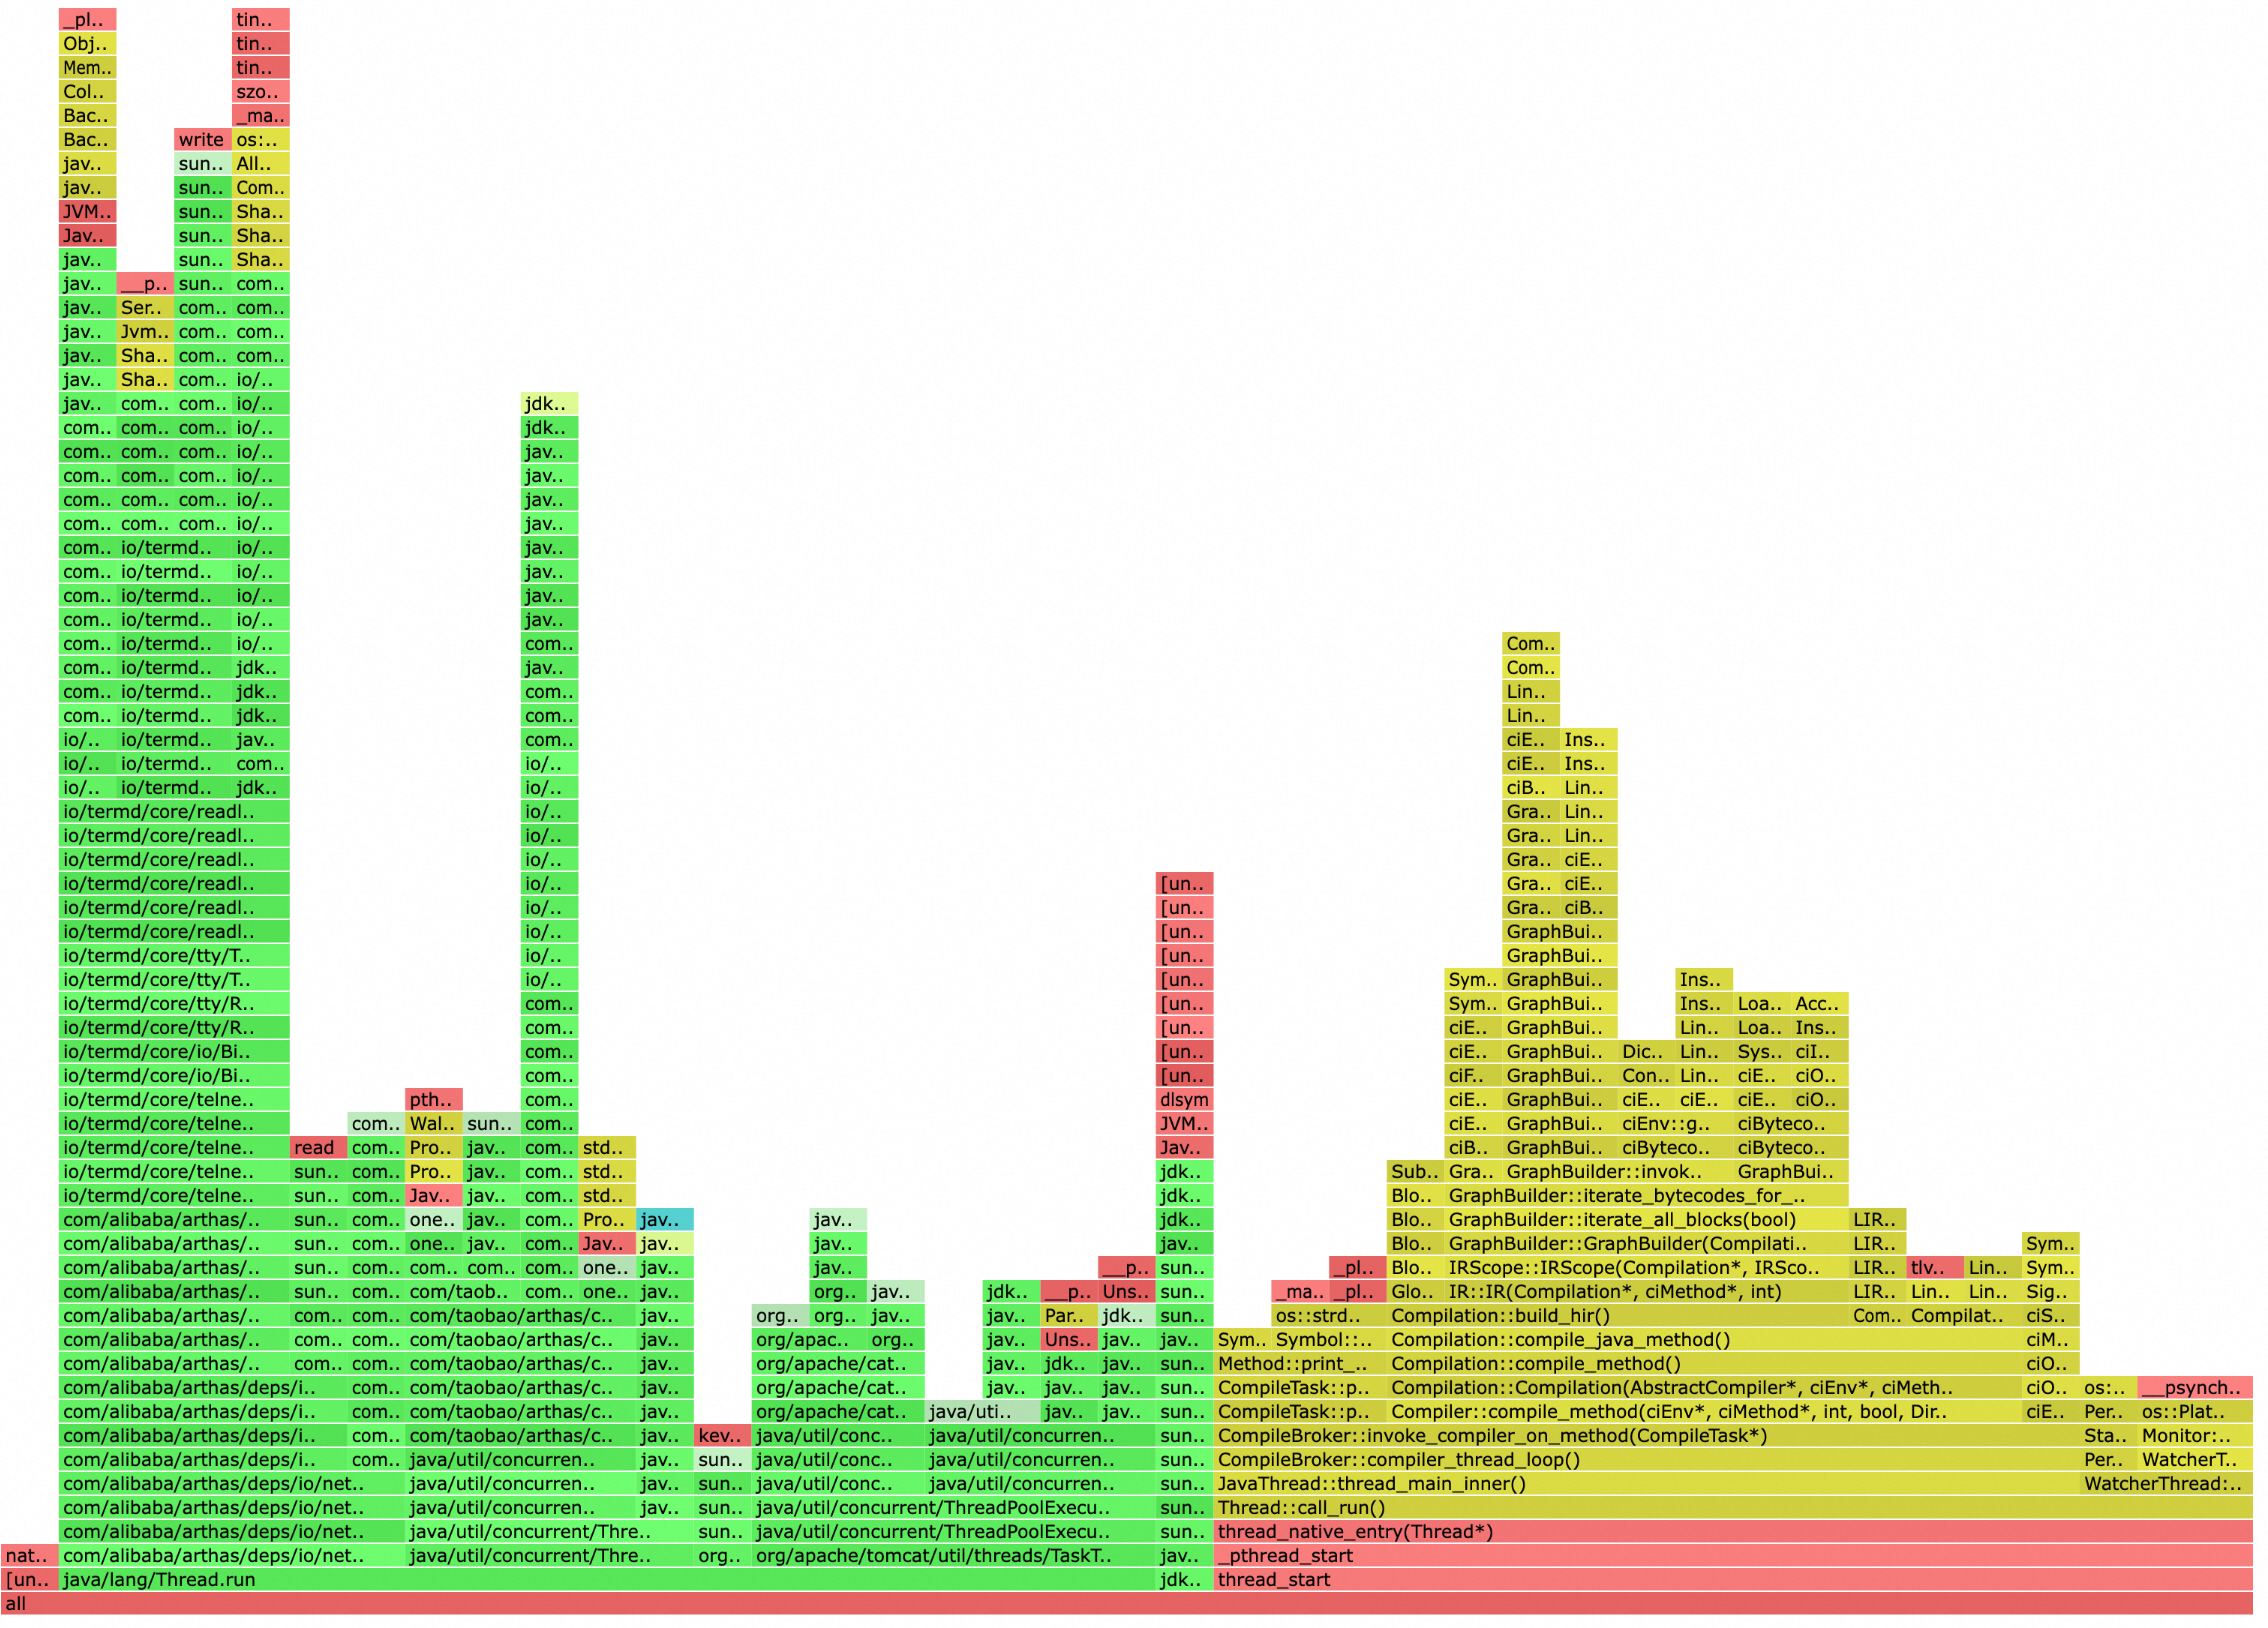
Flame graph
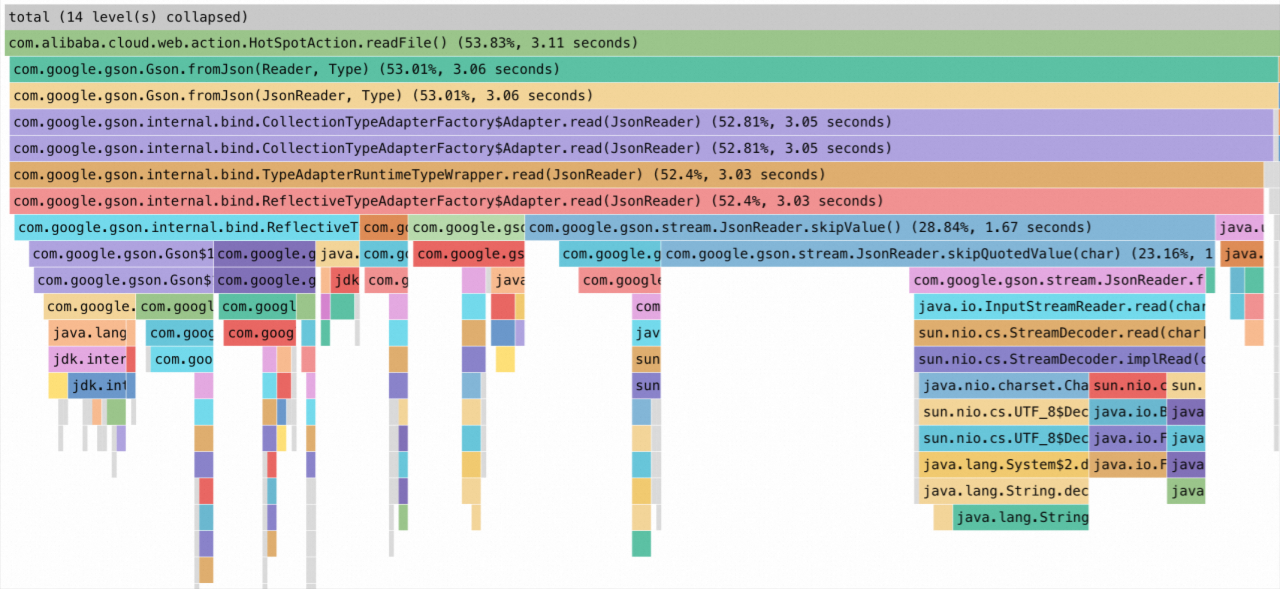
Icicle graph
Identify a bottleneck in three steps

| Step | Action | Why |
|---|---|---|
| 1 | Determine the layout. Identify whether the graph is a flame graph or an icicle graph, then locate the stack top. | The stack top is where bottleneck functions surface. |
| 2 | Find wide boxes at the stack top. Wide boxes at the stack top indicate functions that consume a large proportion of resources. | Width = proportion of total resource usage. |
| 3 | Trace back to your application code. From the wide box at the stack top, trace through the call chain until you find the first method defined by your application -- not a library or framework method. | Library functions are not directly optimizable. The first application-defined method in the chain is the one to investigate. |
Example: identify a CPU bottleneck
The following icicle graph shows high CPU usage. To reproduce this analysis, enable the continuous profiling feature for your application.
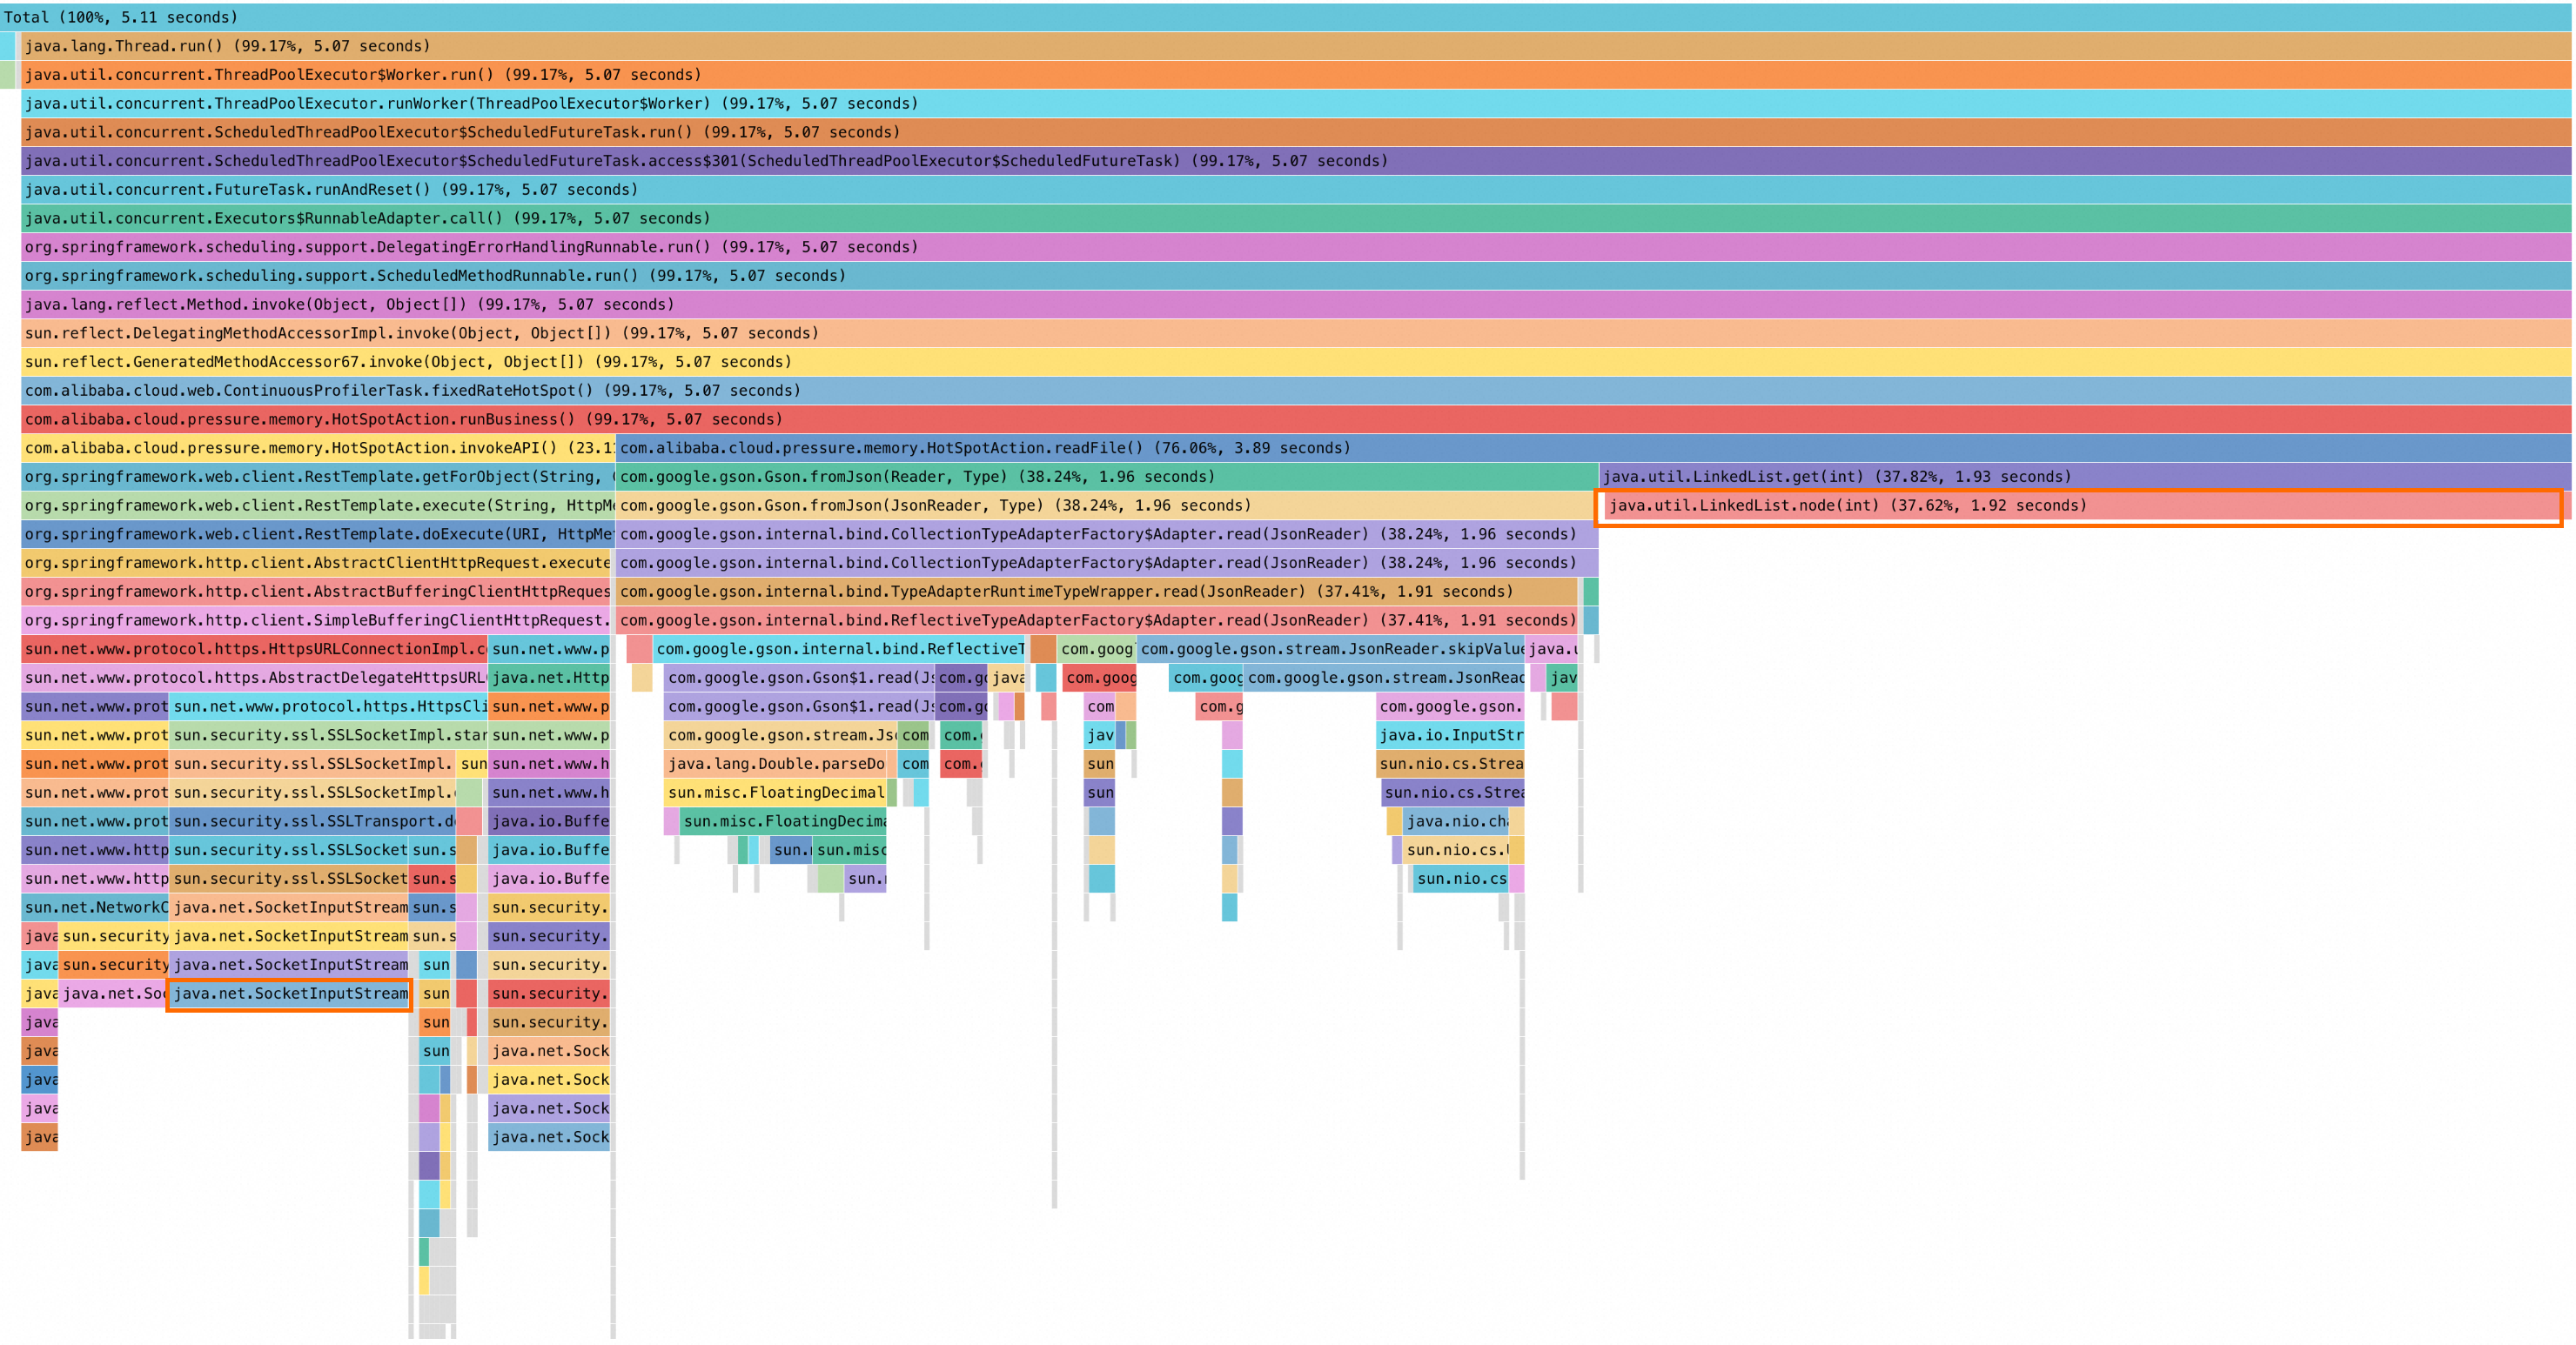
Step 1: determine the layout
This is an icicle graph: the stack bottom is at the top and the stack top is at the bottom. Analyze from bottom to top.
Step 2: find wide boxes at the stack top
The java.util.LinkedList.node(int) method on the right side of the stack top has a wide box, indicating high resource consumption.
Step 3: trace back to application code
java.util.LinkedList.node(int) is a Java Development Kit (JDK) library function, not application code. Trace upward through the call chain:
| Method | Type | Action |
|---|---|---|
java.util.LinkedList.node(int) | JDK library function | Continue tracing. |
java.util.LinkedList.get(int) | JDK library function | Continue tracing. |
com.alibaba.cloud.pressure.memory.HotSpotAction.readFile() | Application code | First application-defined method found. |
Result: HotSpotAction.readFile() consumes 3.89 seconds, accounting for 76.06% of the stack. This method is the primary bottleneck. Review its implementation to determine whether the call pattern can be optimized.
Secondary bottleneck
The java.net.SocketInputStream method in the lower-left corner of the graph leads to another application method: com.alibaba.cloud.pressure.memory.HotSpotAction.invokeAPI, which accounts for approximately 23% of the stack.
What's next
Diagnose specific performance issues:
Use the code diagnostics feature to diagnose slow traces for Java applications
Use the CPU diagnostics feature to diagnose high CPU utilization
Use the memory diagnostics feature to diagnose high heap-memory usage
Troubleshoot continuous profiling: