This topic provides answers to frequently asked questions (FAQ) about the continuous profiling feature of Application Real-Time Monitoring Service (ARMS).
Why is there no data on the page after enabling continuous profiling?
Check whether the related configurations are correct and whether the configured network segment includes the IP address of the application instance.
If you use an ARMS agent earlier than V3.1.4, the profiling engine may fail due to compatibility issues with the Alpine base image (this issue has been fixed in version 3.1.4). To ensure functional stability and data integrity, we recommend that you upgrade the agent to V3.1.4 or later.
NoteFor information about how to check whether you are using an Alpine Linux base image, see Others.
Continuous profiling collects data by enhancing the open-source Async Profiler. Currently, it does not support mounting multiple Async Profilers simultaneously. If the application also uses the continuous profiling feature provided by the Pyroscope agent, it may fail to start.
Adjust the query time on the Application Diagnostics > Continuous Profiling page backward by 8 hours and check whether data exists. If data exists, it may be because the time zone of the application is set to UTC+0, causing the data write time to be 8 hours later than UTC+8.
Solution: Add an environment variable to the application to adjust the time zone to UTC+8.
NoteWe recommend that you first filter by the current pod name on the Application Diagnostics > Continuous Profiling page to avoid confusion caused by excessive container restarts in the past 8 hours.
Key: JAVA_TOOL_OPTIONS, Value: -Duser.timezone=GMT+8This issue has been fixed in the ARMS agent V4.1.10. If you confirm that this is the issue, you can also directly upgrade the agent to V4.1.10 or later.
Check whether the application itself has mounted other Async Profiler dynamic libraries as follows:
Run the following command. Replace
[pid]with the process ID of the application:lsof -p [pid] | grep libasyncIf the result contains a non-Alibaba Cloud dynamic library similar to the following one, the application itself is using an Async Profiler dynamic library, which causes incompatibility with ARMS. In this case, you need to remove the dynamic library before continuing to use ARMS features.
/home/admin/xxx/.default/temp/libasyncProfiler1309163652530490111.so
The memory usage percentages shown in heap memory monitoring and those detected during a certain period in continuous profiling are different. Is this normal?
Continuous profiling only records heap memory allocation during a specified period, rather than the total amount of memory actually contained by the current process. Therefore, it is normal to see differences between these two sets of data.
Why does CPU diagnostics display data while memory diagnostics show none?
Issue
The absence of memory diagnostics data typically occurs to ARMS agents V3.1.4 or later in containerized environments using Alpine base images. Alpine strips JDK debug symbols to reduce image size, disabling continuous profiling capabilities.
Solution
Check whether the JDK in the environment contains debug symbols.
If no, install them for the JDK in your images (the installation may fail for some JDK versions without the debug symbol packages) or use non-Alpine base images.
Why is there no data for code hotspots? Why does the code hotspot data not meet expectations?
Memory hotspot analysis is unavailable for applications using virtual threads or similar technologies in their JDKs (including the Alibaba Dragonwell JDK).
Currently, the code hotspot feature is not supported by the SkyWalking protocol. Verify the protocol type in the span details of the trace.
The code hotspot feature requires an ARMS agent of V3.1.4 or later.
ARMS agents earlier than V4.2.1 support only synchronous invocations and may exhibit incomplete data collection. Asynchronous invocations may result in missing or inaccurate data. For example, when frameworks such as Spring Cloud Gateway, Undertow, and Lettuce are used, asynchronous thread switching can lead to inaccurate data collection. Agents V4.2.1 and later are optimized to resolve these issues. Update your agent for optimal performance.
Code hotspots are only supported for traces sampled at a fixed sampling rate. Collecting traces using a non-fixed sampling rate can incur significant performance overhead, such as mis-sampling (s9) and slow sampling (s10) triggered after the completion of the trace (you can check the sample.reason field in the span attributes). Traces collected using a non-fixed sampling rate currently do not support code hotspots.
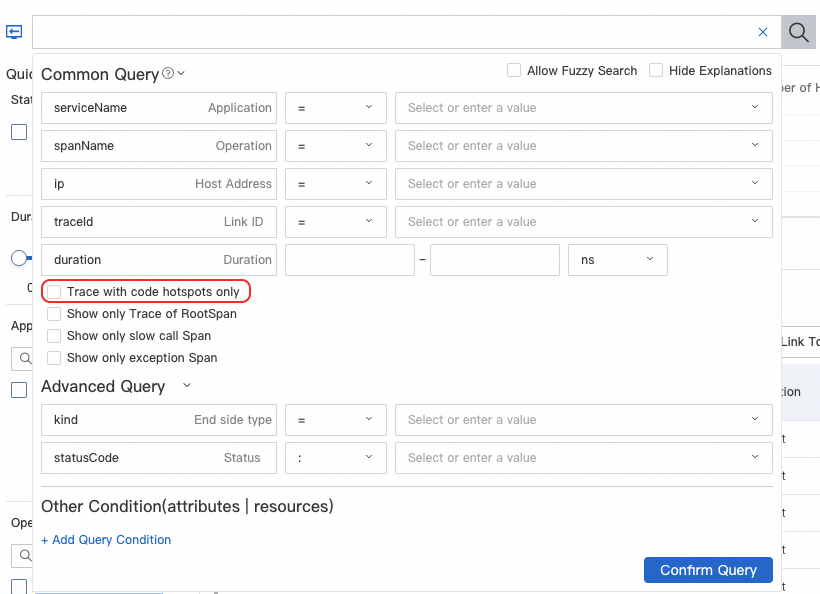
For traces collected at a non-fixed sampling rate, we recommend that you filter traces containing code hotspots using the Traces with Hotspot Code parameter on the Trace Explorer page for problem diagnostics.
If you are using an agent V4.2.1 or later but find that the collected duration is significantly lower than the duration recorded by the outer span, this may indicate that your application uses an asynchronous, non-blocking NIO framework (for example, Spring Cloud Gateway). Such frameworks, when sending requests to downstream services, do not block threads if the downstream data is not ready; instead, they immediately return, allowing threads to perform other tasks and thus improving thread utilization. Since no actual thread execution occurs in this scenario, the performance bottleneck may not lie within the current application. In such cases, the code hotspot collection duration may be much lower than the span duration. You should focus on investigating whether there are bottlenecks in downstream application request processing or network latency.
What is the performance overhead of continuous profiling?
Continuous profiling has been tested and, in a 500 TPS scenario with all features enabled in a typical Spring Web application, CPU overhead increases by about 5%, off-heap memory usage increases by approximately 50 MB, and GC and request latency do not show significant increases.
In extreme cases, since memory hotspot analysis does not currently implement throttling, if the application frequently allocates memory, it may generate a large number of related events (such as tens of thousands per minute), potentially impacting P99 latency. You can temporarily disable memory profiling to resolve this issue.
This issue has been fixed in V4.1.10. You can directly upgrade the agent to V4.1.10 or later.
Why are there JFR-related threads in the application?
The continuous profiling feature generates JFR threads. These threads mainly exist in the ARMS agent V4.1.10 and will no longer be actively introduced in V4.1.10 or later.
These threads will not cause performance bottlenecks for the application.
After dynamically disabling continuous profiling, the threads will not be destroyed immediately but will disappear only after the application restarts.
What should I do if continuous profiling affects application startup time?
For applications enabling continuous profiling, if the JDK lacks debug symbols and the class loader loads many methods, startup speed may slow down significantly. However, after startup is complete, there is no impact on runtime performance.
This issue has been fixed in V4.2.1 and will not affect application startup. You can upgrade the agent to V4.2.1 or later.
Why does the total memory in the flame graph exceed the actual configured memory limit?
The data displayed in continuous profiling is not directly tied to the machine configuration. The data represents the size of heap memory allocated during the analyzed time period. Due to garbage collection, it is expected that the displayed memory might exceed the actual configured memory of the machine.
What should I do if OpenJ9 JDK integration fails?
Continuous profiling does not currently support Eclipse OpenJ9 (previously known as IBM J9). This JDK may fail to be integrated, reporting errors. We recommended using OpenJDK or Oracle JDK.
What should I do if the code hotspot data in Spans is incomplete?
Code hotspots are collected by sampling method stacks of threads in traces at regular intervals. For missing methods in the code hotspot flame graph, check if their execution time is less than 500 milliseconds. If it is, they may not be captured. This does not affect the diagnosis of related slow traces, as methods with short execution times are unlikely to be performance bottlenecks.
Why does the flame graph contain .GC_active stacks?
.GC_active indicates that during flame graph data collection, the application was affected by the Stop-the-World process of garbage collection (where all Java business threads are paused). This causes the suspension of related business threads. If .GC_active appears in code hotspots, it means part of the request latency was caused by GC pauses.
Why does the flame graph contain .no_Java_frame entries?
This is generally due to the use of the Alpine base image. To reduce image size, Alpine removes JDK debug symbols, preventing the recognition of function names in C++ thread method stacks within the JDK. As a result, these stacks are displayed as .no_Java_frame. Since these stacks primarily represent non-Java thread execution information (such as VM threads or JIT compiler threads), you can ignore them if their proportion is low and focus on other Java method stacks for performance analysis. If .no_Java_frame entries account for a high proportion, consider installing debug symbols for the JDK in the base image or switching to a non-Alpine base image. Note that some JDK versions lack corresponding debug symbol packages, which may prevent installation.
Why does the "other" item appear in the flame graph?
Issue
An "other" item appears in the flame graph, as shown in the following figure.
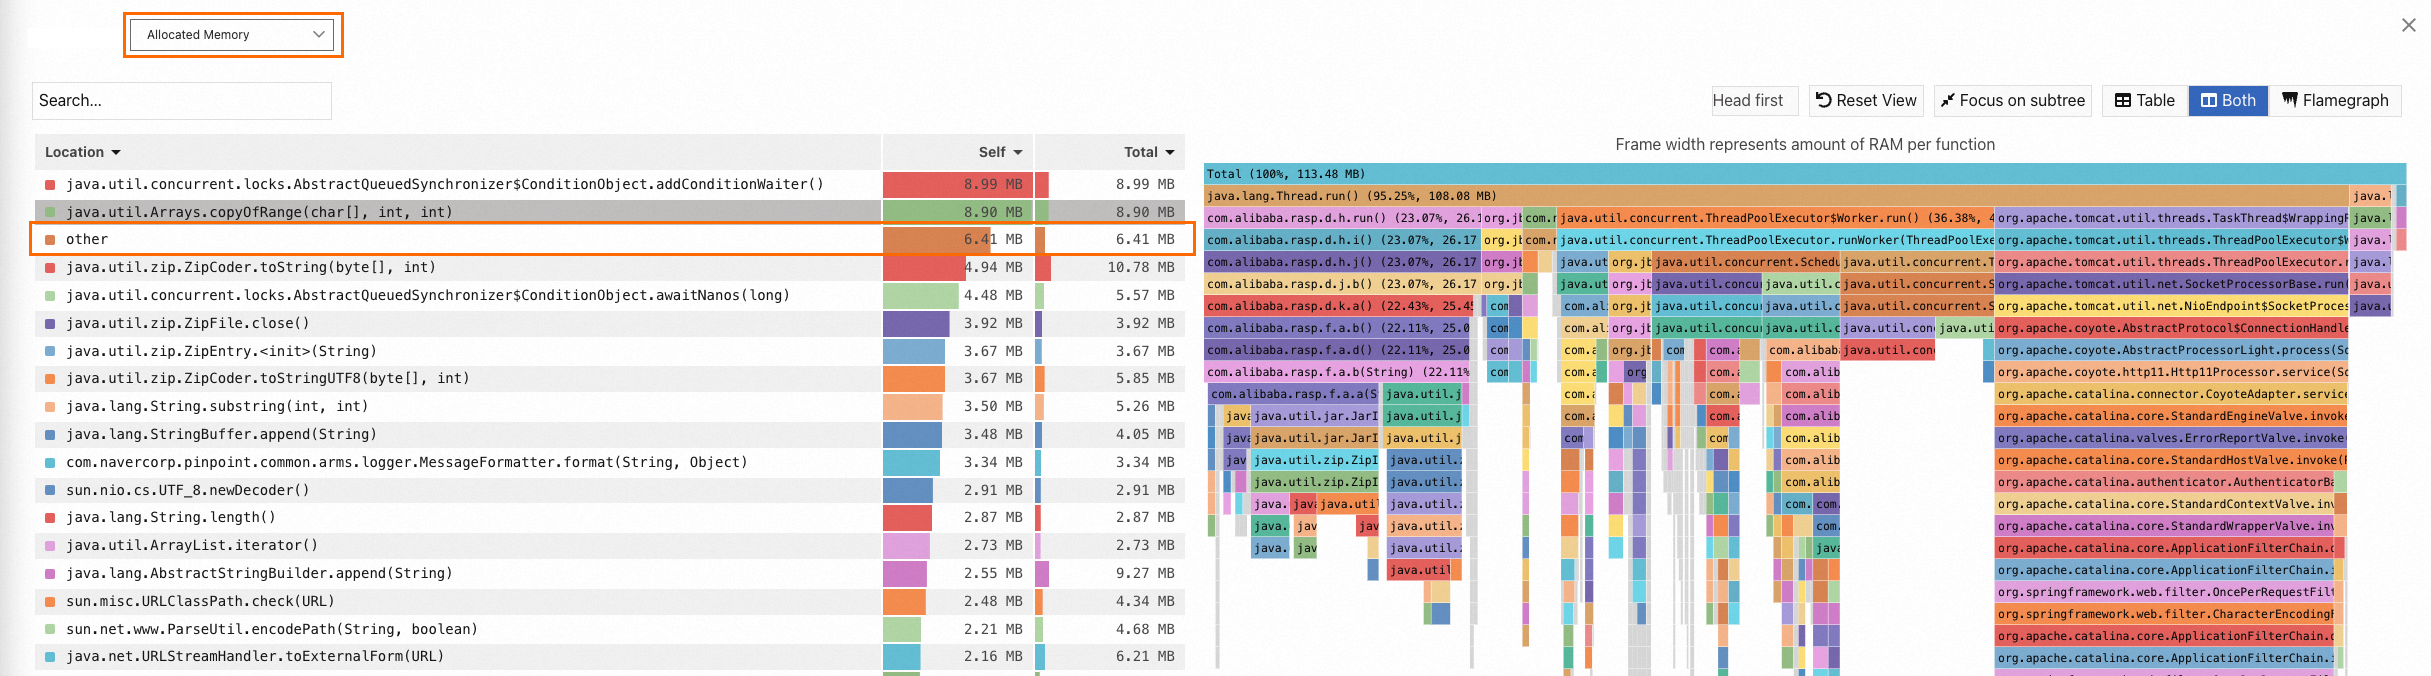
Cause
The appearance of the "other" item in the flame graph is normal. A flame graph is essentially a tree structure. When there are many nodes, it becomes difficult to extract key information from the graph. Therefore, ARMS consolidates some less critical nodes into the "other" category to simplify the visualization and highlight important information.
Does the log output "parse lib sigsegv handler installed" affect the application at runtime?
This log message is printed by the ARMS agent and is considered unnecessary logging. It only appears after enabling continuous profiling and has no impact on the application at runtime. Additionally, ARMS plans to disable this log output in future versions.
How do I resolve the "No access to perf events" error caused by restrictions on perf_event_open?
Issue
async-profiler relies on the perf_event_open system call for CPU profiling. However, due to security policies (such as seccomp) controlling system call permissions in the Linux kernel, certain system calls may be prohibited. The error message will indicate that there is no access to perf events.
Error message:
[ERROR] Failed to execute 'start,jfr=0,event=cpu,interval=11ms,alloc=512k,file=/tmp/cpc-async-profiler-7729534006755968198.jfr'
[ERROR] Failed to start Continuous Profile Collector
java.lang.RuntimeException: java.lang.IllegalStateException: No access to perf events. Try --fdtransfer or --all-user option or 'sysctl kernel.perf_event_paranoid=1'
Solution
Docker environment: Run the following command to run the container. For more fine-grained system call control configurations, see Docker documentation.
docker run --security-opt seccomp=unconfined XXXKubernetes environment: Configure the privileged container parameter
privileged: true. Privileged containers remain Unconfined.For more fine-grained system call control configurations, see Kubernetes documentation.
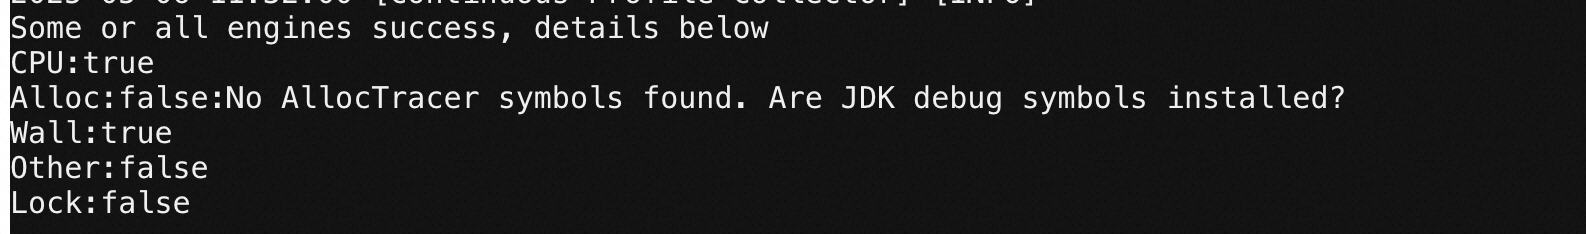
How do I resolve the "No AllocTracer symbols found. Are JDK debug symbols installed?" error?
This error or missing profiling data may occur to Java processes running in container environments when Alpine base images are used. Such images strip JDK debug symbols to reduce image size, deteriorating continuous profiling functionality. In this case, upgrade the JDK, change base images, or use the standard Alpine Linux and JDK as needed.
How do I resolve the "perf_event mmap failed..." error?
Issue
This error typically appears in the standard output of the JVM. When the continuous profiling feature collects CPU hotspot samples, it simultaneously gathers both native stacks (Linux Kernel + JVM + C/C++) and Java stacks. Collecting native stacks requires performing an MMap on the perf_event file descriptor for each thread in Java. The Linux kernel imposes a limit on the total memory size for MMap operations related to perf_event (default threshold: 516 KB). When there are many threads in Java, this limit can be exceeded, triggering a warning message in the Java standard output: perf_event mmap failed... This warning has no side effects on the operation of Java or the business logic. The actual impact is that native stacks will not appear in the flame graph. Generally, when diagnosing CPU hotspot issues, examining only the Java method stack is sufficient, so you can safely ignore this warning.
Solution
To resolve this error, follow these steps:
Run the following command on the host.
echo 1028 > /proc/sys/kernel/perf_event_mlock_kbThe default threshold is 516 KB. You can gradually increase this value until the warning disappears. It is recommended to set the value to satisfy the formula 8 × N + 4, where N is a natural number. For example: 516 = 512 + 4, 1028 = 1024 + 4.
Restart Docker to resolve the error.
Others
How do I verify that the JDK in the environment contains debug symbols?
Missing debug symbols prevent memory hotspot activation and data collection. Use either of the following ways to check whether the JDK in the environment, where an ARMS agent resides, contains debug symbols:
View agent logs
Check the agent's logs directory for the cpc.log file (or the logs/arms_log file for early agent versions). The keyword No AllocTracer symbols found. Are JDK debug symbols installed? indicates missing symbols.
Run commands
Run the
which javaorecho $JAVA_HOMEcommand to find the JDK path.Run the following command from the JDK root directory to find the
libjvm.sofile path:find ./ -name "*libjvm.so*"Run the following command to check whether the plug-in is stripped of debug symbols. Replace
/path/to/with the path that stores thelibjvm.sofile.file /path/to/libjvm.soIf
not strippedis returned, the JDK contains debug symbols.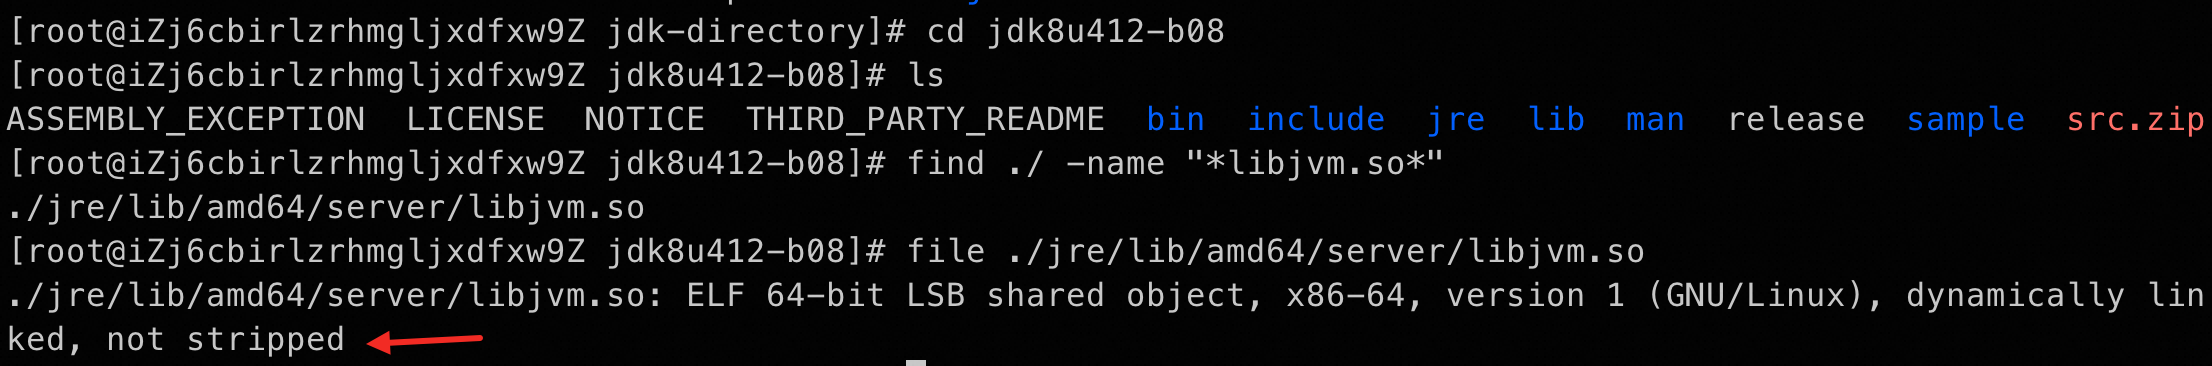
How do I resolve memory hotspot collection failures resulting from missing debug symbols?
Use any of the following ways to resolve such failures:
Upgrade the JDK to JDK 11 or later
The implementations of JDK 11 and later no longer require debug symbols due to architectural optimizations.
Change base images
Visit Docker Hub and search for popular JDK distributions using the keyword openjdk (such as eclipse-temurin, ibm-semeru-runtimes, and amazoncorretto). Then, look for JDK images not built on Alpine Linux. If you have your own repository of commonly used JDK images, you can also use the images there. Typically, JDK images built on Alpine Linux include keywords like alpine in their tags.
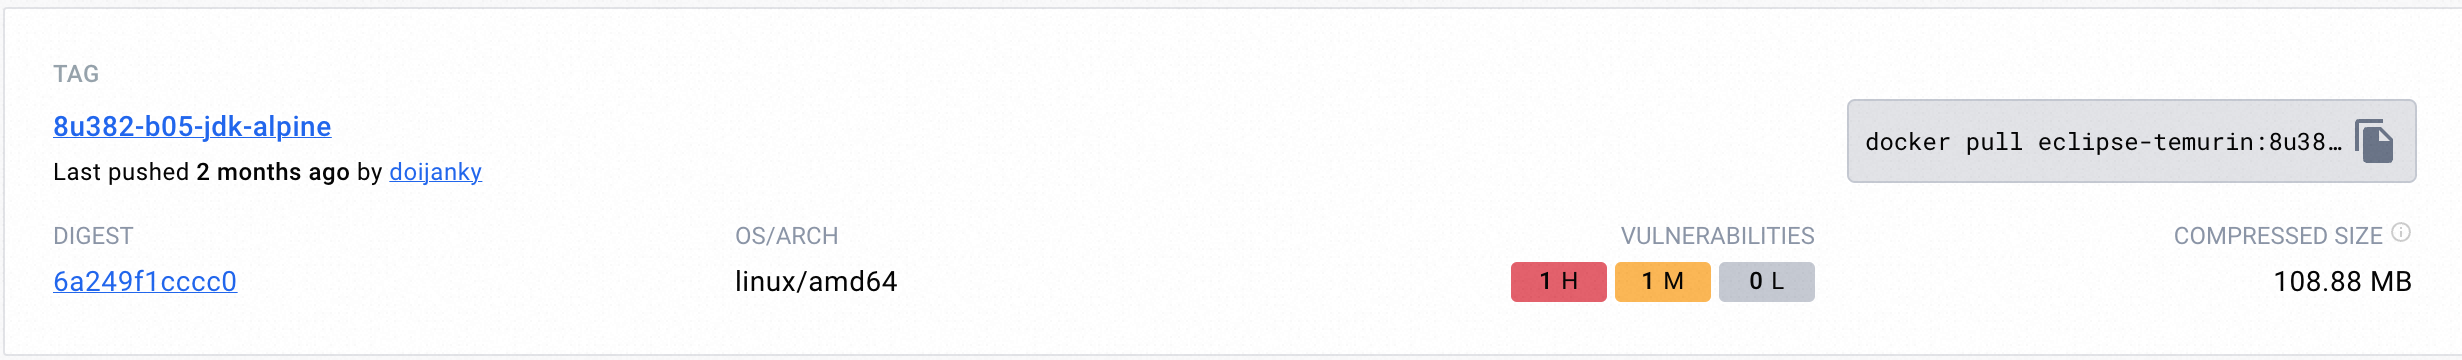
Examples of JDK versions built on non-Alpine Linux base images:
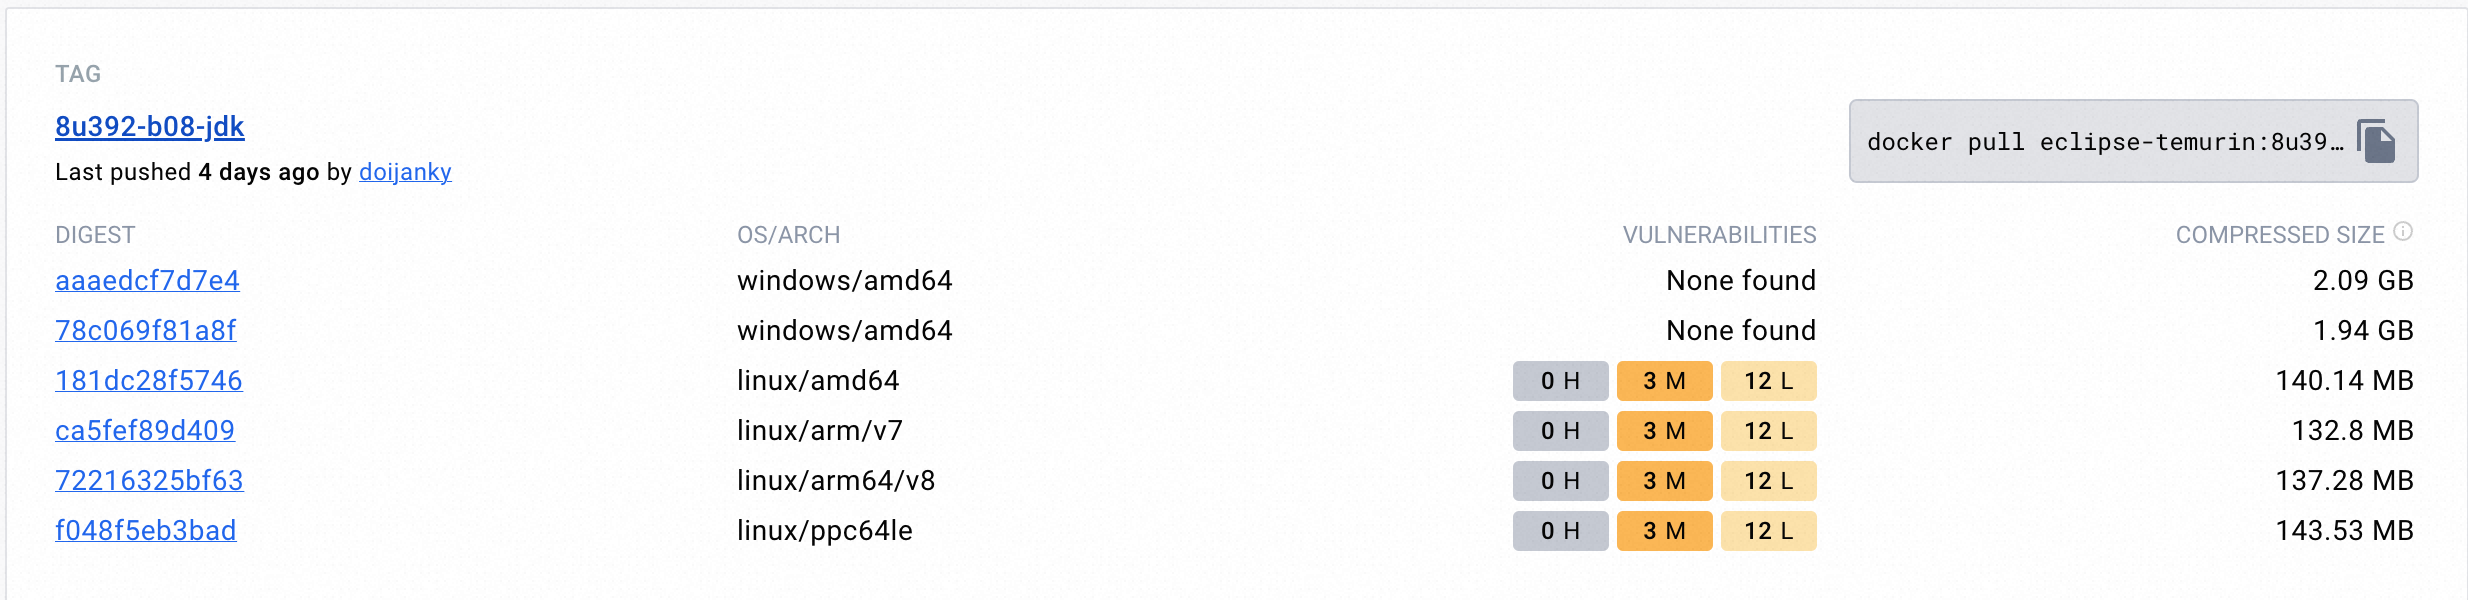
If the issue persists after you change base images, check whether the local cpc.log file contains the No AllocTracer symbols found .Are JDK debug symbols installed? error, which indicates missing debug symbols in your environment. In this case, use other base images or the standard Alpine Linux and JDK.
Use the standard Alpine Linux and JDK
Use an ARMS agent V3.2.8 or later and declare the Alpine Linux and JDK in your Dockerfile.
from Alpine:3.9
RUN apk add openjdk8