Identify and resolve node issues with diagnostic checks and AI-assisted root cause analysis.
When node diagnostics runs, ACK collects system version, workload/Docker/kubelet status, and key system log errors from each node. No business data or sensitive information is collected.
Node diagnostics consists of two components:
-
Diagnostic items: diagnose nodes, node components, cluster components, the Elastic Compute Service (ECS) controller manager, and GPU-accelerated nodes.
-
Root causes: locate root causes and suggest fixes by collecting cluster and node data, identifying anomalies, and performing in-depth analysis.
How it works
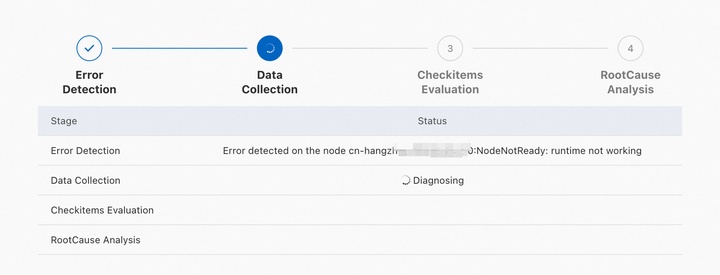
Diagnostic results go through four stages:
-
Anomaly identification: Collects basic signals — node status, pod status, and cluster event streams — and identifies anomalies.
-
Data collection: Gathers context-specific data based on identified anomalies, including Kubernetes node info, ECS instance details, and Docker/kubelet process status.
-
Diagnostic item check: Checks whether key metrics are within normal ranges. Items are grouped by category, each with a description.
-
Root cause analysis: Determines the root cause of issues based on collected data and check results.
Diagnostic results
Results fall into two types:
-
Root cause analysis results: include detected anomalies, the identified root cause, and fix suggestions.
-
Diagnostic item check results: include per-item check results. These can surface causes that root cause analysis may miss.
Diagnostic items vary by cluster configuration and reflect your actual cluster setup.
Use cases
Node diagnostics and AI-assisted diagnostics cover these scenarios.
| Category | Scenario |
|---|---|
| Node diagnostics | Node NotReady — network not ready, insufficient process IDs (PIDs), insufficient memory, insufficient disk space, runtime exceptions, or no heartbeat detected |
| Insufficient inode quota | |
| Insufficient PID quota | |
| Incorrect node time | |
| Read-only node file system | |
| Deadlocks in the node kernel | |
| AI-assisted diagnostics | Abnormal node status |
| Abnormal ECS instance status | |
| kubelet errors on nodes | |
| Runtime exceptions on nodes | |
| Insufficient disk space | |
| High CPU utilization on nodes |
Diagnostic items
| Category | What it checks |
|---|---|
| Node | Node status, network status, kernel logs, kernel processes, and service availability |
| NodeComponent | Status of key node components, including network and storage components |
| ClusterComponent | API server availability, DNS availability, and NAT gateway status |
| ECSControllerManager | ECS instance status, network connections, operating system health, and disk I/O |
| GPUNode | NVIDIA module status and container runtime configurations on GPU-accelerated nodes |
Node
If an issue persists after applying the suggested fix, collect node logs and submit a ticket.
| Diagnostic item | What it detects | Fix |
|---|---|---|
| Connectivity errors to the Kubernetes API server | Whether the node can reach the cluster's API server. Loss of connectivity prevents the node from receiving workload assignments. | Check the cluster configuration. See Troubleshoot ACK clusters. |
| AUFS mount hangs | Whether AUFS mount hangs are occurring on the node. | Submit a ticket. |
| BufferIOError errors | Whether BufferIOError errors are present in the node kernel. | Submit a ticket. |
| Cgroup leaks | Whether cgroup leaks are occurring. Cgroup leaks can interrupt monitoring data collection and cause container startup failures. | Log on to the node and delete the affected cgroup directories. |
| Abnormal chronyd process status | Whether the chronyd process is running normally. An abnormal chronyd process disrupts clock synchronization, affecting time-sensitive operations. | Run systemctl restart chronyd to restart the process. |
| Image pulling by containerd | Whether the containerd runtime can pull images as expected. | Check the node network configuration and image settings. |
| Containerd status | Whether the containerd runtime is running. | Submit a ticket. |
| CoreDNS pod availability | Whether the node can reach the CoreDNS pod's IP address. Unreachable CoreDNS pods cause DNS resolution failures for workloads on this node. | Check whether the node can access the CoreDNS pod IP address. See What do I do if the DNS query load is not balanced among CoreDNS pods?. |
| Image status | Whether images are intact. Damaged images prevent containers from starting. | Submit a ticket. |
| Overlay2 status of images | Whether the overlay2 file system in images is damaged. | Submit a ticket. |
| System time | Whether the system clock is accurate. | None. |
| Docker container startup | Whether Docker containers are failing to start. | Submit a ticket. |
| Docker image pulling | Whether the node can pull Docker images as expected. | Check the node network configuration and image settings. |
| Docker status | Whether the Docker runtime is running. | Submit a ticket. |
| Docker startup time | The startup time of Dockerd. | None. |
| Docker hang errors | Whether Docker hang errors are occurring on the node. Docker hangs can cause containers to stop responding. | Run systemctl restart docker to restart Docker. |
| ECS instance existence | Whether the underlying ECS instance exists. | Check the ECS instance status. See FAQ about nodes and node pools. |
| ECS instance status | Whether the ECS instance is in a healthy state. | Check the ECS instance status. See FAQ about nodes and node pools. |
| Ext4FsError errors | Whether Ext4FsError errors are present in the node kernel. | Submit a ticket. |
| Read-only node file system | Whether the node file system has become read-only. This typically indicates disk failure and blocks all write operations, affecting workloads. | Run fsck to repair the file system, then restart the node. |
| Hardware time | Whether the hardware clock and system clock are in sync. A difference greater than 2 minutes can cause component errors. | Run hwclock --systohc to sync the system time to the hardware clock. |
| DNS | Whether domain names can be resolved on the node. | See DNS troubleshooting. |
| Kernel oops errors | Whether oops errors are present in the node kernel. These indicate unexpected code paths and can cause instability. | Submit a ticket. |
| Kernel versions | Whether the kernel version is outdated. Outdated kernels may have known stability issues. | Update the node kernel. See FAQ about nodes and node pools. |
| DNS availability | Whether the node can reach the kube-dns Service cluster IP to use the cluster's DNS service. | Check the status and logs of CoreDNS pods. See DNS troubleshooting. |
| Kubelet status | Whether kubelet is running normally. A failed kubelet prevents the node from managing pods. | Check the kubelet logs. See Troubleshoot ACK clusters. |
| Kubelet startup time | The startup time of kubelet. | None. |
| CPU utilization | Whether the node's CPU utilization is excessively high. | None. |
| Memory utilization | Whether the node's memory utilization is excessively high. | None. |
| Memory fragmentation | Whether memory fragmentation exists on the node. Fragmentation reduces contiguous memory and can degrade workload performance. | Log on to the node and run echo 3 \> /proc/sys/vm/drop_caches to drop the cache. |
| Swap memory | Whether swap memory is enabled. Kubernetes requires swap to be disabled; enabling it can cause kubelet to behave unexpectedly. | Log on to the node and disable swap memory. |
| Loading of network device drivers | Whether VirtIO drivers on network devices are loaded correctly. | Submit a ticket. |
| Excessively high CPU utilization of the node | Whether CPU utilization was high over the past week. If many pods are scheduled to a node with consistently high CPU usage, resource contention can result in service interruptions. | Set resource requests and limits appropriately to avoid overloading the node. |
| Private node IP existence | Whether the node has a private IP address assigned. Without a private IP, the node cannot communicate within the cluster. | Remove the node from the cluster and add it back. Do not release the ECS instance when removing it. See Remove a node and Add existing ECS instances. |
| Excessively high memory utilization of the node | Whether memory utilization was high over the past week. High memory utilization combined with heavy pod scheduling can cause out-of-memory (OOM) errors and service interruptions. | Set resource requests and limits appropriately to avoid overloading the node. |
| Node status | Whether the node is in the Ready state. | Restart the node. See FAQ about nodes and node pools. |
| Node schedulability | Whether the node is marked as unschedulable. An unschedulable node does not receive new pod assignments. | Check the node's scheduling configuration. See Node draining and scheduling status. |
| OOM errors | Whether out-of-memory (OOM) errors are occurring on the node. OOM errors can cause pods and system processes to be killed. | Submit a ticket. |
| Runtime check | Whether the node's container runtime matches the cluster's configured runtime. A mismatch can cause pods to fail to start. | See Can I change the container runtime of a cluster from containerd to Docker?. |
| Outdated OS versions | Whether the node's OS version has known bugs or stability issues. Outdated OS versions can cause the Docker and containerd runtimes to malfunction. | Update the OS version. |
| Internet access | Whether the node can reach the internet. | Check whether SNAT is enabled for the cluster. See Enable an existing ACK cluster to access the internet. |
| RCUStallError errors | Whether RCUStallError errors are present in the node kernel. These errors indicate that a CPU core is stuck in a read-copy-update (RCU) critical section, which can cause the node to hang. | Submit a ticket. |
| OS versions | The OS version used by the node. Outdated OS versions may prevent the cluster from operating normally. | None. |
| Runc process leaks | Whether runc process leaks are occurring. Runc process leaks can cause the node to periodically enter the NotReady state. | Identify the leaked runc processes and terminate them manually. |
| SoftLockupError errors | Whether SoftLockupError errors are present in the node kernel. These indicate that a CPU core is not responding to interrupts, which can cause node instability. | Submit a ticket. |
| Systemd hangs | Whether systemd hangs are occurring. A hung systemd can prevent services from starting or stopping, affecting node stability. | Log on to the node and run systemctl daemon-reexec to restart systemd. |
| Outdated systemd versions | Whether the systemd version has known bugs. Outdated versions can cause Docker and containerd to malfunction. | Update the systemd version. See systemd. |
| Hung processes | Whether hung processes exist on the node. Hung processes consume resources without progress and degrade node performance. | Submit a ticket. |
| unregister_netdevice errors | Whether unregister_netdevice errors are present in the node kernel. These can cause kernel resource leaks and network instability. | Submit a ticket. |
NodeComponent
| Diagnostic item | What it detects | Fix |
|---|---|---|
| CNI component status | Whether the Container Network Interface (CNI) plugin is running as expected. A failed CNI plugin causes pod networking to stop on the node. | Check the status of the cluster's network component. See FAQ about network management. |
| CSI component status | Whether the Container Storage Interface (CSI) plugin is running as expected. A failed CSI plugin prevents pods from mounting volumes. | Check the status of the cluster's storage component. See FAQ about CSI. |
ClusterComponent
| Diagnostic item | What it detects | Fix |
|---|---|---|
| aliyun-acr-credential-helper version | Whether the aliyun-acr-credential-helper component version is outdated. | Update aliyun-acr-credential-helper. See Use the aliyun-acr-credential-helper component to pull images without using a secret. |
| API Service availability | Whether the cluster's API Service is available. An unavailable API Service blocks workload management operations. | Run kubectl get apiservice to check availability. If unavailable, run kubectl describe apiservice to identify the cause. |
| Insufficient available pod CIDR blocks | Whether the number of available pod CIDR blocks in a Flannel cluster is fewer than five. Each node requires one pod CIDR block; if all blocks are used, new nodes cannot join the cluster. | Submit a ticket. |
| CoreDNS endpoints | The number of active CoreDNS endpoints. Too few endpoints reduce DNS availability. | Check the status and logs of CoreDNS pods. See DNS troubleshooting. |
| CoreDNS cluster IP addresses | Whether cluster IP addresses are assigned to CoreDNS pods. Without a cluster IP, DNS requests cannot reach CoreDNS, causing service-wide DNS failures. | Check the status and logs of CoreDNS pods. See DNS troubleshooting. |
| NAT gateway status | Whether the cluster's NAT gateway is functioning normally. A failed NAT gateway blocks outbound internet traffic from nodes without a public IP. | Log on to the NAT Gateway console and check whether the gateway is locked due to overdue payments. |
| Excessively high rate of concurrent connection drops on the NAT gateway | Whether the NAT gateway is dropping an abnormally high rate of concurrent connections. High drop rates indicate the gateway has reached its connection capacity. | Upgrade the NAT gateway. See FAQ about upgrading standard Internet NAT gateways to enhanced Internet NAT gateways. |
ECSControllerManager
| Diagnostic item | What it detects | Fix |
|---|---|---|
| Overdue payments related to ECS instance components | Whether the instance's disk or network bandwidth is restricted due to overdue payments. Restricted resources can cause workload failures. | Top up your account to restore access. |
| Overdue payments related to the ECS instance | Whether the pay-as-you-go ECS instance has been suspended due to overdue payments. | Top up your account, then restart the instance. |
| ECS instance NIC status | Whether the instance's network interface card (NIC) is functioning normally. An abnormal NIC causes network connectivity loss. | Restart the instance. |
| ECS instance startup status | Whether the instance can be booted normally. | If the boot fails, create a new instance. |
| Status of ECS instance backend management system | Whether the instance's backend management system is operating normally. | Restart the instance. |
| Status of ECS instance CPUs | Whether CPU contention or CPU binding failures exist at the instance's underlying layer. CPU contention can prevent the instance from acquiring CPU resources and degrade performance. | Restart the instance. |
| Split locks in the CPUs of the ECS instance | Whether split locks are occurring in the ECS instance's CPUs. Split locks can severely degrade CPU performance. | See Detecting and handling split locks. |
| Status of DDoS mitigation for the ECS instance | Whether the instance's public IP address is under a DDoS attack. | Purchase an anti-DDoS service. See Comparison of Alibaba Cloud Anti-DDoS solutions. |
| Limited read/write capabilities of the cloud disk | Whether cloud disk read/write throughput is being throttled. Throttling occurs when maximum IOPS is reached, causing I/O operations to slow down or queue. | See Block storage performance. |
| Loading of the ECS instance disk | Whether the cloud disk can be attached when the instance starts. | Stop the instance and start it again. |
| ECS instance expiration | Whether the subscription instance has expired. An expired instance is stopped and its resources become unavailable. | Renew the instance. See Renew a subscription instance. |
| ECS instance OS crashes | Whether OS crashes have occurred within the past 48 hours. | Review the system logs to identify the cause. See View system logs and screenshots. |
| Status of the ECS instance host | Whether the physical server hosting the instance has failures. Host failures can degrade instance performance. | Restart the instance. |
| Loading of the ECS instance image | Whether the instance can load its image during initialization. | Restart the instance. |
| I/O hangs on the ECS instance disk | Whether I/O hangs are occurring on the system disk. Disk I/O hangs can cause the operating system to become unresponsive. | Check disk metrics. See View the monitoring data of a cloud disk. For Alibaba Cloud Linux 2, see Detect I/O hangs of file systems and block layers. |
| ECS instance bandwidth upper limit | Whether the instance's total bandwidth has reached the maximum for its instance type. When the limit is reached, network throughput is capped and packets may be dropped. | Upgrade to an instance type with higher bandwidth. See Overview of instance configuration changes. |
| Upper limit of the burst bandwidth of the ECS instance | Whether the instance's burst bandwidth has exceeded the maximum allowed for its instance type. | Upgrade to an instance type with higher bandwidth. See Overview of instance configuration changes. |
| Loading of the ECS instance NIC | Whether the NIC can be loaded on the instance. If the NIC fails to load, the instance loses network connectivity. | Restart the instance. |
| NIC session establishment on the ECS instance | Whether sessions can be established to the NIC. If the NIC cannot establish sessions or has reached its session limit, network connectivity or throughput is affected. | Restart the instance. |
| Key operations on the ECS instance | Whether recent operations on the instance — such as starting, stopping, or upgrading — completed successfully. | Retry the failed operation. |
| Packet loss on the ECS instance NIC | Whether inbound or outbound packet loss is occurring on the NIC. Packet loss causes network errors and can disrupt services. | Restart the instance. |
| ECS instance performance degradation | Whether the instance's performance has been temporarily degraded due to software or hardware issues. | View the instance's historical events or system logs to identify the cause. See View historical system events. |
| Compromised ECS instance performance | Whether the instance's performance is reduced. Insufficient CPU credits cause burstable instances to fall back to baseline performance. | The ECS instance can provide only the baseline performance due to insufficient available CPU credits. |
| ECS instance disk resizing | Whether the disk has been resized but the OS has not yet expanded the file system. The additional disk space is unavailable until the file system is resized. | The OS does not automatically resize the file system after disk resizing. If the disk remains unusable, resize it again. |
| ECS instance resource application | Whether sufficient physical CPU and memory resources are available for the instance. If resources are insufficient, the instance cannot start. | Wait a few minutes and try starting the instance again. If the issue persists, create an instance in a different region. |
| ECS instance OS status | Whether kernel panics, OOM errors, or internal failures have occurred in the instance OS. These are often caused by misconfigured settings or user programs. | Restart the instance. |
| ECS instance virtualization status | Whether exceptions exist in the underlying virtualization layer. These can cause the instance to stop responding or be unexpectedly suspended. | Restart the instance. |
GPUNode
| Diagnostic item | What it detects | Fix |
|---|---|---|
| Container runtime | Whether the container runtime on the GPU-accelerated node is valid. ACK supports only Docker and containerd for GPU-accelerated nodes. | Check the status of the Docker or containerd runtime on the node. |
| NVIDIA-Container-Runtime version | Whether the NVIDIA-Container-Runtime version is compatible with the cluster. An incompatible or missing NVIDIA-Container-Runtime prevents GPU containers from starting. | 1. Check whether the NVIDIA-Container-Runtime version matches the cluster's Kubernetes version. See Release notes for Kubernetes versions. 2. If the issue persists, collect diagnostic data and submit a ticket. See Collect diagnostic data from GPU-accelerated nodes. |
| cGPU module status | Whether the cGPU module is running as expected on nodes with GPU sharing enabled. | 1. Check whether the cGPU component is installed. See Install the GPU sharing component. 2. If the module still fails, collect diagnostic data and submit a ticket. See Collect diagnostic data from GPU-accelerated nodes. |
| Container runtime configurations | Whether the container runtime on the GPU-accelerated node is correctly configured. Misconfiguration prevents GPU containers from running. | Check whether the nvidia-container-runtime field is specified in the runtime configuration file: Docker — /etc/docker/daemon.json; containerd — /etc/containerd/config.toml. |
| NVIDIA-Container-Runtime status | Whether NVIDIA-Container-Runtime is running as expected. | Collect diagnostic data and submit a ticket. See Collect diagnostic data from GPU-accelerated nodes. |
| NVIDIA module status | Whether the NVIDIA kernel module is running as expected on the GPU-accelerated node. A failed NVIDIA module prevents all GPU workloads from running. | 1. Diagnose the GPU-accelerated node. See GPU FAQ. 2. Collect diagnostic data and submit a ticket. See Collect diagnostic data from GPU-accelerated nodes. |