Monitor cloud disk IOPS, throughput, and latency in the ECS, EBS, or CloudMonitor console to identify performance bottlenecks.
Background
Disk performance is measured by the following metrics:
-
IOPS: the number of read/write operations that an EBS device processes per second. High IOPS is essential for transaction-intensive applications.
-
Throughput: the amount of data transferred per second (MB/s). High throughput is essential for sequential read/write-intensive applications.
-
Latency: the time required for an EBS device to process an I/O request (seconds, milliseconds, or microseconds). High latency may degrade performance or cause errors in latency-sensitive applications.
For performance details of each cloud disk category, see Block storage performance.
View cloud disk monitoring data in the ECS console
The ECS console displays minute-level IOPS, throughput, and latency for each cloud disk.
In the upper-left corner of the page, select a region and resource group.

-
Find the target cloud disk and click its ID to go to the Basic Information tab.
-
Click the Monitoring tab.
-
In the Time Range section, click the
 icon and specify the time range to query.
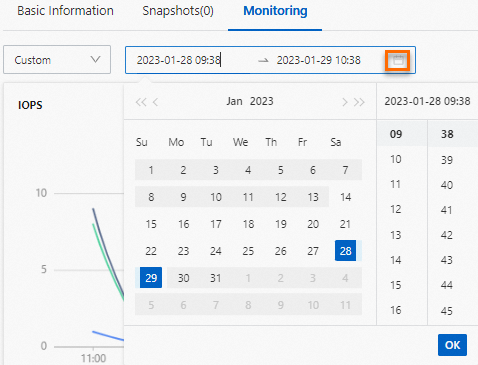
-
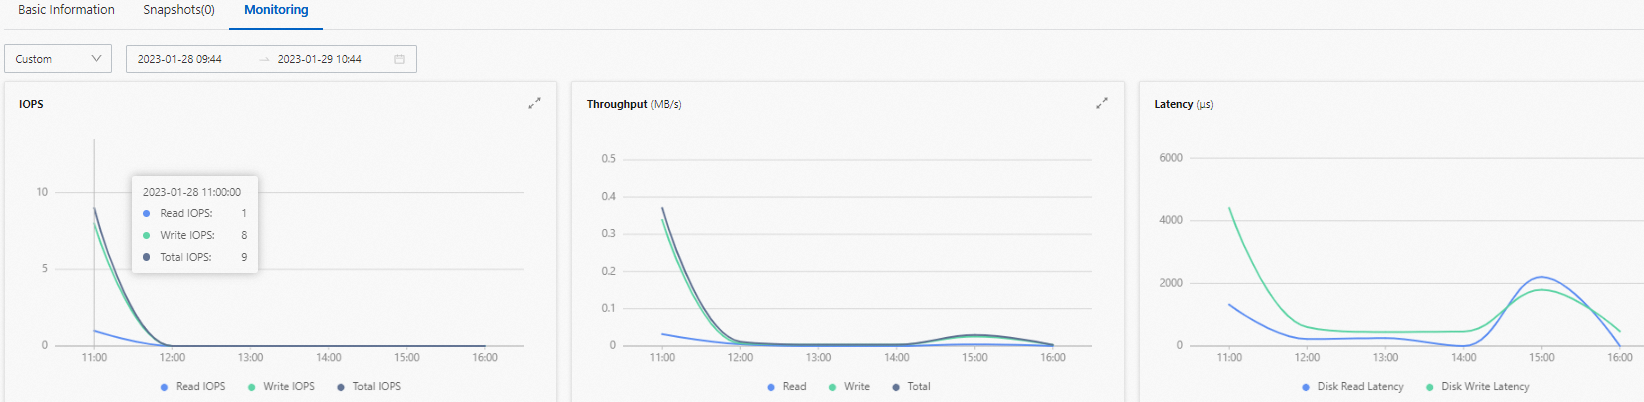
View the monitoring data. Hover over a data point in the charts to view metric details.
-
View the IOPS, throughput, and latency.
-
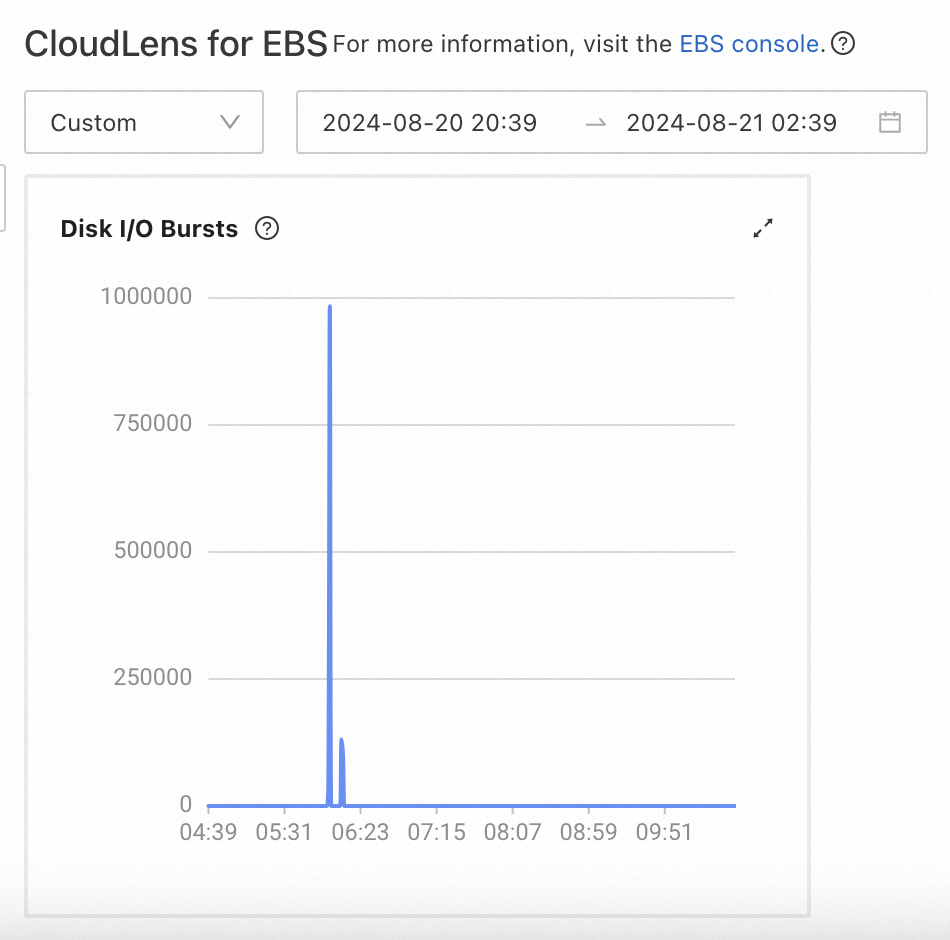
For ESSD AutoPL disks, specify a time range of up to 6 hours to view I/O burst counts.
-
View cloud disk monitoring data with CloudLens for EBS
Unlike the ECS console's minute-level data, CloudLens for EBS provides near-real-time, finer-grained performance monitoring. See Disk analysis.
CloudLens for EBS also detects risk scenarios, such as disks reaching performance limits or missing backup snapshots, and reports risk events for timely action. See Disk events.
View cloud disk monitoring data in the CloudMonitor console
CloudMonitor collects OS-level metrics such as disk usage, inode usage, and byte counts, and supports alert rules for these metrics. The following table lists the available cloud disk metrics.
Metric | Description | Unit | MetricName | Dimensions | Statistics |
Host.diskusage.used | The disk space in use. | Byte | diskusage_used | userId, instanceId, and device | Maximum, Minimum, and Average |
Host.diskusage.utilization | The disk usage. | % | diskusage_utilization | userId, instanceId, and device | Maximum, Minimum, and Average |
Host.diskusage.free | The size of available disk space for regular users and superusers. | Byte | diskusage_free | userId, instanceId, and device | Maximum, Minimum, and Average |
(Agent)disk.usage.avail_device | The size of available disk space for regular users. | Byte | diskusage_avail | userId, instanceId, and device | Maximum, Minimum, and Average |
Host.diskusage.total | The size of the total disk space. | Byte | diskusage_total | userId, instanceId, and device | Maximum, Minimum, and Average |
(Agent)disk.read.bps_device | The number of bytes that are read from the disk per second. | Byte/s | disk_readbytes | userId, instanceId, and device | Maximum, Minimum, and Average |
(Agent)disk.write.bps_device | The number of bytes that are written to the disk per second. | Byte/s | disk_writebytes | userId, instanceId, and device | Maximum, Minimum, and Average |
(Agent)disk.read.iops_device | The number of read requests that the disk receives per second. | Requests/s | disk_readiops | userId, instanceId, and device | Maximum, Minimum, and Average |
(Agent)disk.write.iops_device | The number of write requests that the disk receives per second. | Requests/s | disk_writeiops | userId, instanceId, and device | Maximum, Minimum, and Average |
To view cloud disk monitoring data and configure alert rules in the CloudMonitor console:
-
Log on to the CloudMonitor console.
-
View the monitoring data of a cloud disk.
-
In the left-side navigation pane, click Host Monitoring.
-
Find the target ECS instance and click its name in the Host Name/ID column.
-
On the Host Monitoring Details page, click the OS Monitoring tab.
-
In the Disk Metric section, view the cloud disk monitoring data.

-
-
(Optional) Configure alert rules for the cloud disk.
See Monitor a host.
NoteConfigure alert rules based on your business scenarios. When disk metrics meet alert conditions, CloudMonitor sends notifications for timely issue resolution.